The Empirical Analysis of the Voting Results in the UN General Assembly

Almanac: Globalistics and globalization studiesGlobal Transformations and Global Future.
In this paper we present our quantitative data analysis of voting dynamics in the UN General Assembly within the period from 1946 to 2014. The obtained results reveal several phases in the development of relations between different countries. The analysis also shows that nowadays there are two key players on the world scene which are completey different to each other in every way. They are the USA and the group of BRICS nations (other countries' voting corresponds either with USA or with BRICS). The results can be used to identify the trends in the sphere of international relations.
Keywords: voting, the United Nations, consistency criterion, synchronization.
Introduction
Experts in the sphere of internation relations carefully study and analyze the dynamics of interstate interactions, intergration and disintegration processes, international tensions and interstate alliances.
This analysis is mainly based on the study and interpretation of specific events in political history. The interpretation crucially depends on the researcher's political views. However, it is better to use hard data in order to increase the reliability of the analysis. One of the reliable quantitative information sources in international politics is statistical data and the UN General Assembly voting figures. Since the establishment of the United Nations in 1946, there have been held more than 5,393 voting procedures (with an average of 78 procedures per year). This data helps to determine patterns in the sphere of international politics, and to identify the dynamics of integration and disintegration processes. In this article we present the aforementioned analysis.
Sources of Information and Methods of Analysis
E. Voeten's data was used to determine the voting patterns in the UN GA within the period of 1946–2014 (Voeten 2013). We also used the data collected by M. A. Bailey, A. Strezhnev, E. Voeten (Bailey, Strezhnev, and Voeten 2015).
We also stuck to A. Lijphart's approach to identify the consistency criterion. The former is represented by the equation below:
 , (1)
, (1)
where IA is the consistency criterion in the observed period, t is the total number of votes, f is the number of the votes when the two countries voted in the same way, g is the number of the votes when one country voted ‘yes’ or ‘no’, while the other countries abstained. The cases where the two countries voted in the opposite ways are not taken into account by the variable g.
The Voting Dynamics in the UN General Assembly
Figures 1–7 show the voting dynamics of the UN General Assembly members within the period from 1946 to 2014. Colored vertical charts show certain information about each vote. Top white section demonstrates the votes for the resolution, middle grey section demonstrates the ones abstained from voting, lower black section demonstrates the votes against the resolution. The charts follow one another in the order of voting procedures (total of 5,393 votes during 1946–2014). The x-axis contains the years when the voting procedures were held.
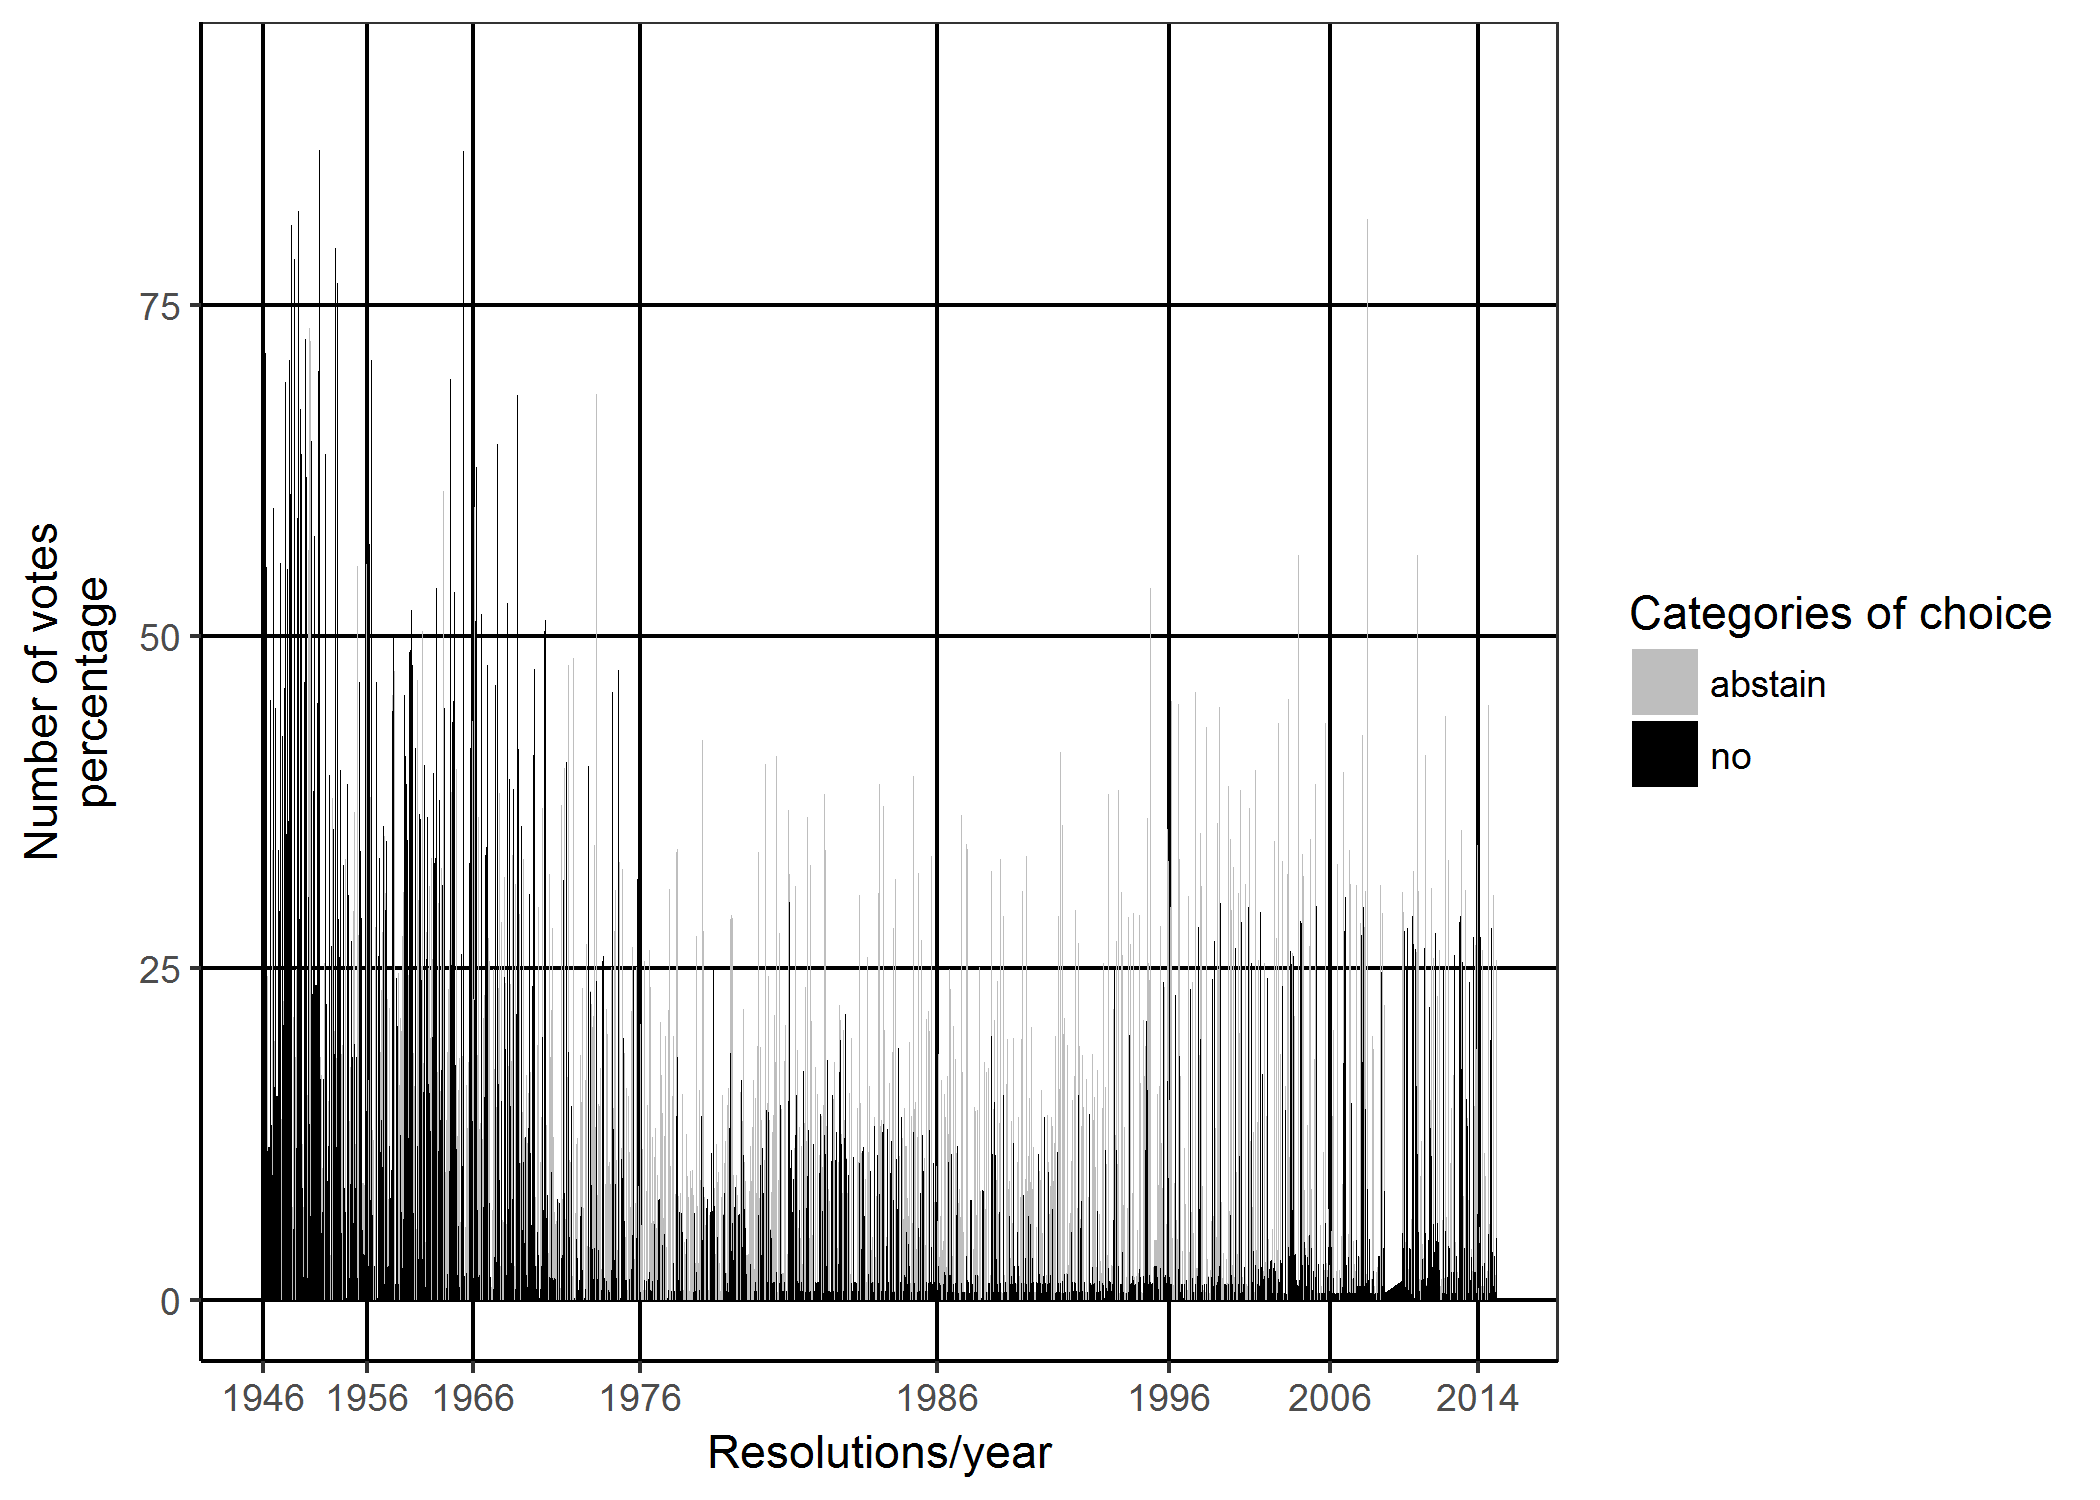
Fig. 1. Voting dynamics in the UN General Assembly, 1946–2014, %
On the basis of the data in Fig. 1, we can identify at least three periods, during which the relations between countries differed.
-
the first period (1948–1970) is characterized by strong antagonism in the voting (there are more countries which voted against than the countries which abstained). This antagonism is defined by high political tension between the two blocks on the world scene.
-
the second period (1970 – the end of the 1990s) is characterized by rather compromising positions between the two international political blocks (détente between the NATO and the Warsaw Pact member states and Russian foreign policy changes after the collapse of the USSR);
-
the third period (from the beginning of 2000s) is characterized by growing confrontation between the USA and the BRICS nations regarding certain issues of global development, which is most likely caused by sustainable and successful development of the latter.
Figures 2–7 show the voting dynamics in the UN General Assembly.
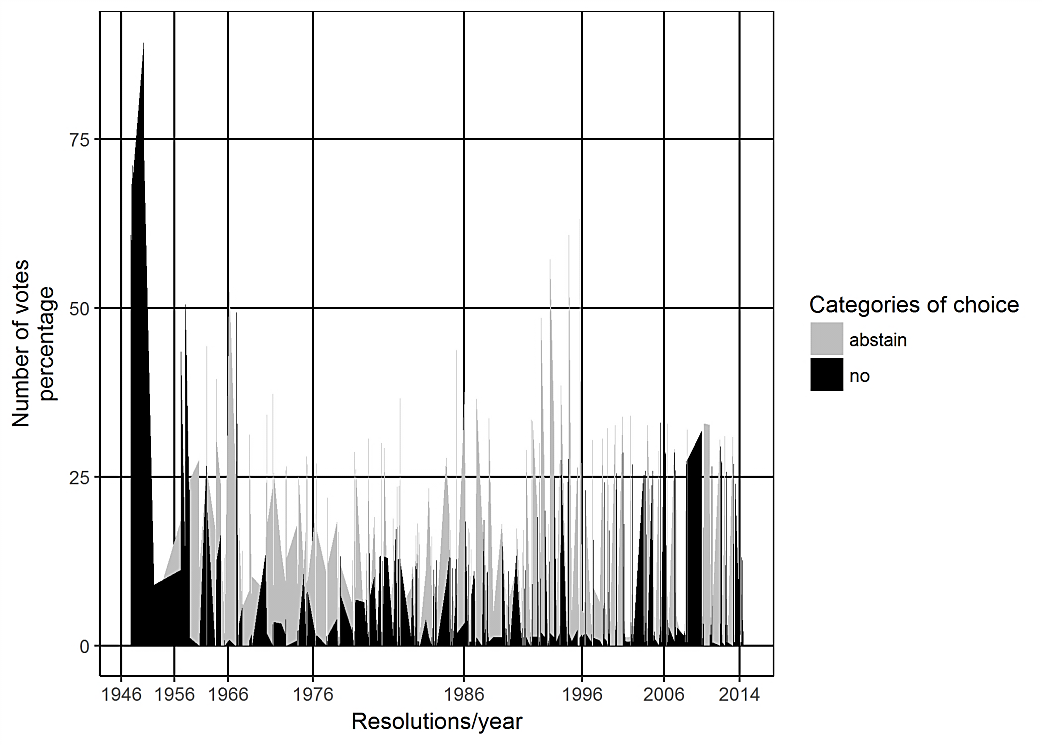
Fig. 2. Voting dynamics regarding the issue of nuclear weapons, percent, 1946–2014
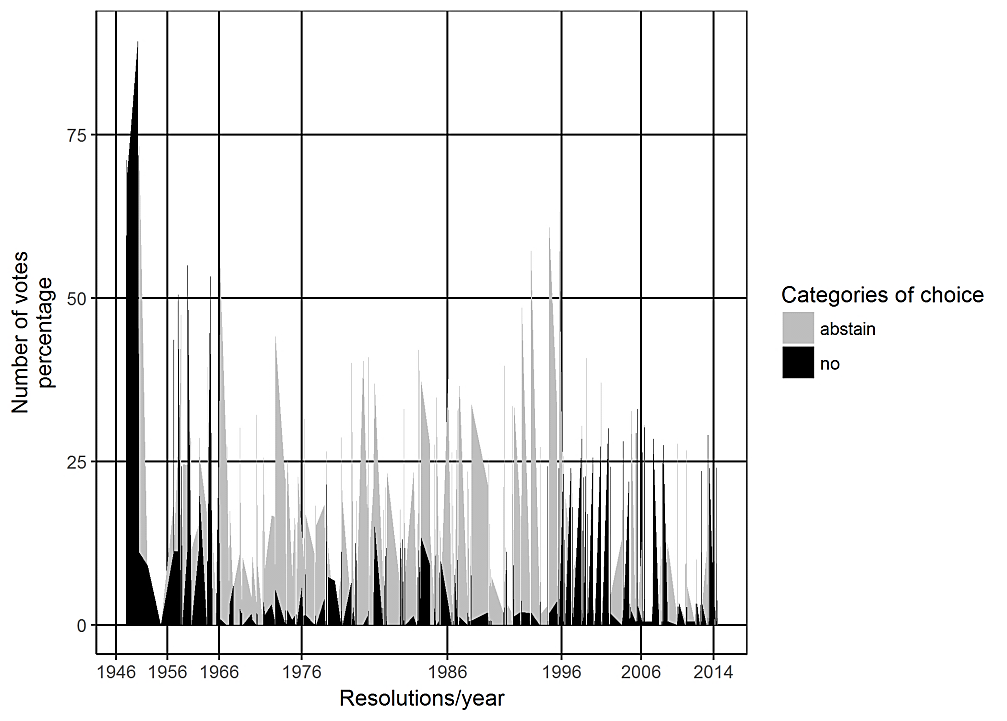
Fig. 3. Voting dynamics regarding the issue of arms control, percent, 1946–2014

Fig. 4. Voting dynamics regarding the Palestinian Conflict issue, percent, 1946–2014
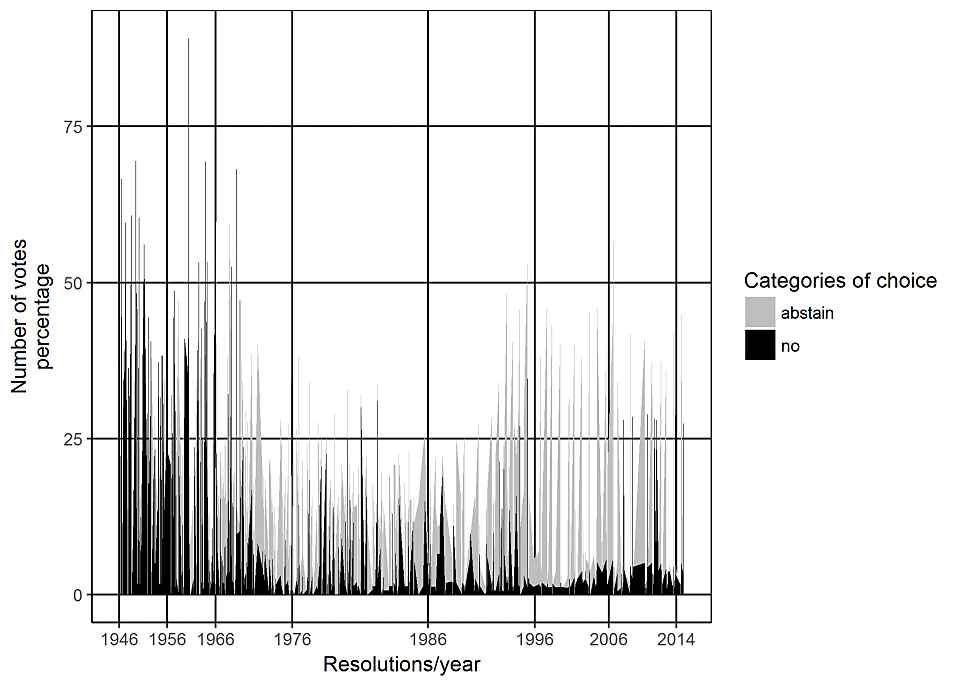
Fig. 5. Voting dynamics regarding the issue of colonialism, percent, 1946–2014
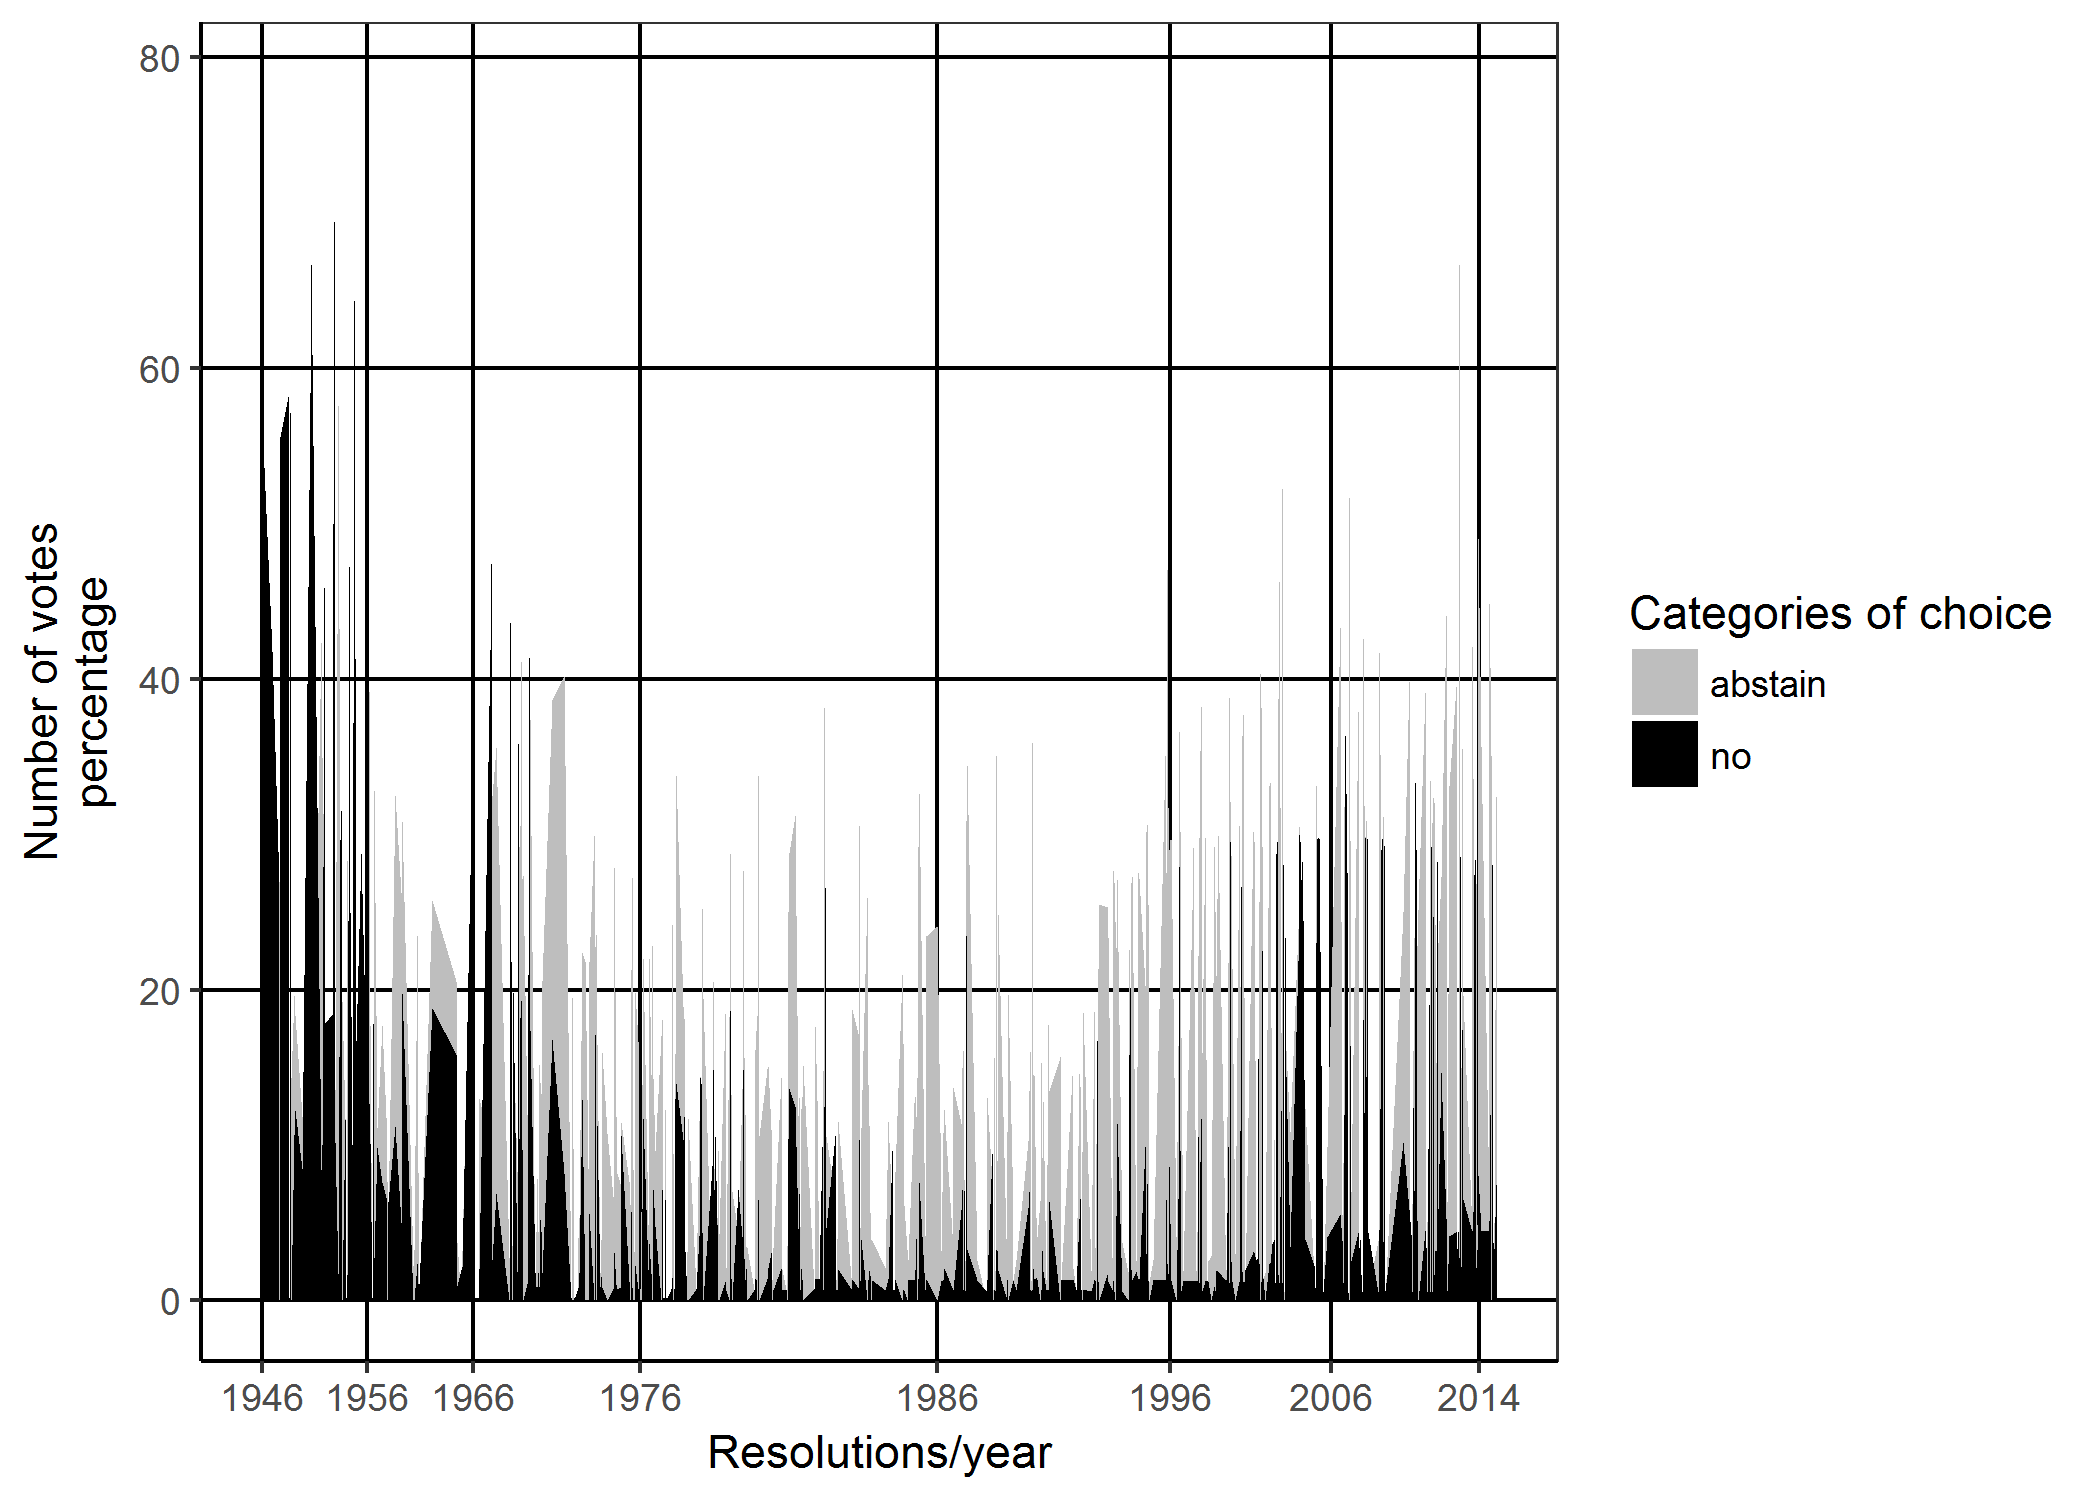
Fig. 6. Voting dynamics regarding the issues of the human rights, percent, 1946–2014

Fig. 7. Voting dynamics regarding the issues of economic development, percent, 1946–2014
It is evident that voting dynamics regarding specific topics are similar to the main trends of voting dynamics in general. However, voting dynamics regarding the issues of the Palestinian conflict are slightly different (see Fig. 4). In this case the second period mentioned above continues hitherto.
Voting Сonsistency Вynamics
Available data on voting allows us to analyze the consistency dynamics. This analysis is based on the consistency criterion and the Lijphart's approach (Lijphart 1963).
Figures 8–22 show the consisteny criterions (IA) reflecting the voting of the US, the Soviet Union/Russian Federation, China, India, Brazil votes (if IA equals to 1, the consistency is absolute; if IA equals to 0, the countries vote in opposite ways). Consistency criterion was calculated for each year separately.
Fig. 8 shows the consistency dynamics of each BRICS nation and the United States within the period from 1946 to 2014.
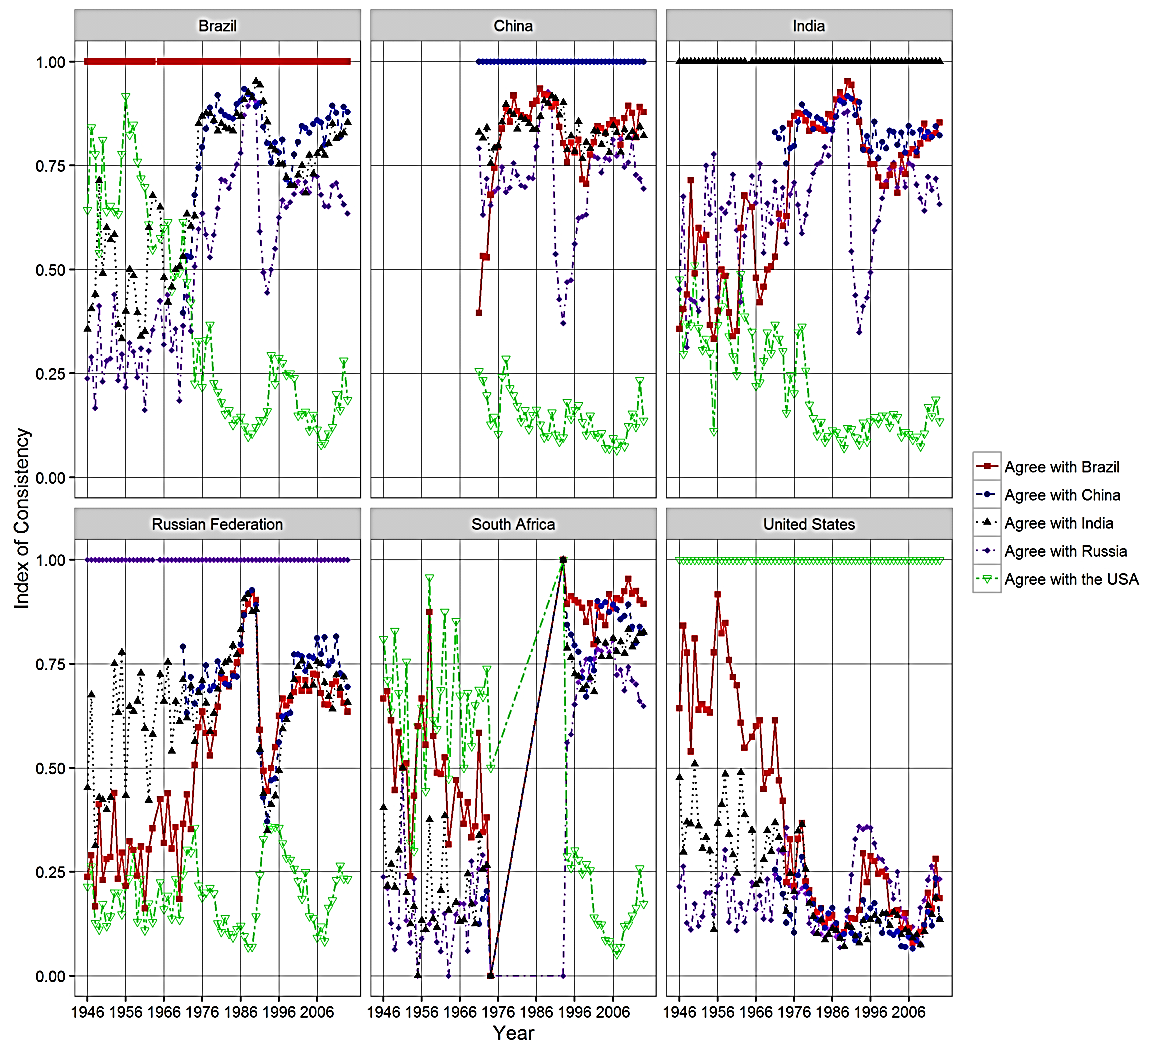
Fig. 8. The consistency dynamics of the BRICS nations and the United States, 1946–2014
Fig. 8 shows that since the second half of the 1970s, the BRICS nations' positions have considerably differed from the US position. Hitherto BRICS nations had formed a political power opposing the US.
Below one might find a detailed voting dynamics for each of the above-mentioned countries.
Despite the fact that in 1976, Brazil and the United States signed a ‘Memorandum of Understanding’ (US considered Brazil to be a stronghold of their policy throughout Latin America), Brazil's voting in the GA has been changing dramatically since the 1970s and often coincided with the voting of the BRICS nations. Within the period of 1990–2000 Brazil tried to distance itself from the US policy while supporting the regional initiatives such as MERCOSUR, the Union of South American Nations, Council of South American Defense and the Community of Latin American and Caribbean States. Within the period of 2000–2006 there was considerable disagreement between Brazil and the USA. During the last stage, however, the tensions have eased.
China's voting corresponds with that of BRICS nations as opposed to the USA.
After gaining its independence India was developing its own foreign policy maneuvering between the BRICS nations' and the United States' interests. Shortly after the former synchronized its voting with that of the BRICS nations rather than the United States.
South Africa is similar to India in terms of the foreign policy development: during apartheid RSA also maneouvered between the USA and the BRICS nations. South African post-apartheid foreign policy and voting corresponds with those of BRICS members (the lack of data within the period from 1975 to 1995 is due to expulsion of South Africa from the UN).
Russian foreign policy has been uneven. Until 1976 there had been contradictions between the USSR and the USA and the USSR policy regarding BRICS nations was uneven as well. Within the period from 1976 to 1990 soviet policy synchronized with that of the BRICS nations and differed from that of the USA. After the collapse of the Soviet Union (1991–1995) the opposite trend prevailed: synchronization with the USA and political separation from other BRICS countries. Some time later the trend changed drastically, and Russian foreign policy aligned with that of the BRICS nations and there were rising tensions with the US. One of the reasons for the latter might be the period of Medvedev's policy and negative image of Russia in mass media after the Russo-Georgian War in 2008.
The following figures show the level of political consistency of other coutries with either the BRICS nations or the US.
Figs. 9 and 10 show the consistency criterion dynamics of some countries of the former Third World. It is apparent that during the last decades all these countries synchronized with the BRICS nations. Significant differences can be observed only within the period of 1946–1976: some countries, such as Colombia, Cuba, Egypt, Iran, Venezuela and Côte d'Ivoire started supporting BRICS' position rather than the one of the US; positions of the coutries such as Indonesia, Afghanistan, Belarus, Libya and Qatar either differed from the one of the United States, or those countries maneuvered between the US position and that of the BRICS countries.
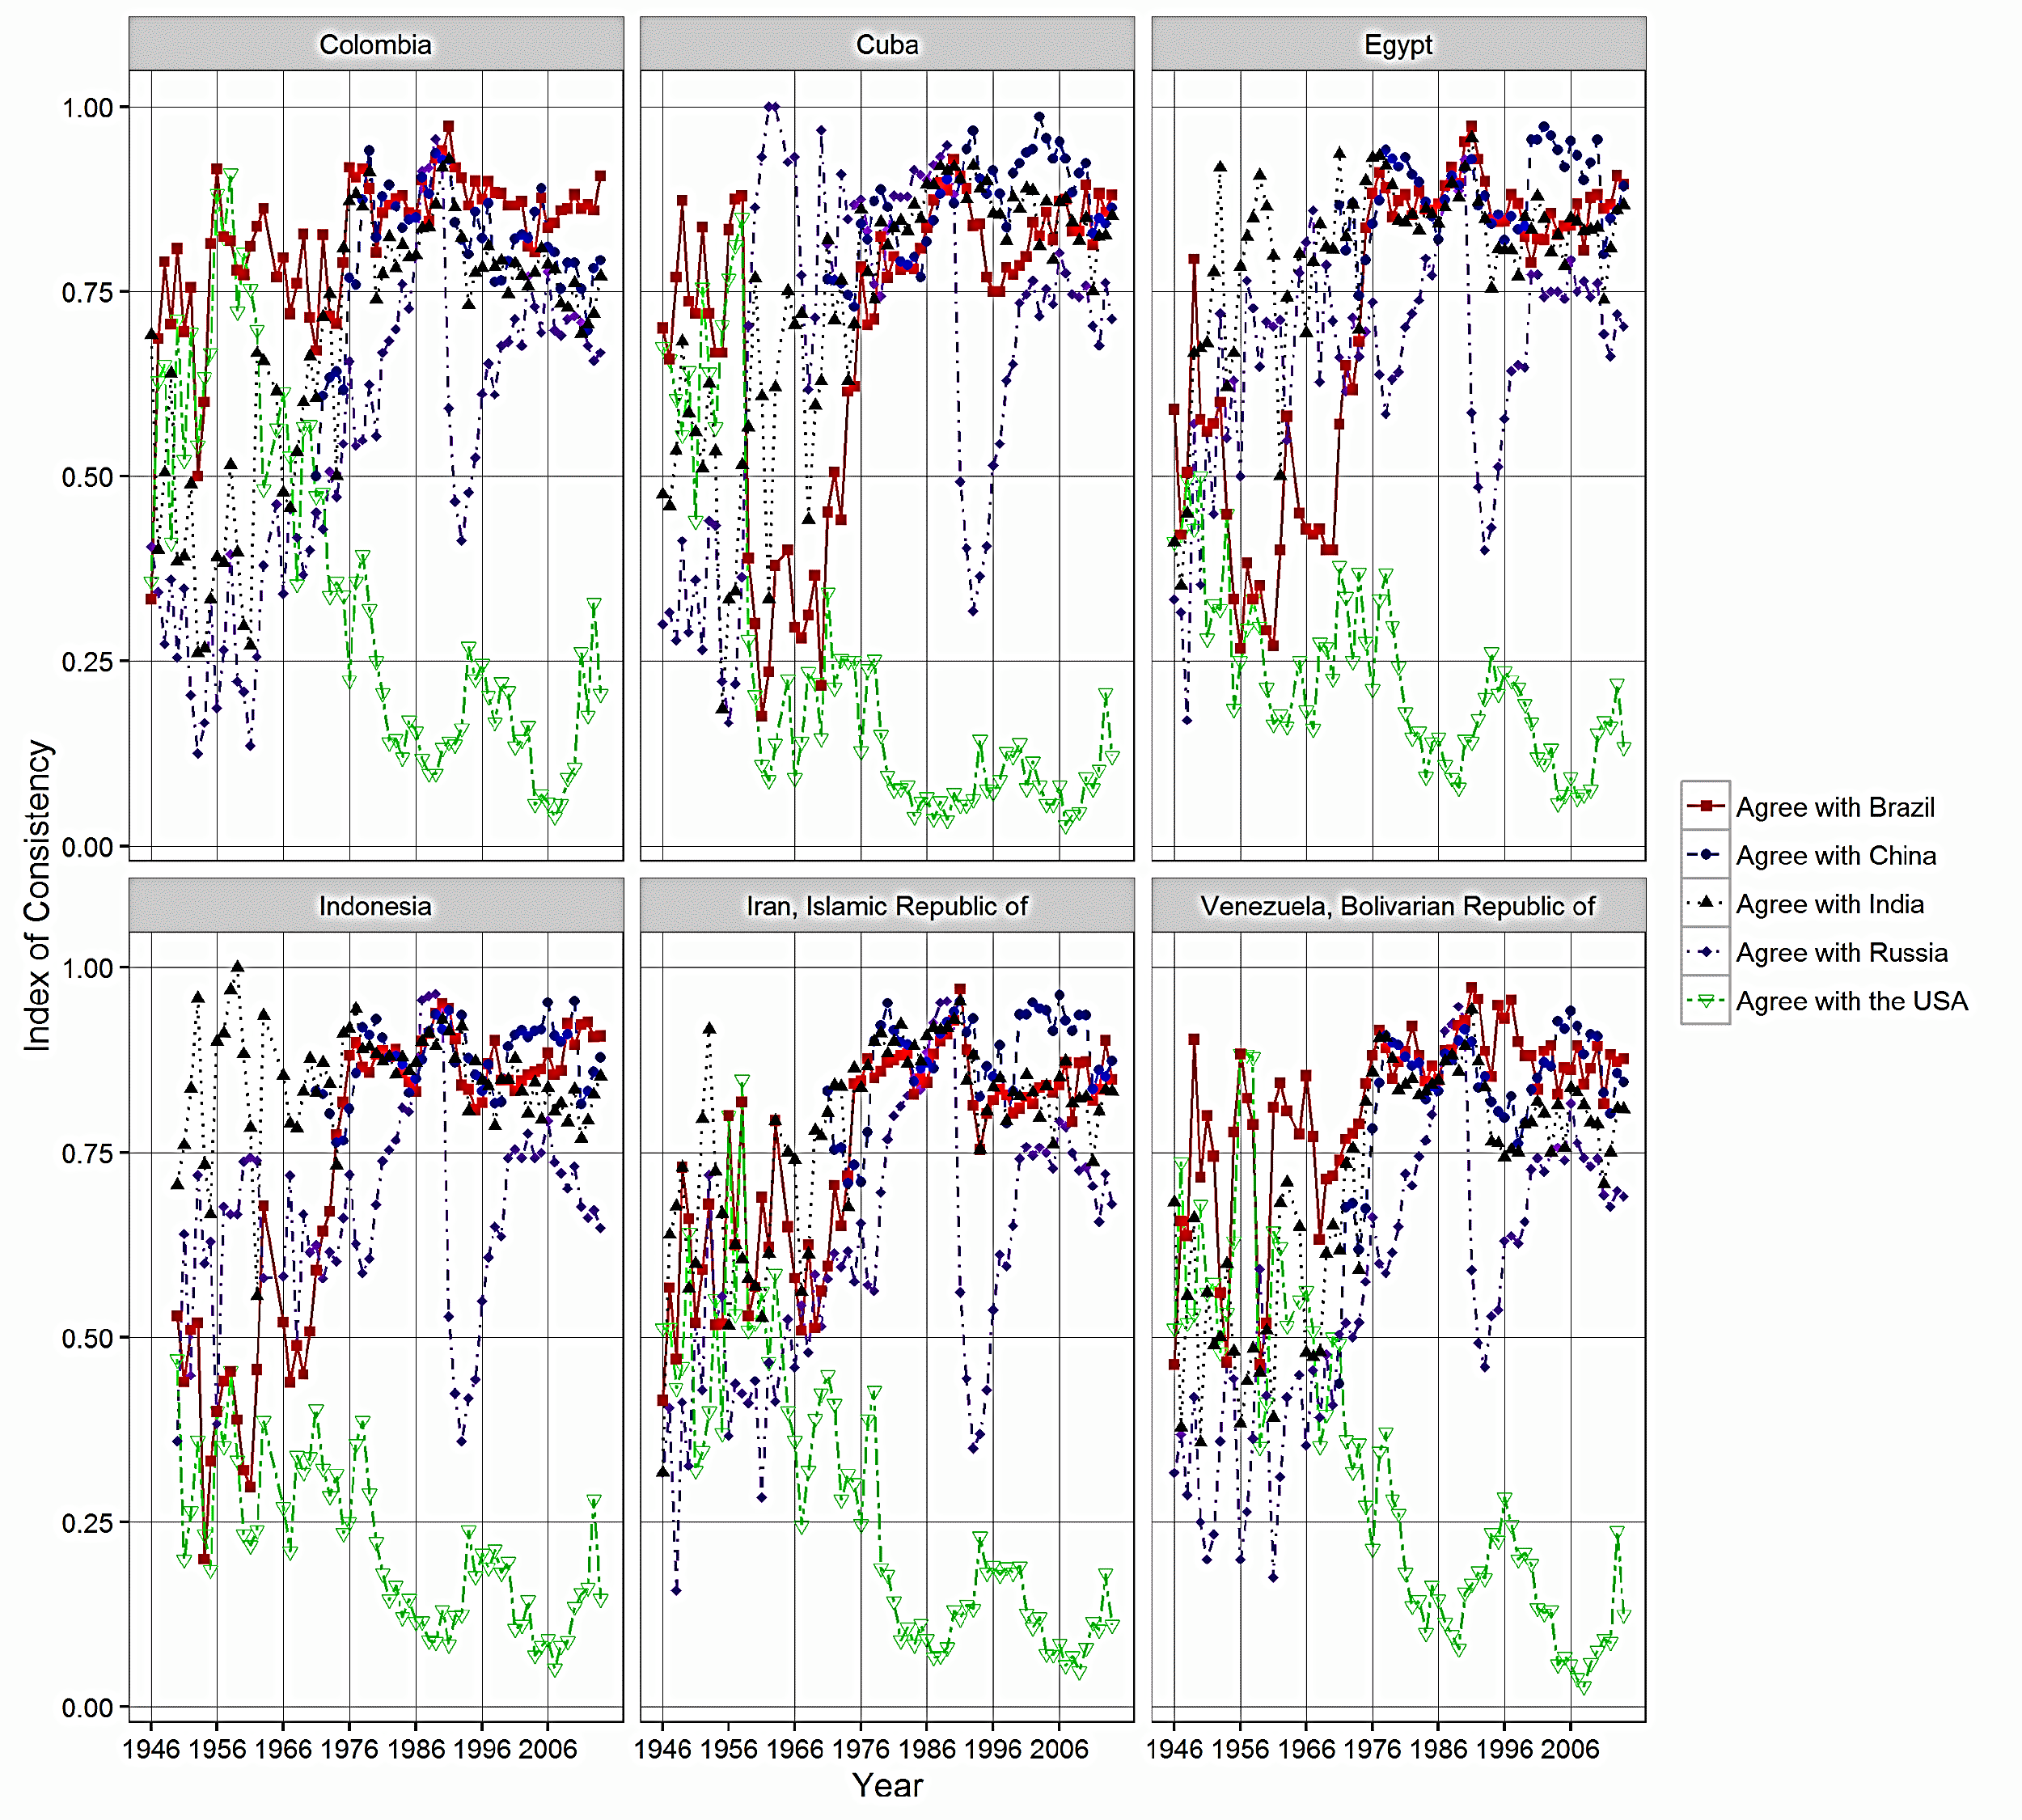
Fig. 9. Consistency criterion dynamics of some countries of the former Third world, 1946–2014
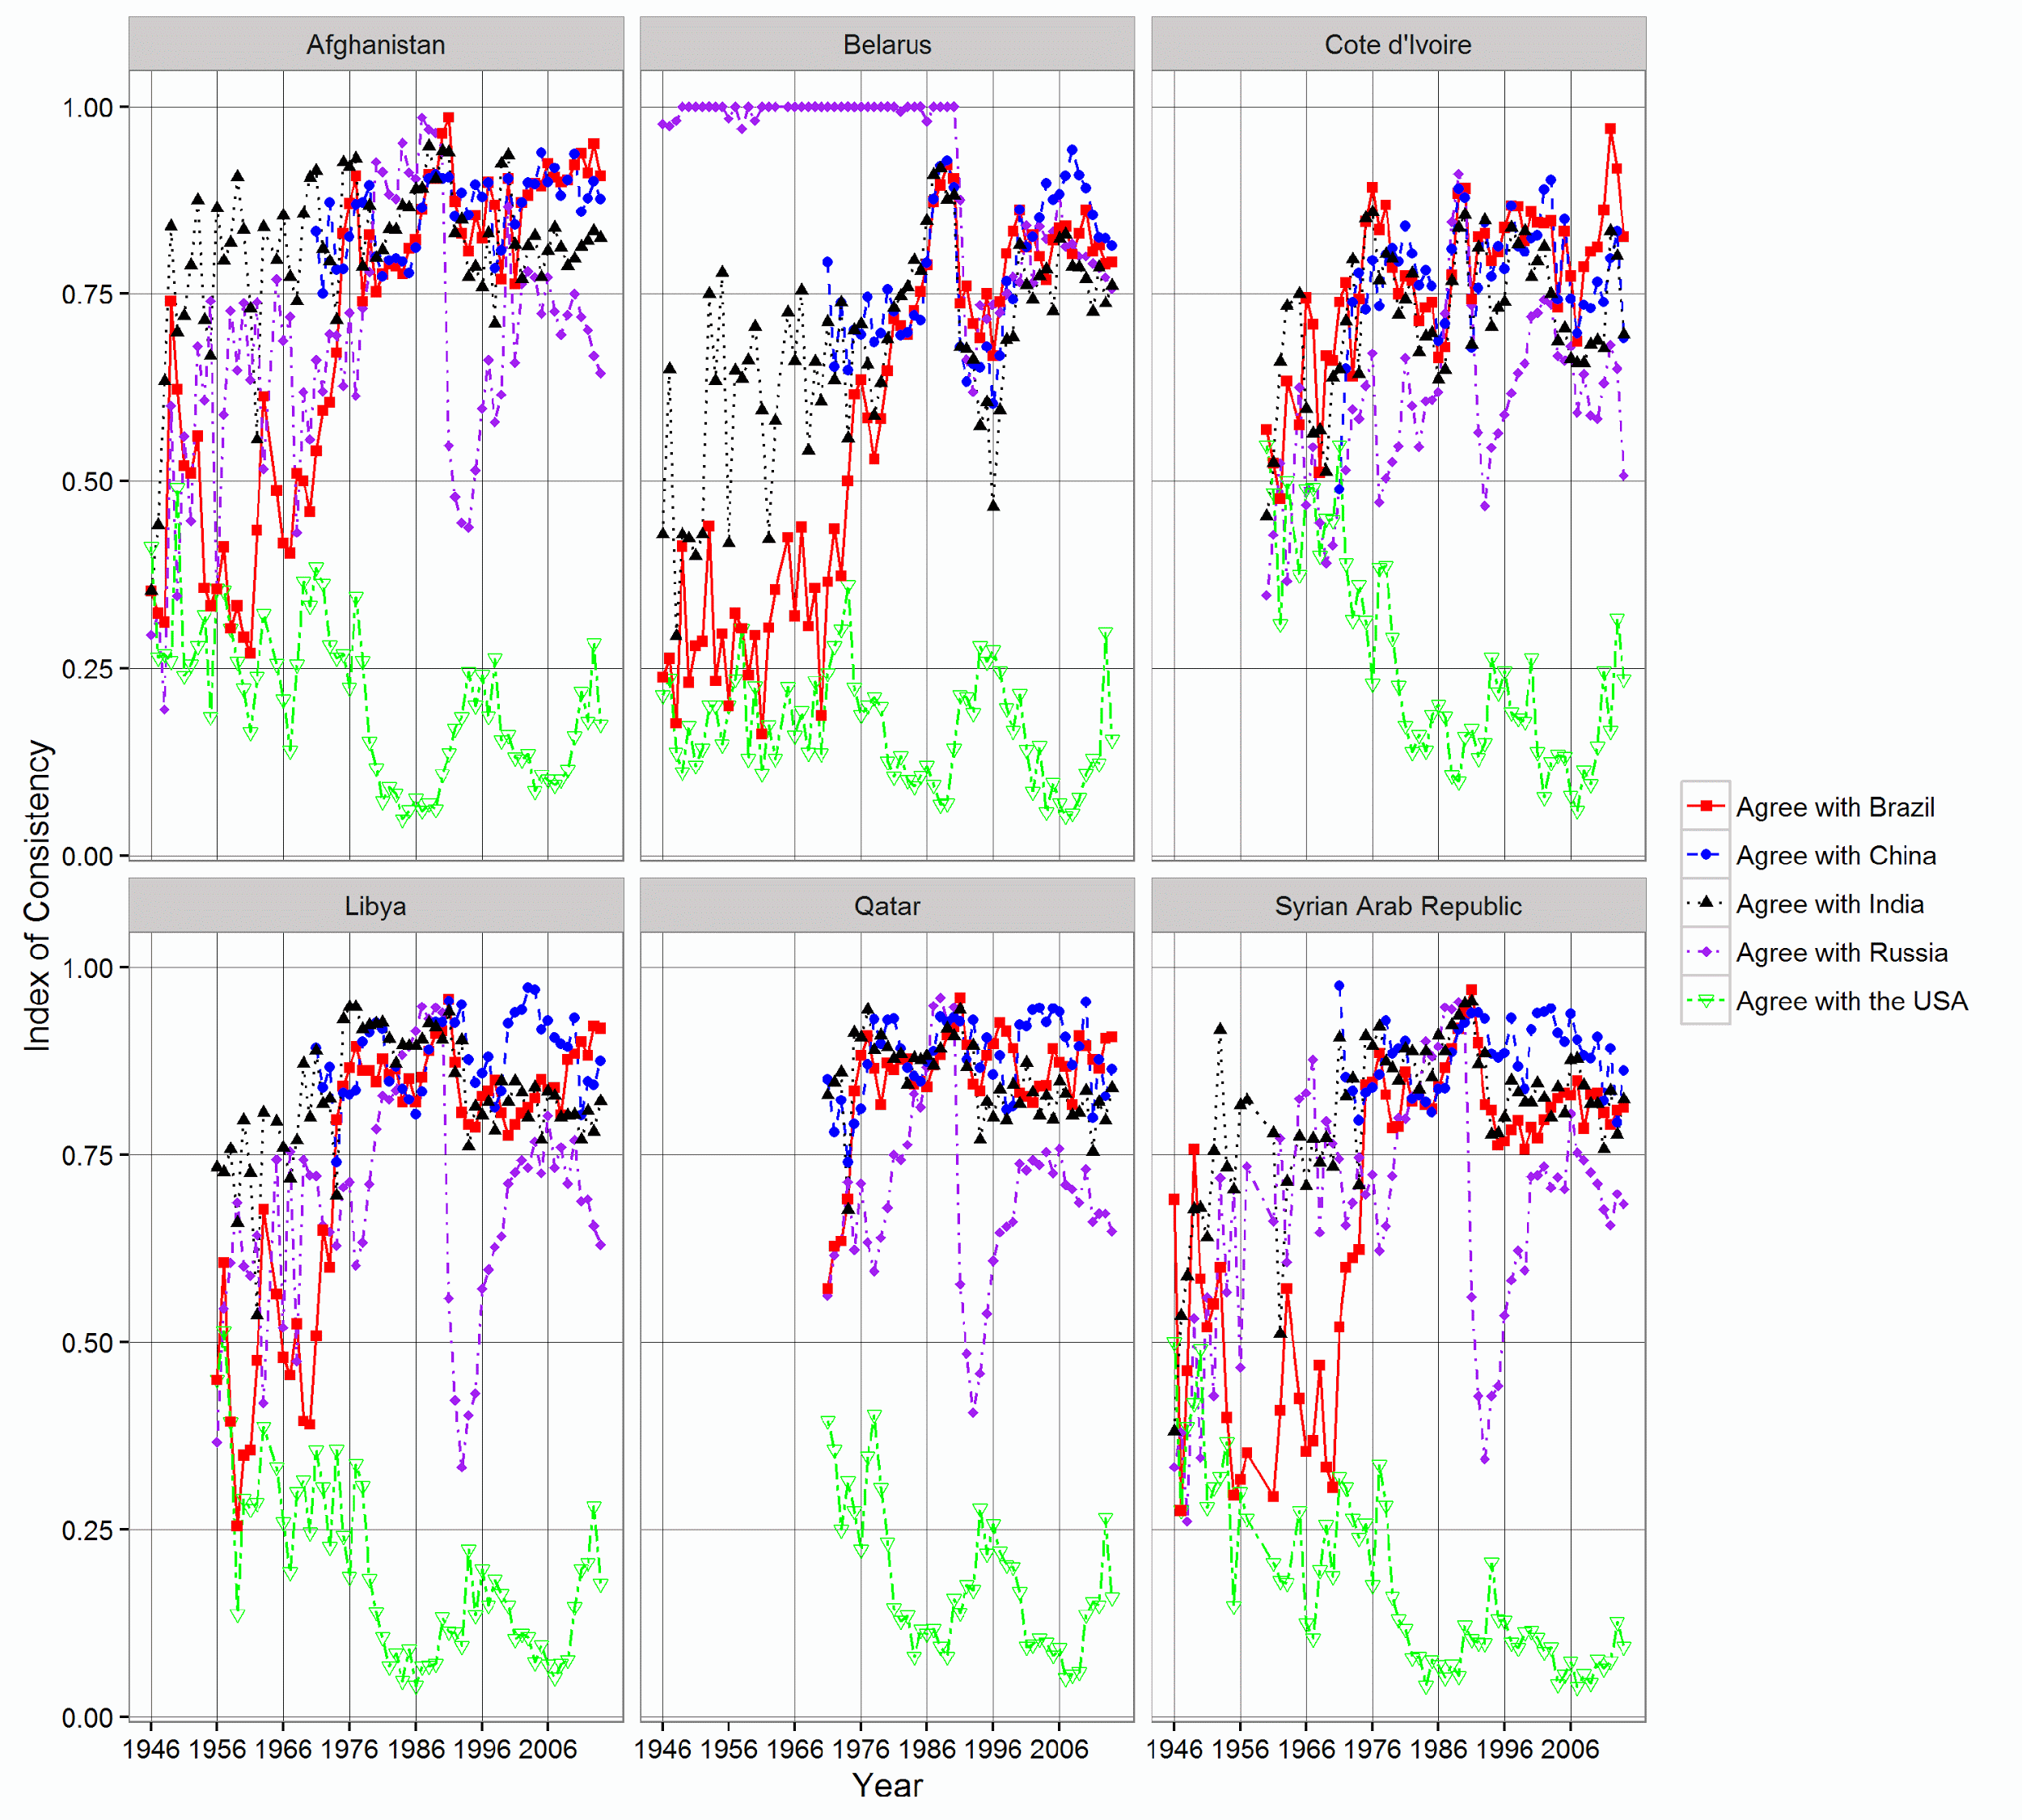
Fig. 10. Consistency criterion dynamics of some countries of the former Third world, 1946–2014
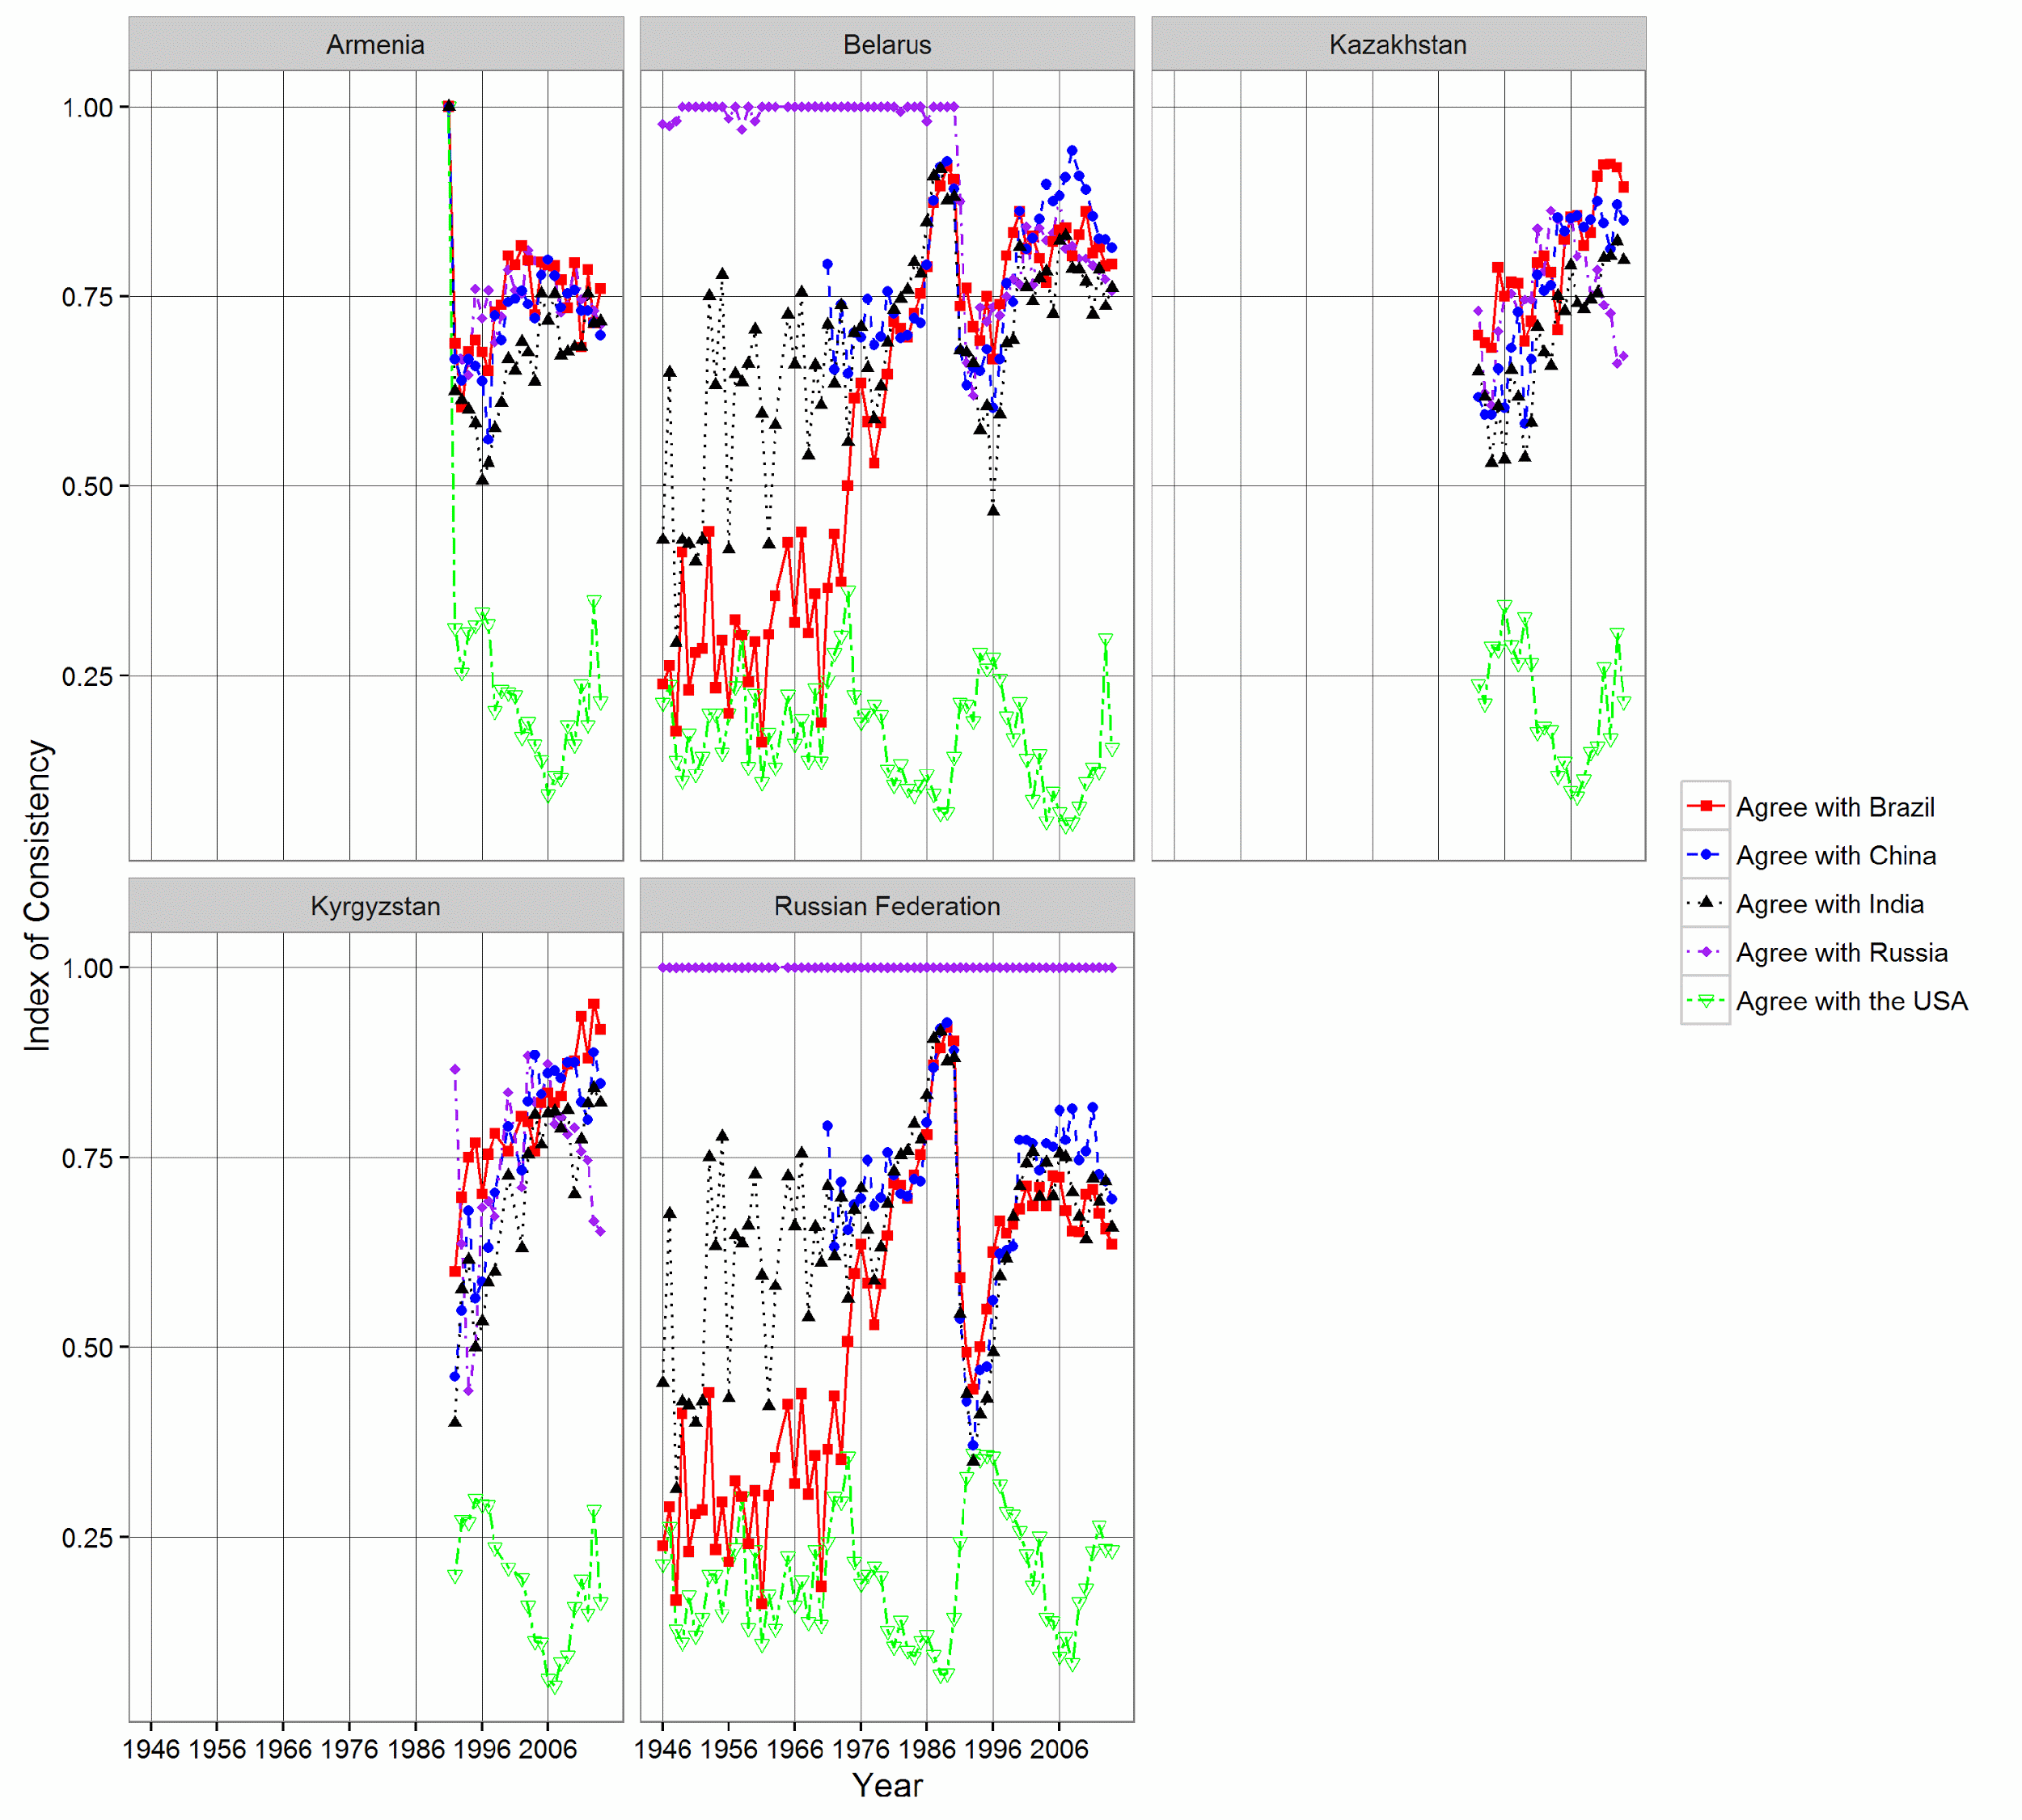
Fig. 11. Consistency criterion dynamics of the countries of the EEU, 1946–2014
Fig. 11 shows the consistency criterion dynamics of the Eurasian Economic Union member states. Since the collapse of the USSR a number of countries have tried to establish new integration unions: free trade zones, economic and political unions similar to the EU. From 2001 to 2014 there had been the Eurasian Economic Community (free-trade zone as a stage of economic integration). Eurasian Customs Union was established in 2010, Eurasian Economic Space was established in 2012 (common market as a stage of economic integration); in 2015, all these unions evolved into one of the final stages of economic, and the Eurasian Economic Union (EAEU) was established.
According to the analysis of the voting in the UN General Assembly, the members of EAEC, stick to similar positions in voting, while the voting of some CIS countries significantly differs (see Fig. 12).
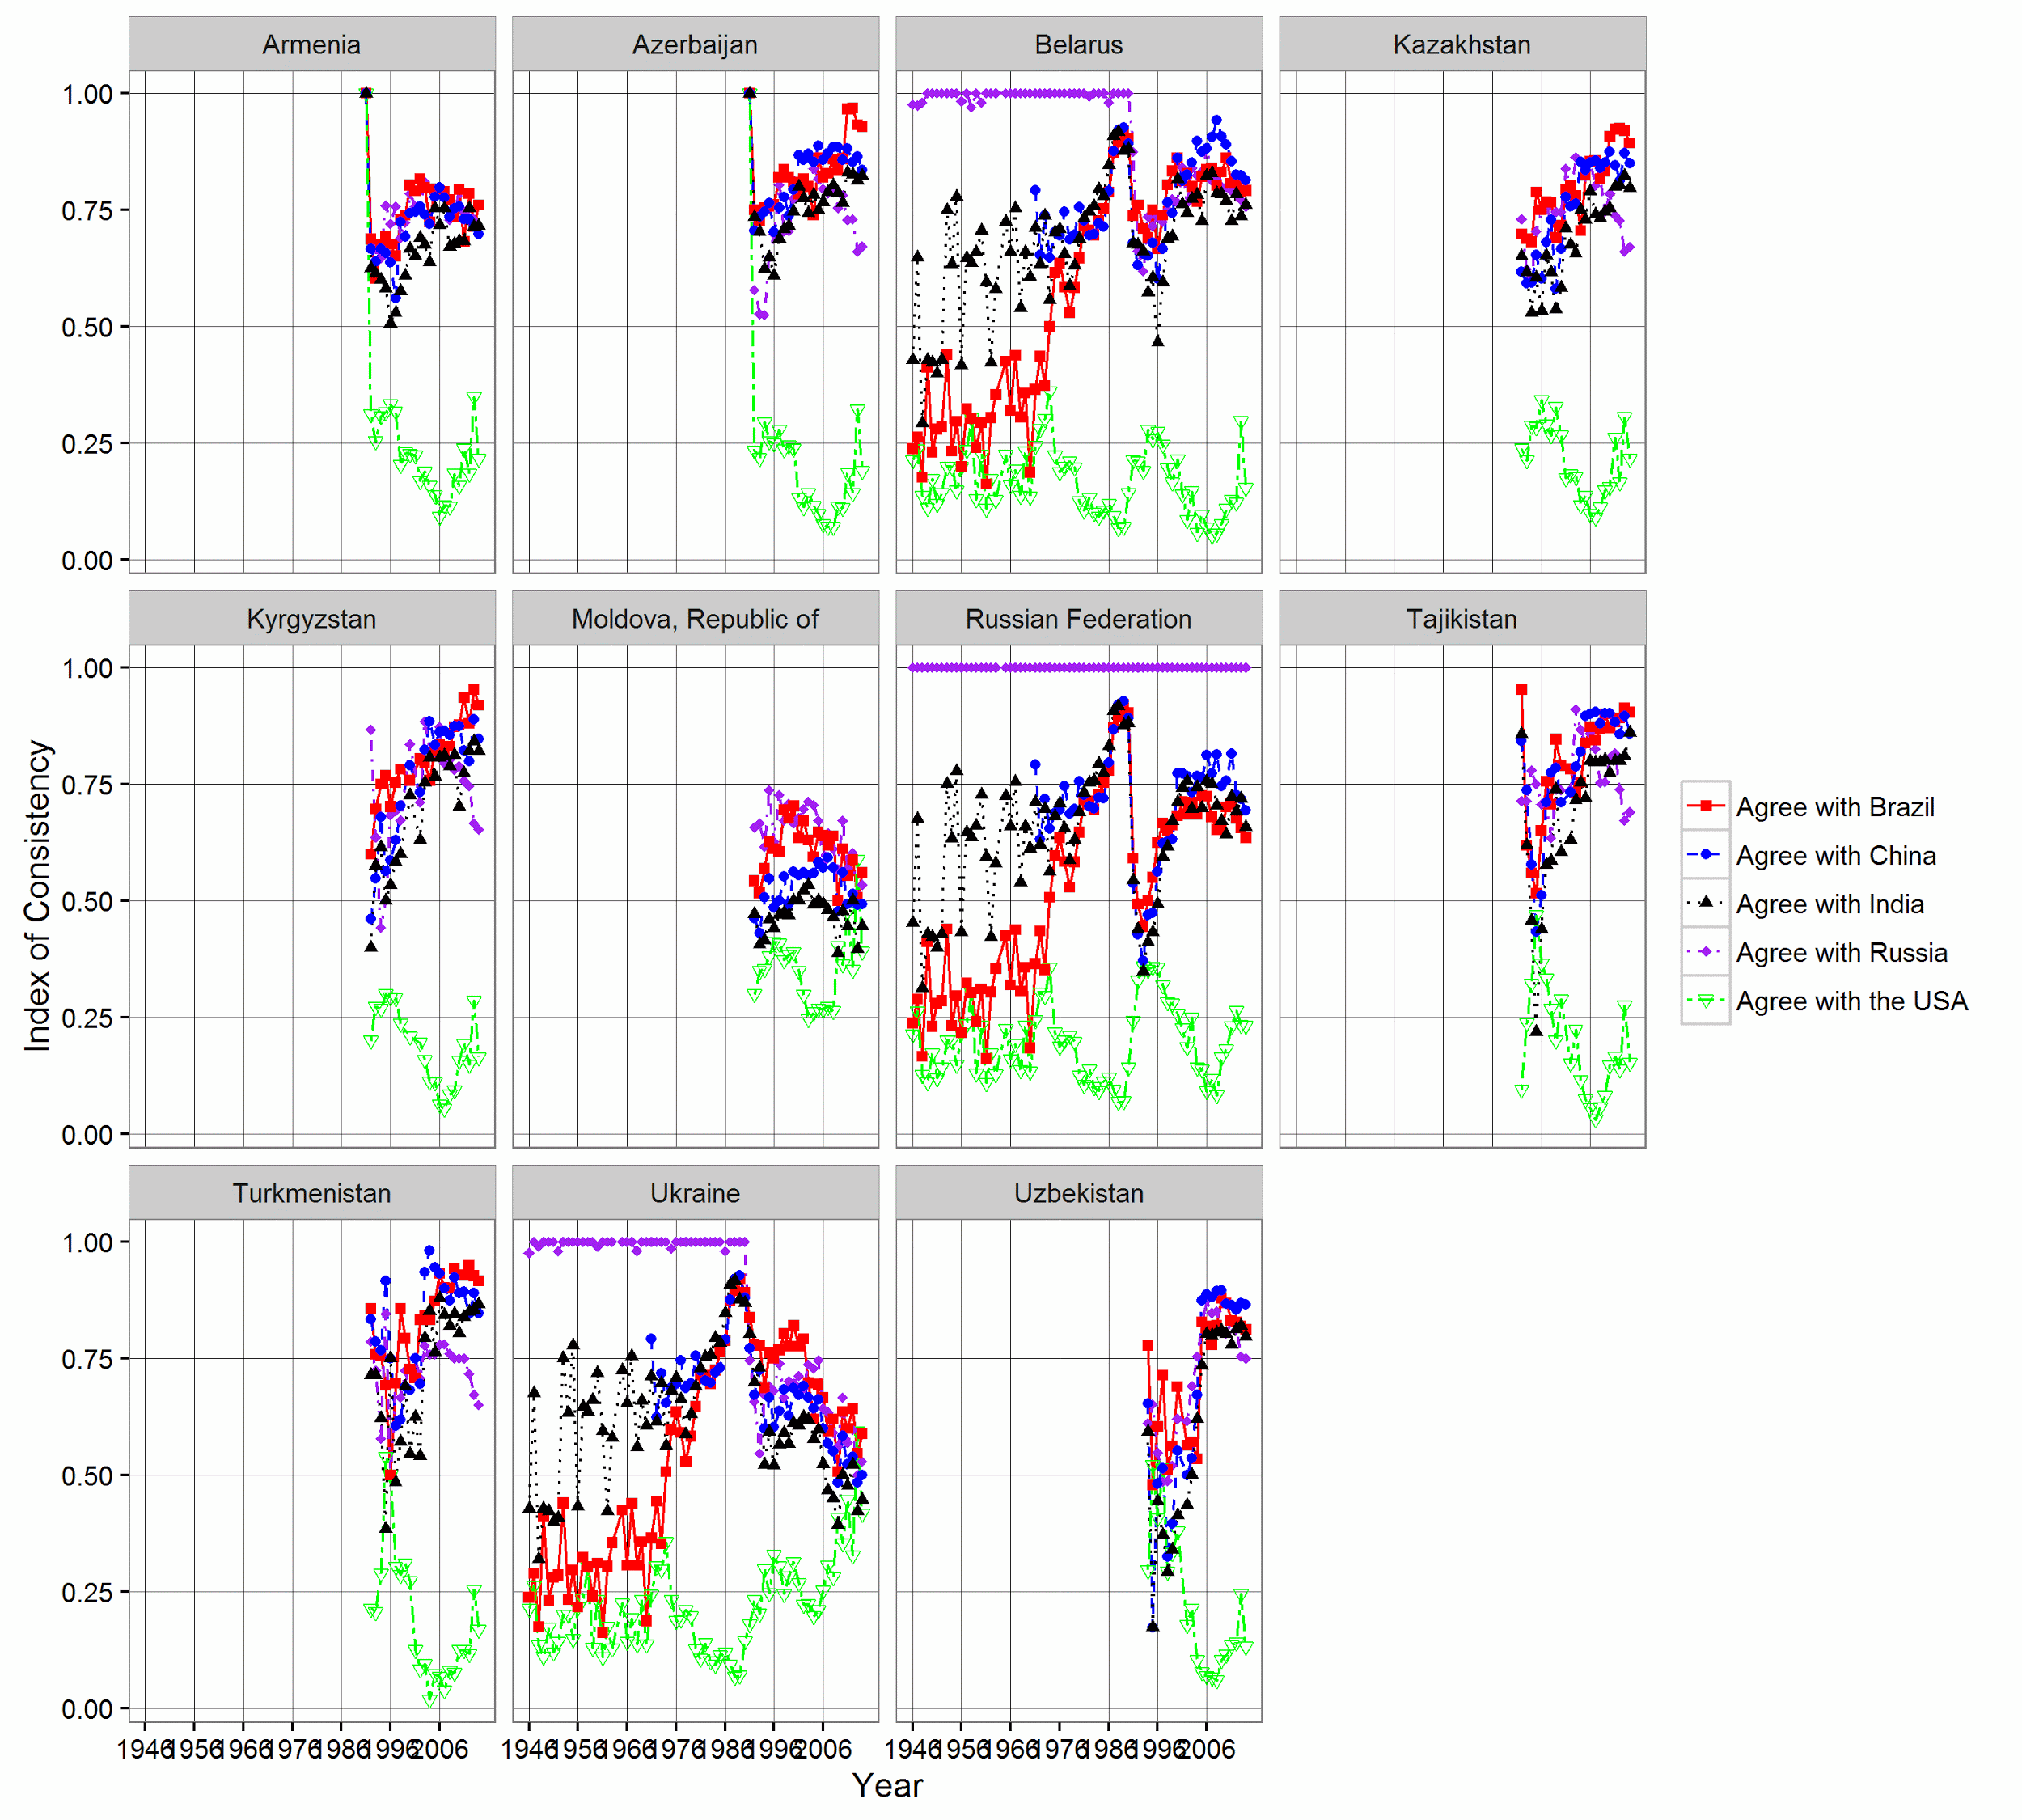
Fig. 12. Consistency criterion dynamics of the CIS members, 1946–2014
The two CIS members Moldova and Ukraine distance themselves from Russia. For more than two and a half decades there have been attempts to find balance between the position of the BRICS nations and that of the United States. Today there is a rising tension between the two CIS members (especially Ukraine) and Russia.
In addition, all the EU member states and the ones who are eager to join the EU have pursued the policy which does not correspond with the policy conducted by the BRICS countries over the last 20 years (see Figs. 13–17).
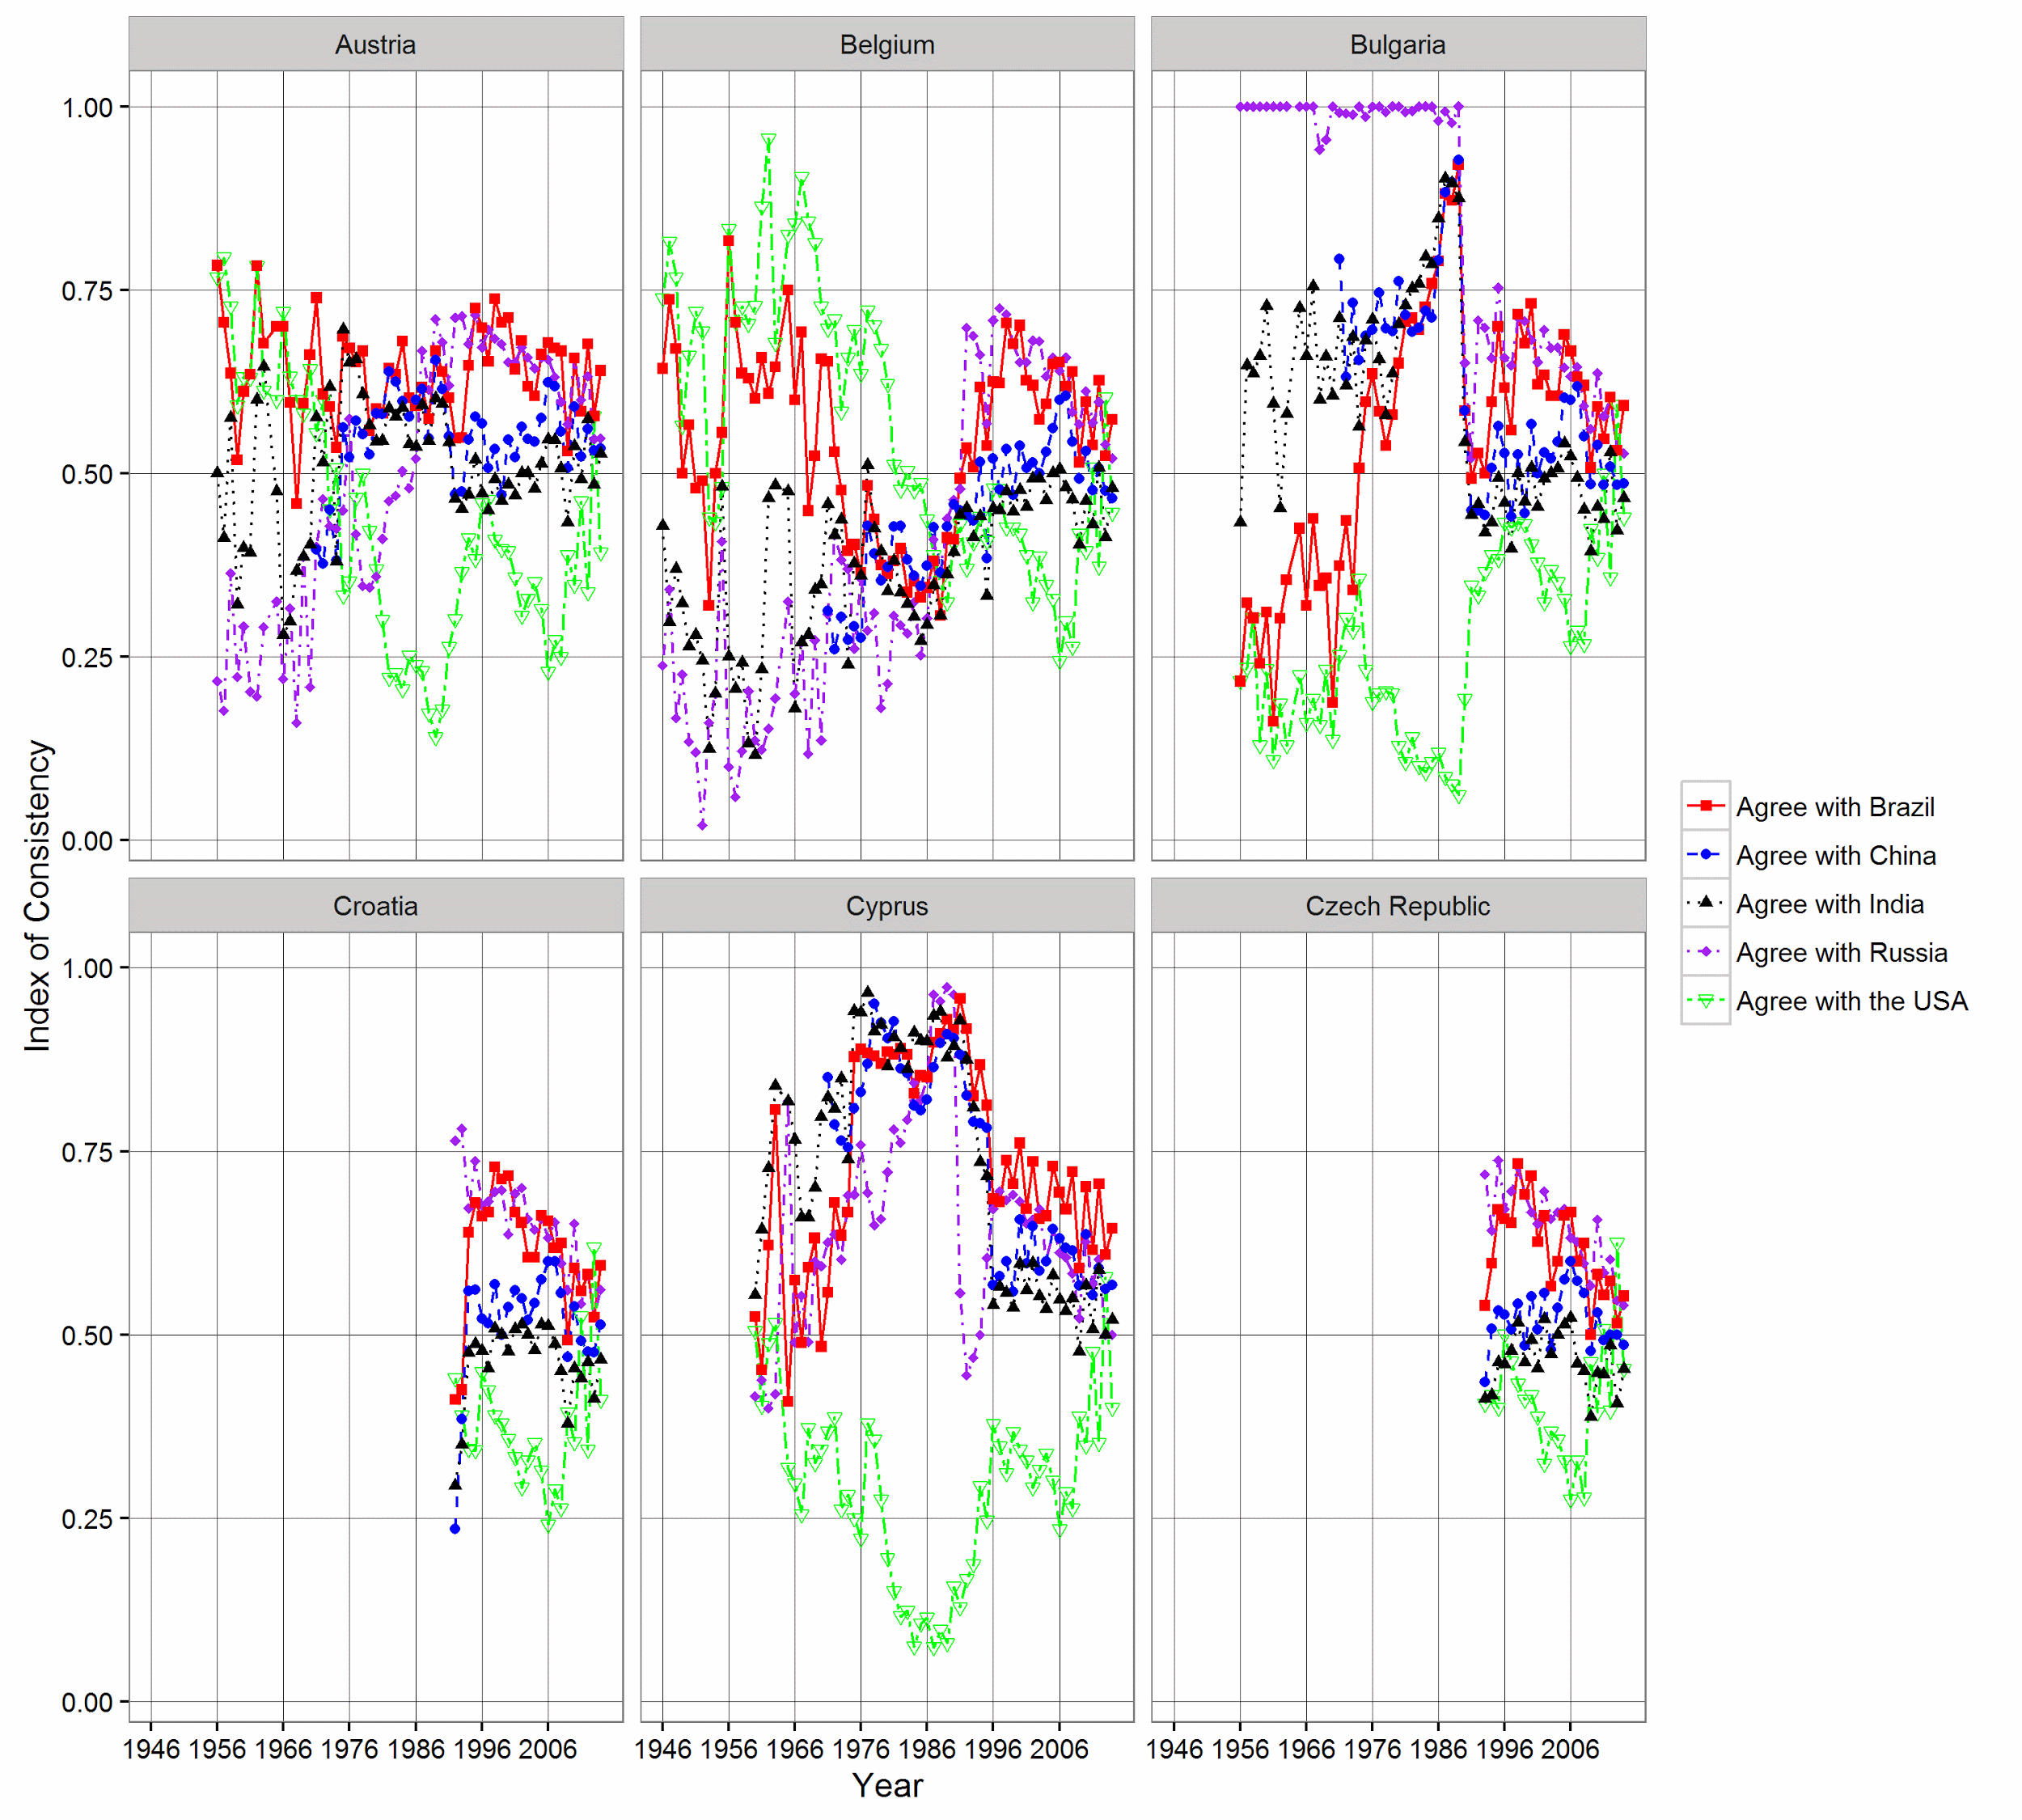
Fig. 13. Consistency criterion dynamics of the EU member states, part 1, 1946–2014
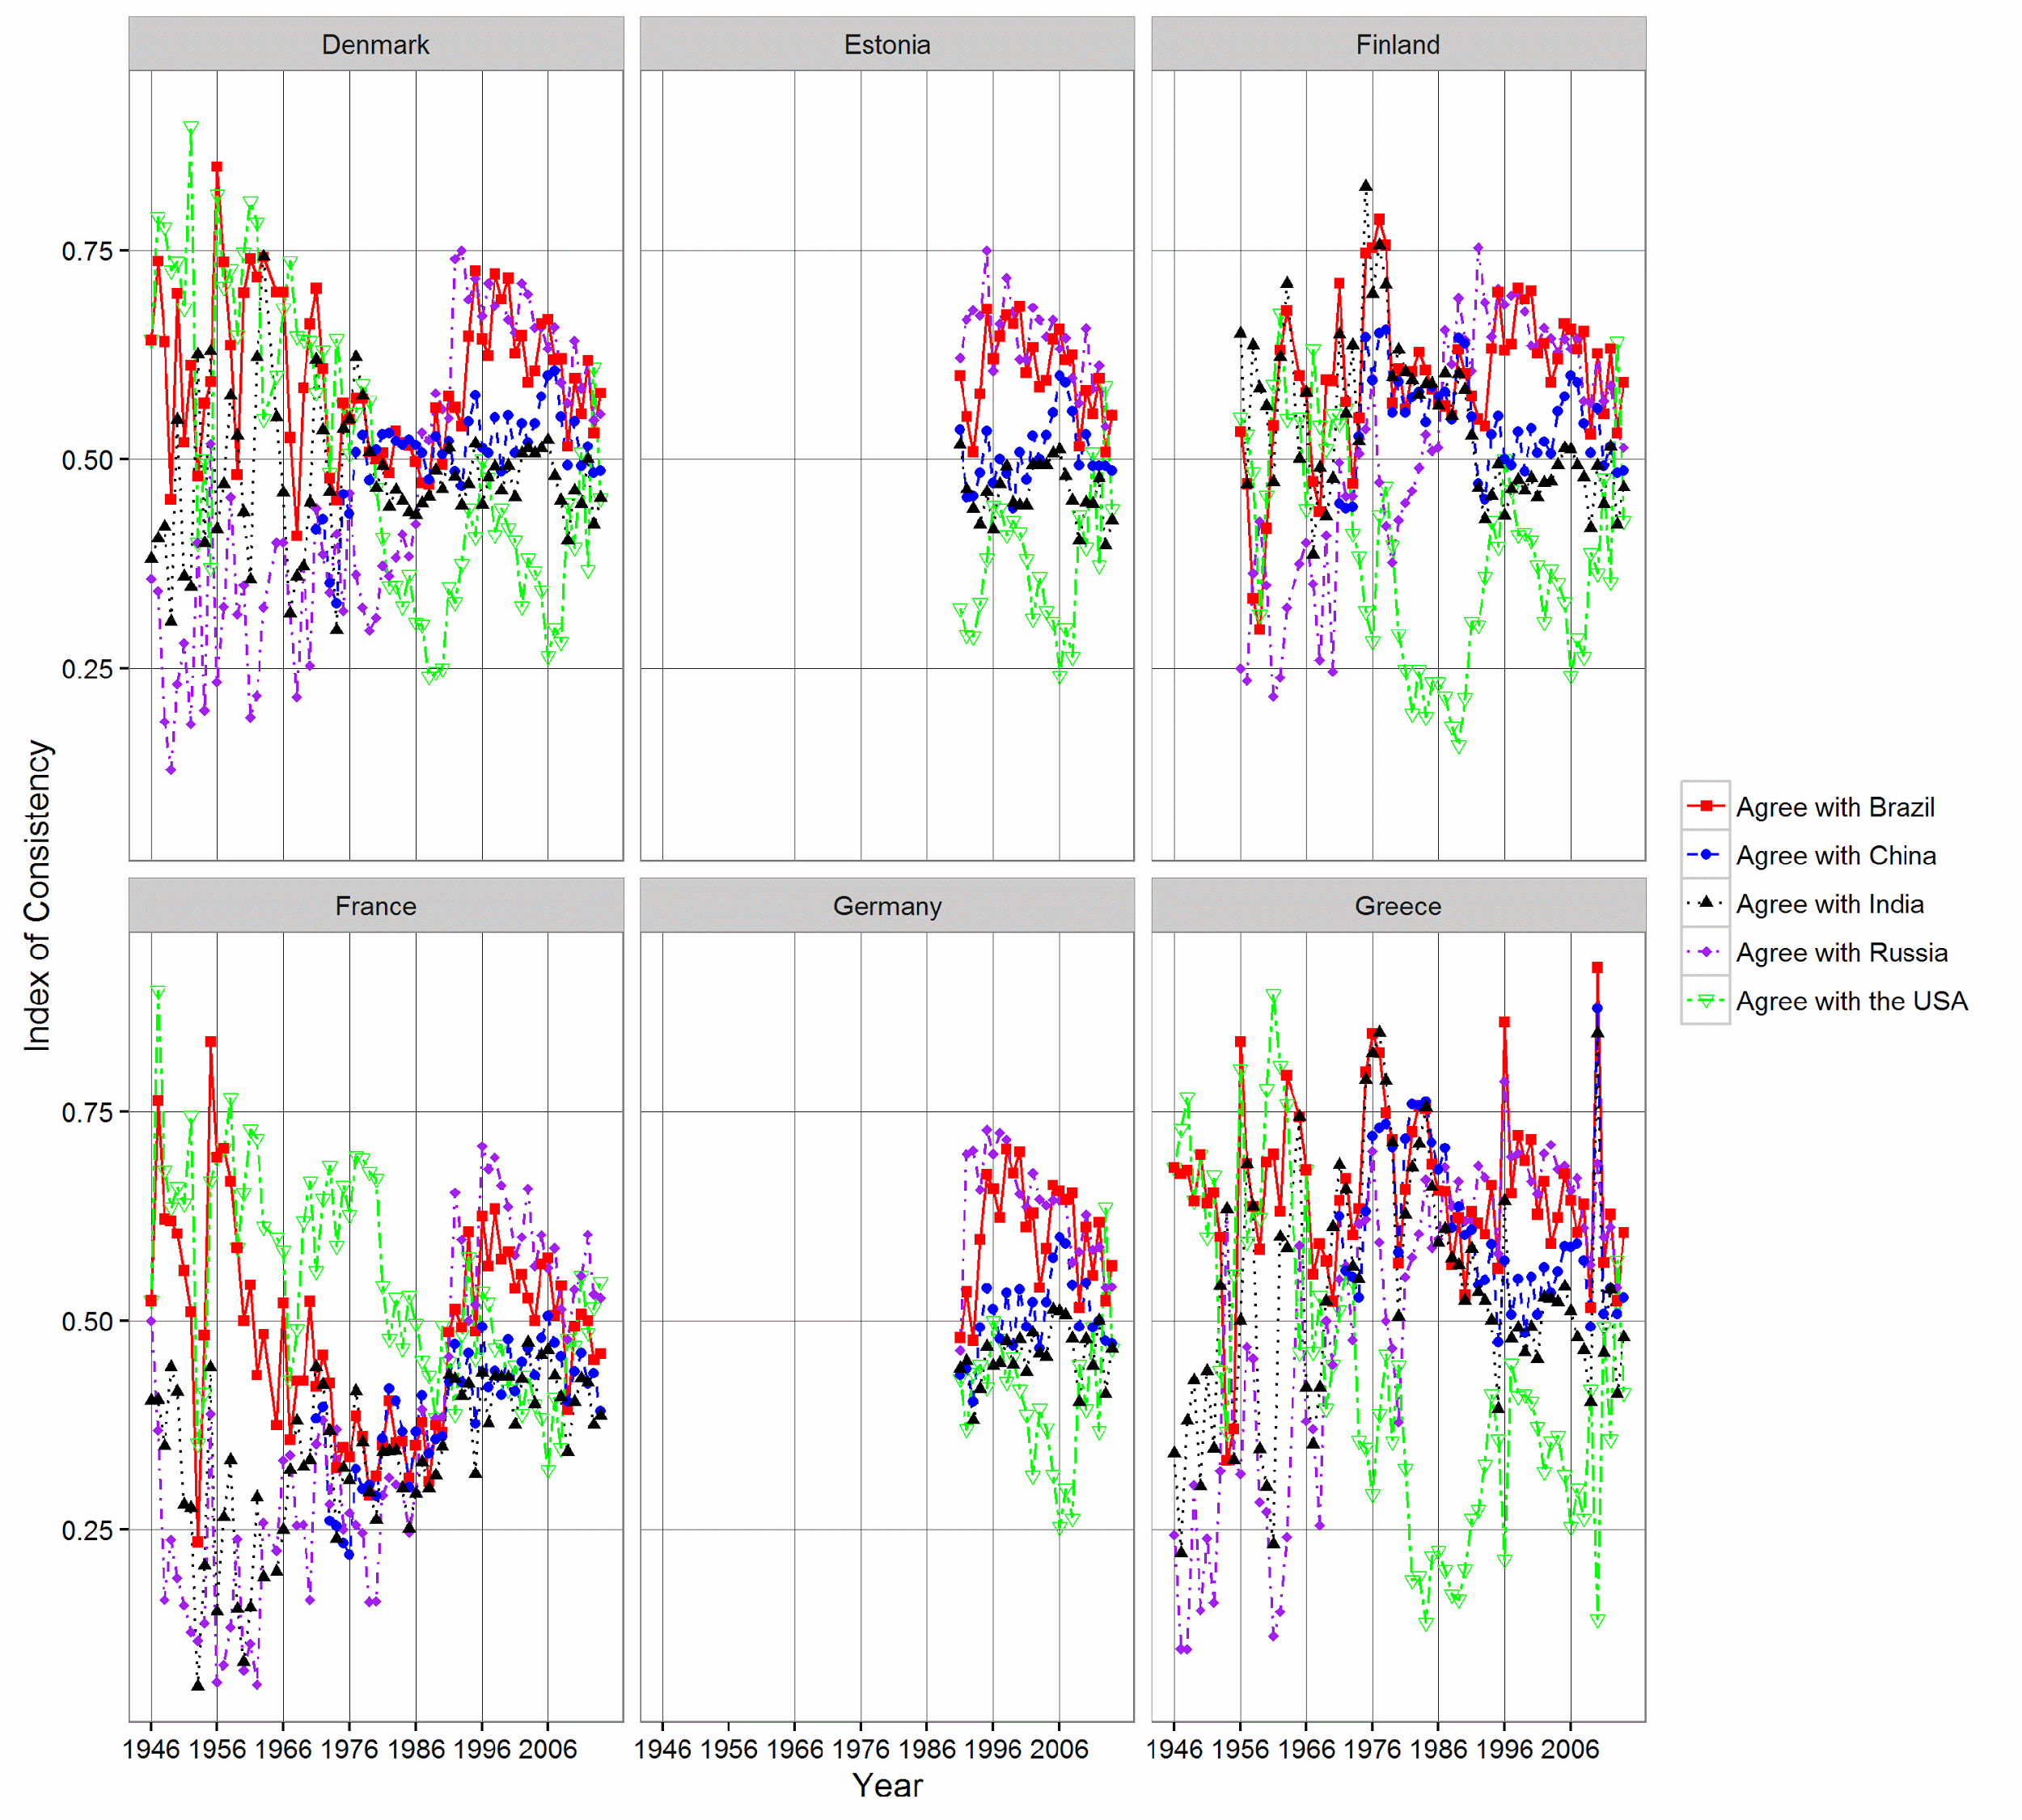
Fig. 14. Consistency criterion dynamics of the EU member states, part 2, 1946–2014
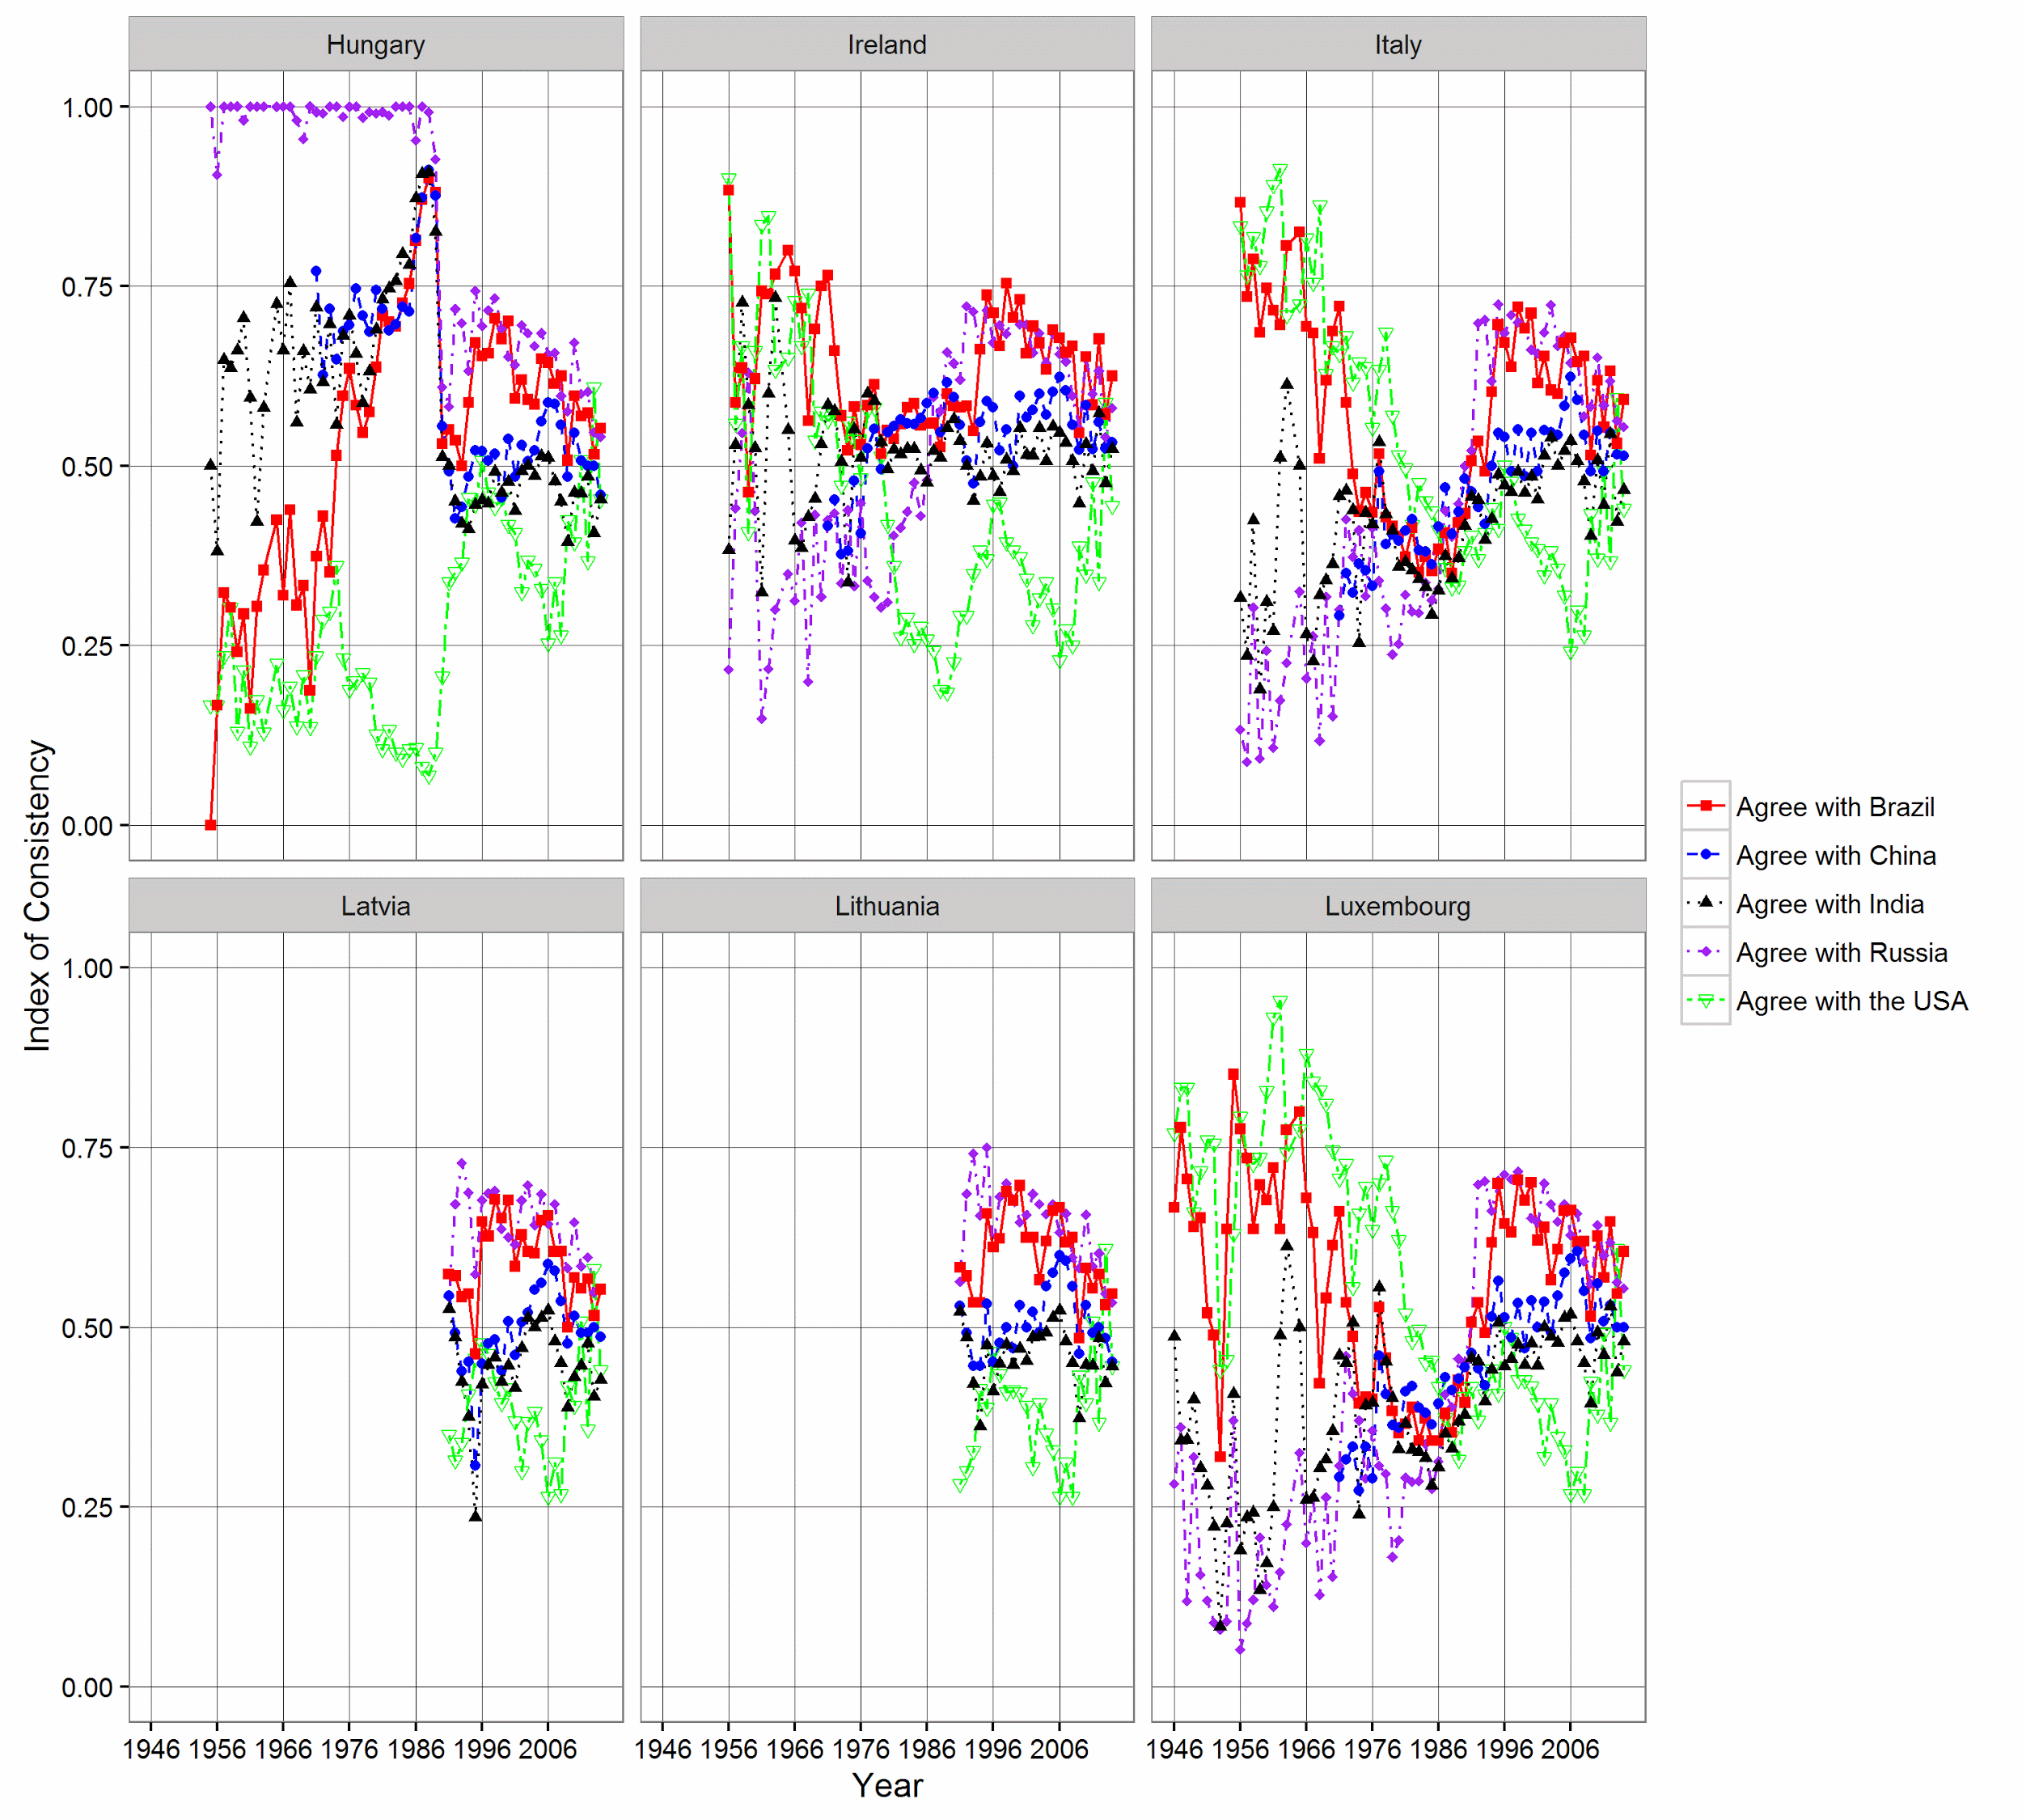
Fig. 15. Consistency criterion dynamics of the EU member states, part 3, 1946–2014
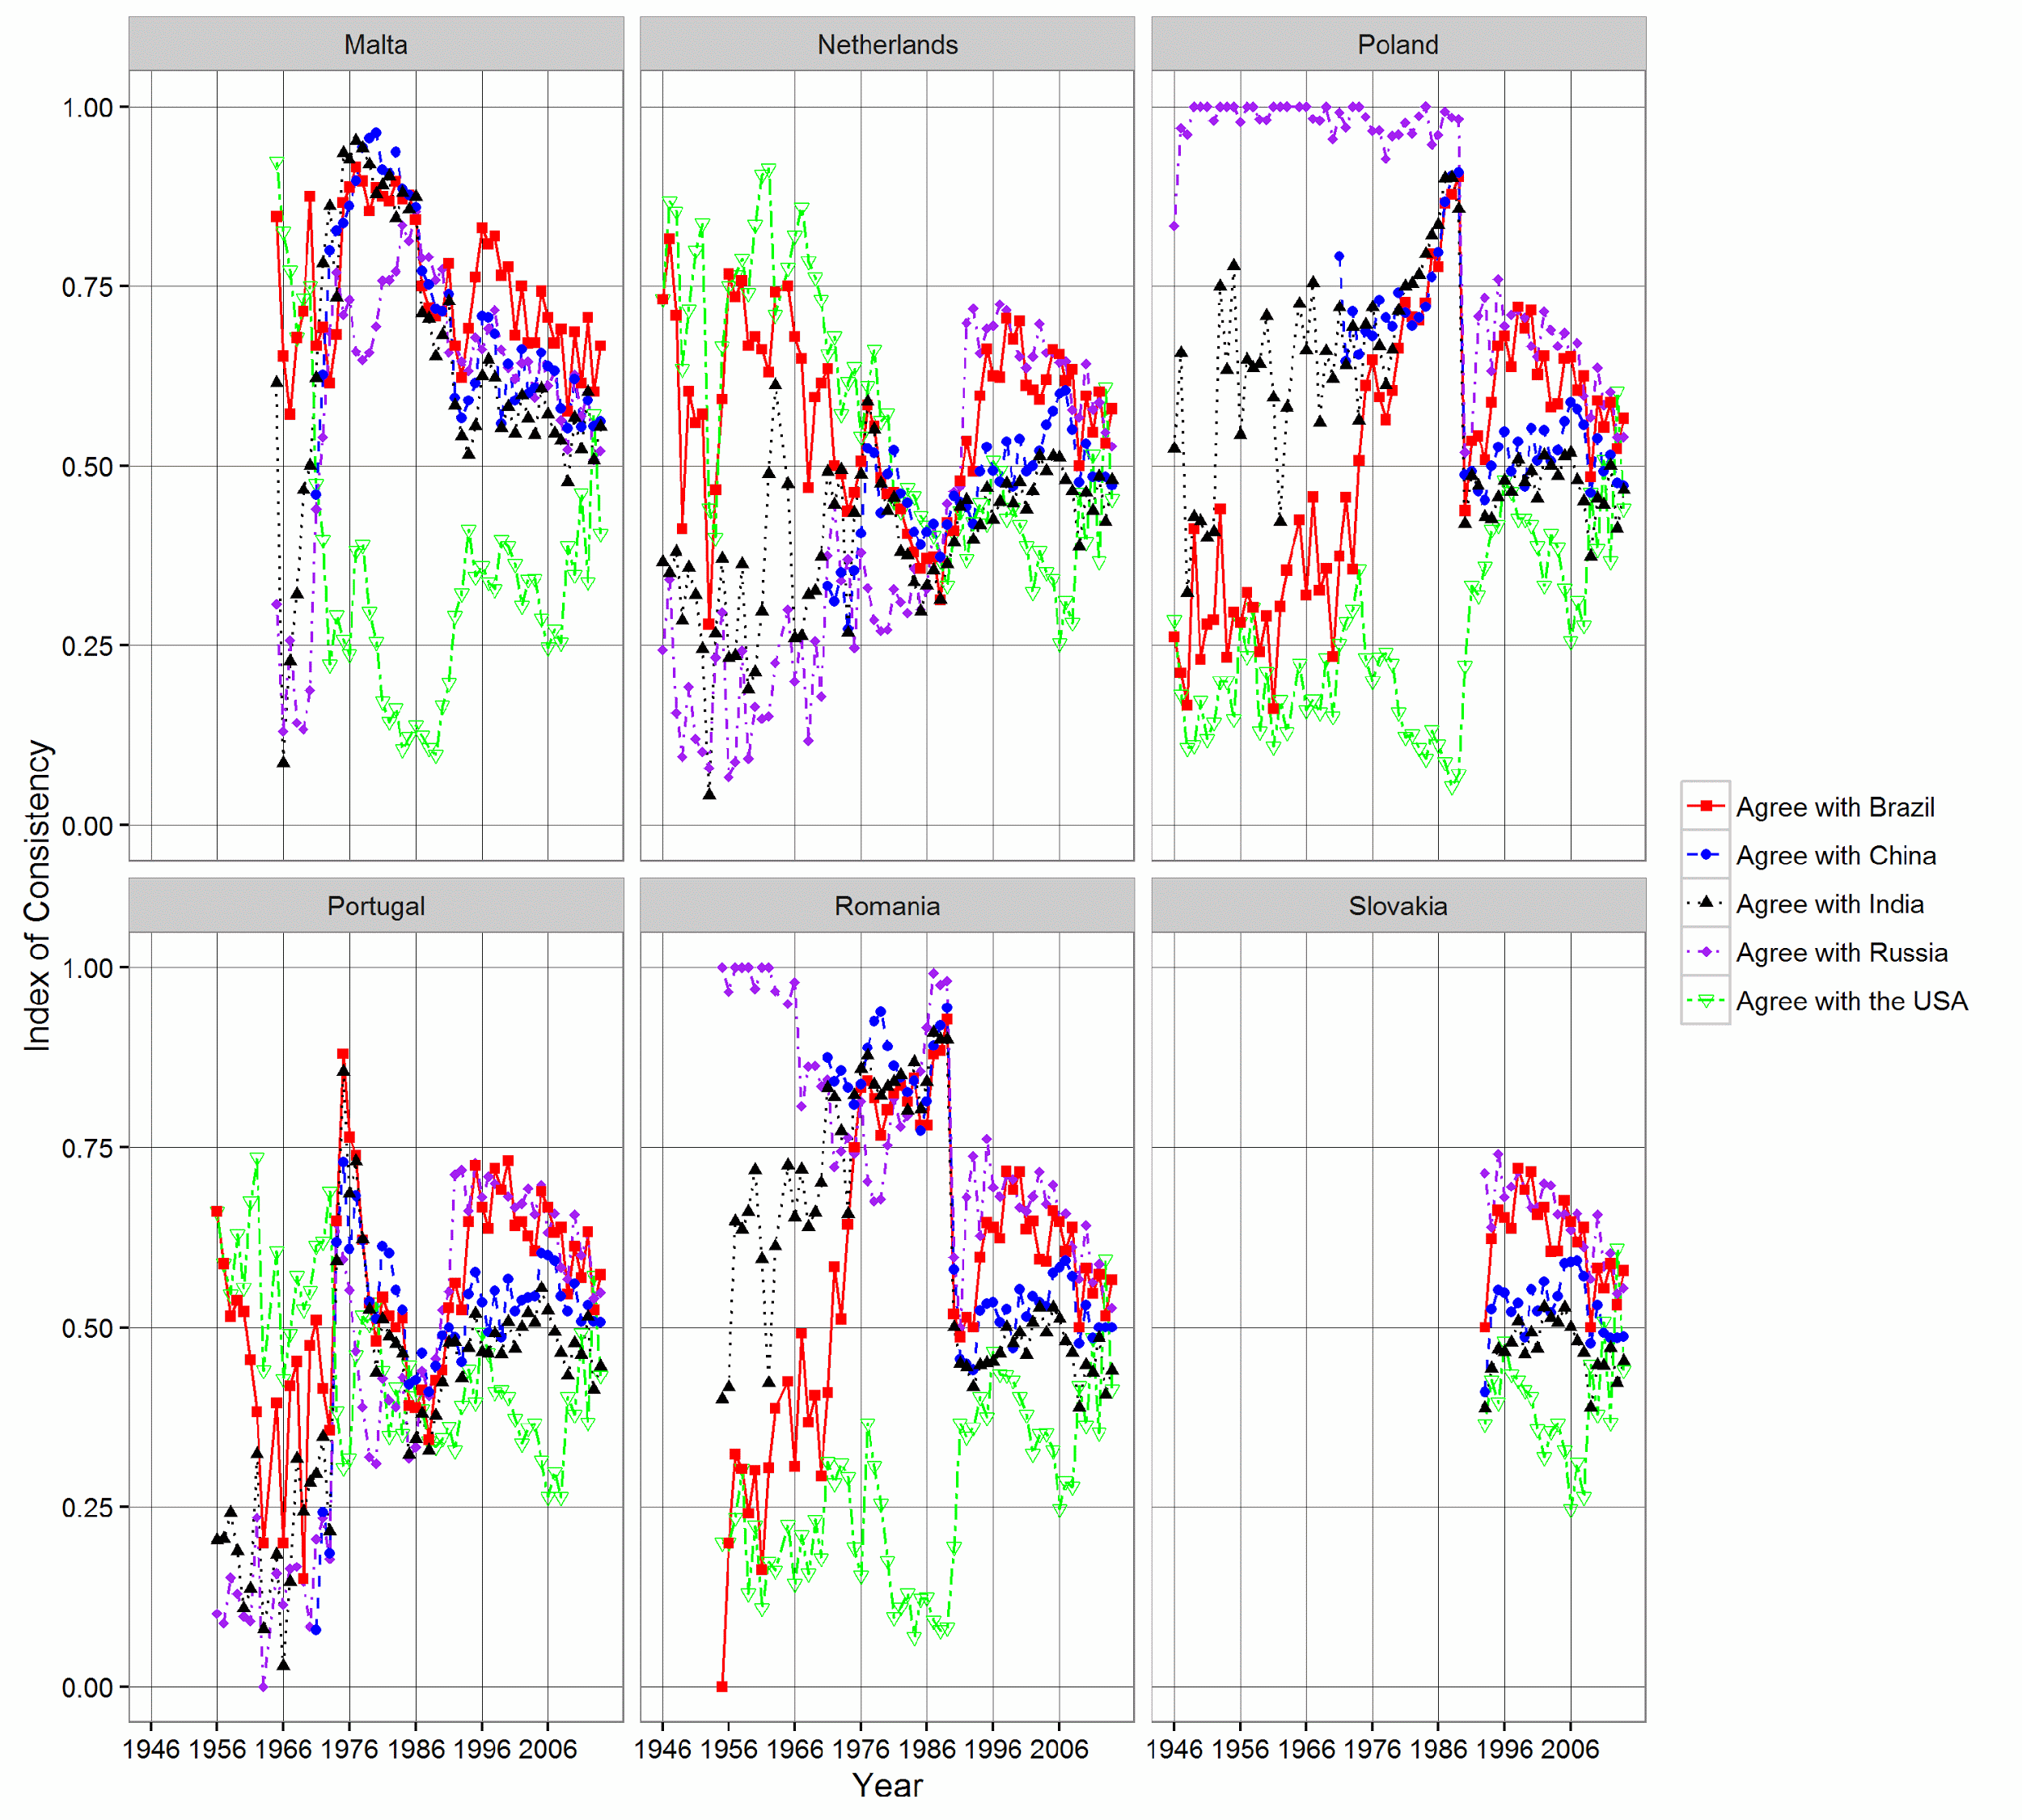
Fig. 16. Consistency criterion dynamics of the EU member states, part 4, 1946–2014
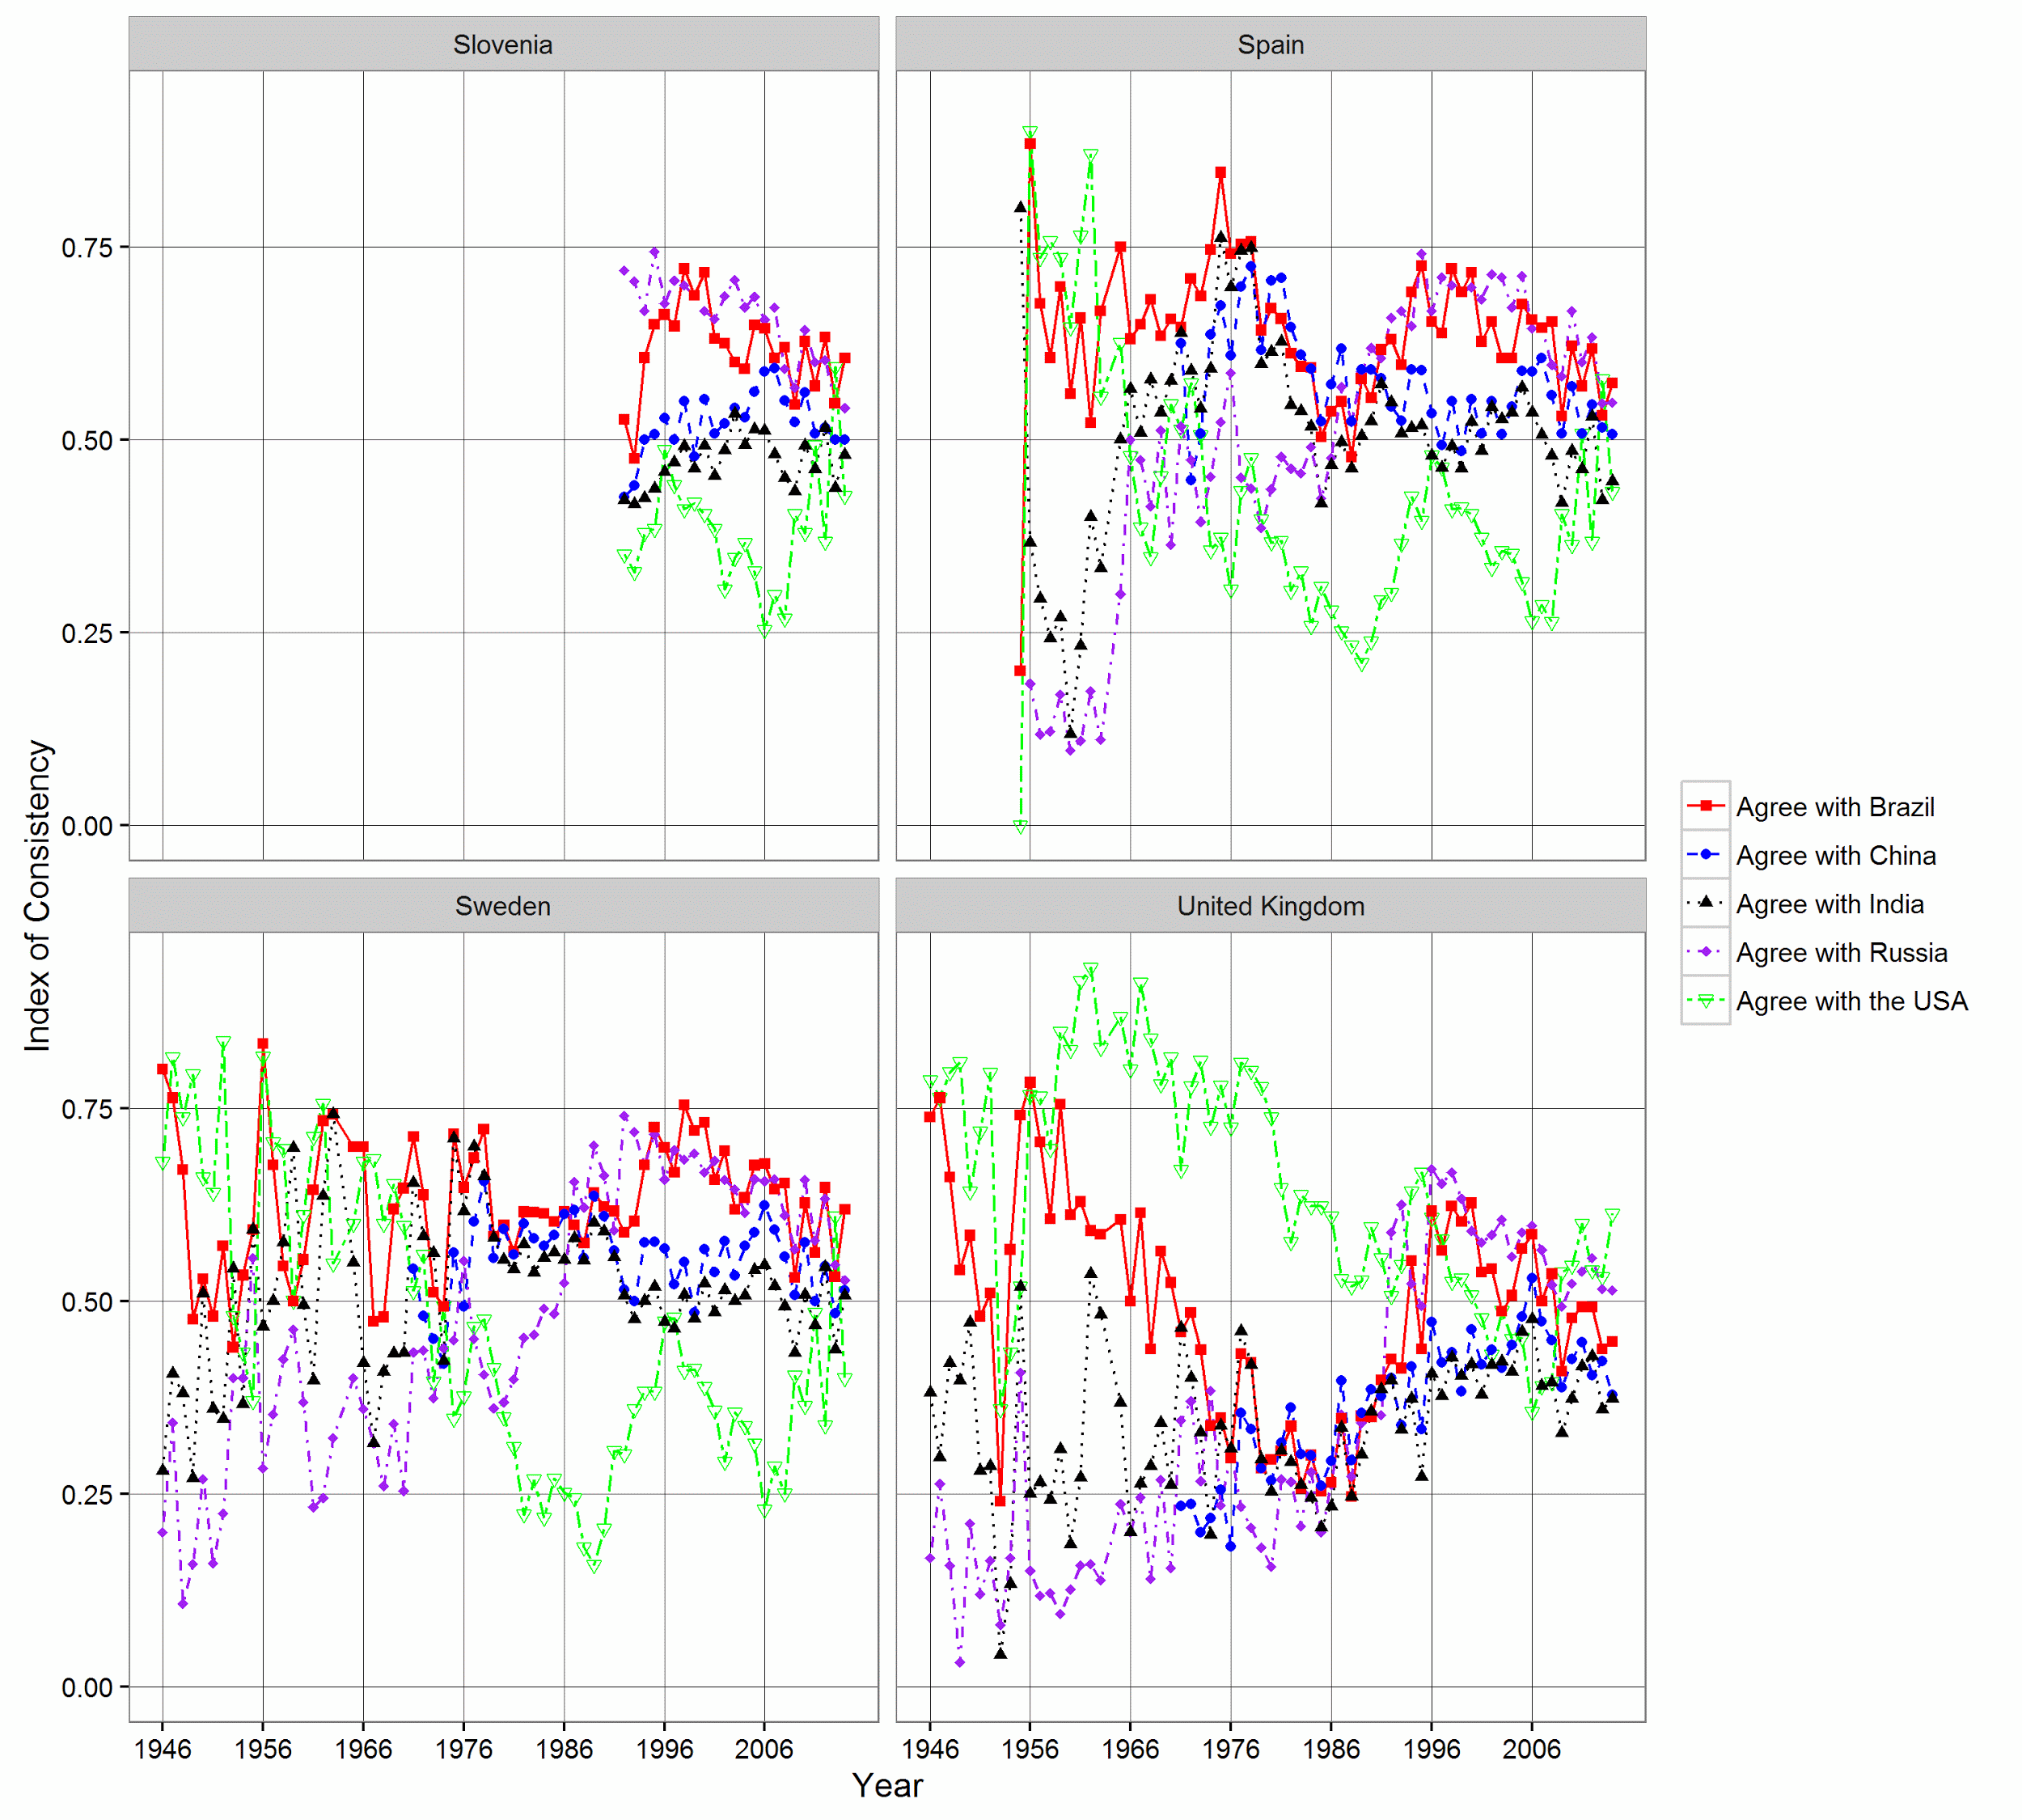
Fig. 17. Consistency criterion dynamics of the EU member states, part 5, 1946–2014
Despite the fact that all the EU members analyzed in the graphs above have almost the same consistency criterion value (regarding consistency with the United States and with the BRICS nations), we can see the following patterns:
-
until the second half of the 1980s many EU member states had a high level of consistency with the US and low level of consistency with the BRICS nations. However, during the next period the situation changed drastically;
-
noteworthy is the fact that in 2008 when Barack Obama became the President, the USA started gaining its lost control. The reasons for the latter are, firstly, economic difficulties encountered by the BRICS nations due to the global financial crisis, and secondly, deterioration of Russian political image after the Russo-Georgian War;
-
the UK is an outlier in the EU to some extent. Its consistency criterion regarding the consistency with the United States is significantly higher than that with the BRICS nations.
Below one might find the data related to the analysis of synchronization between the NAFTA member states (see Fig. 18).
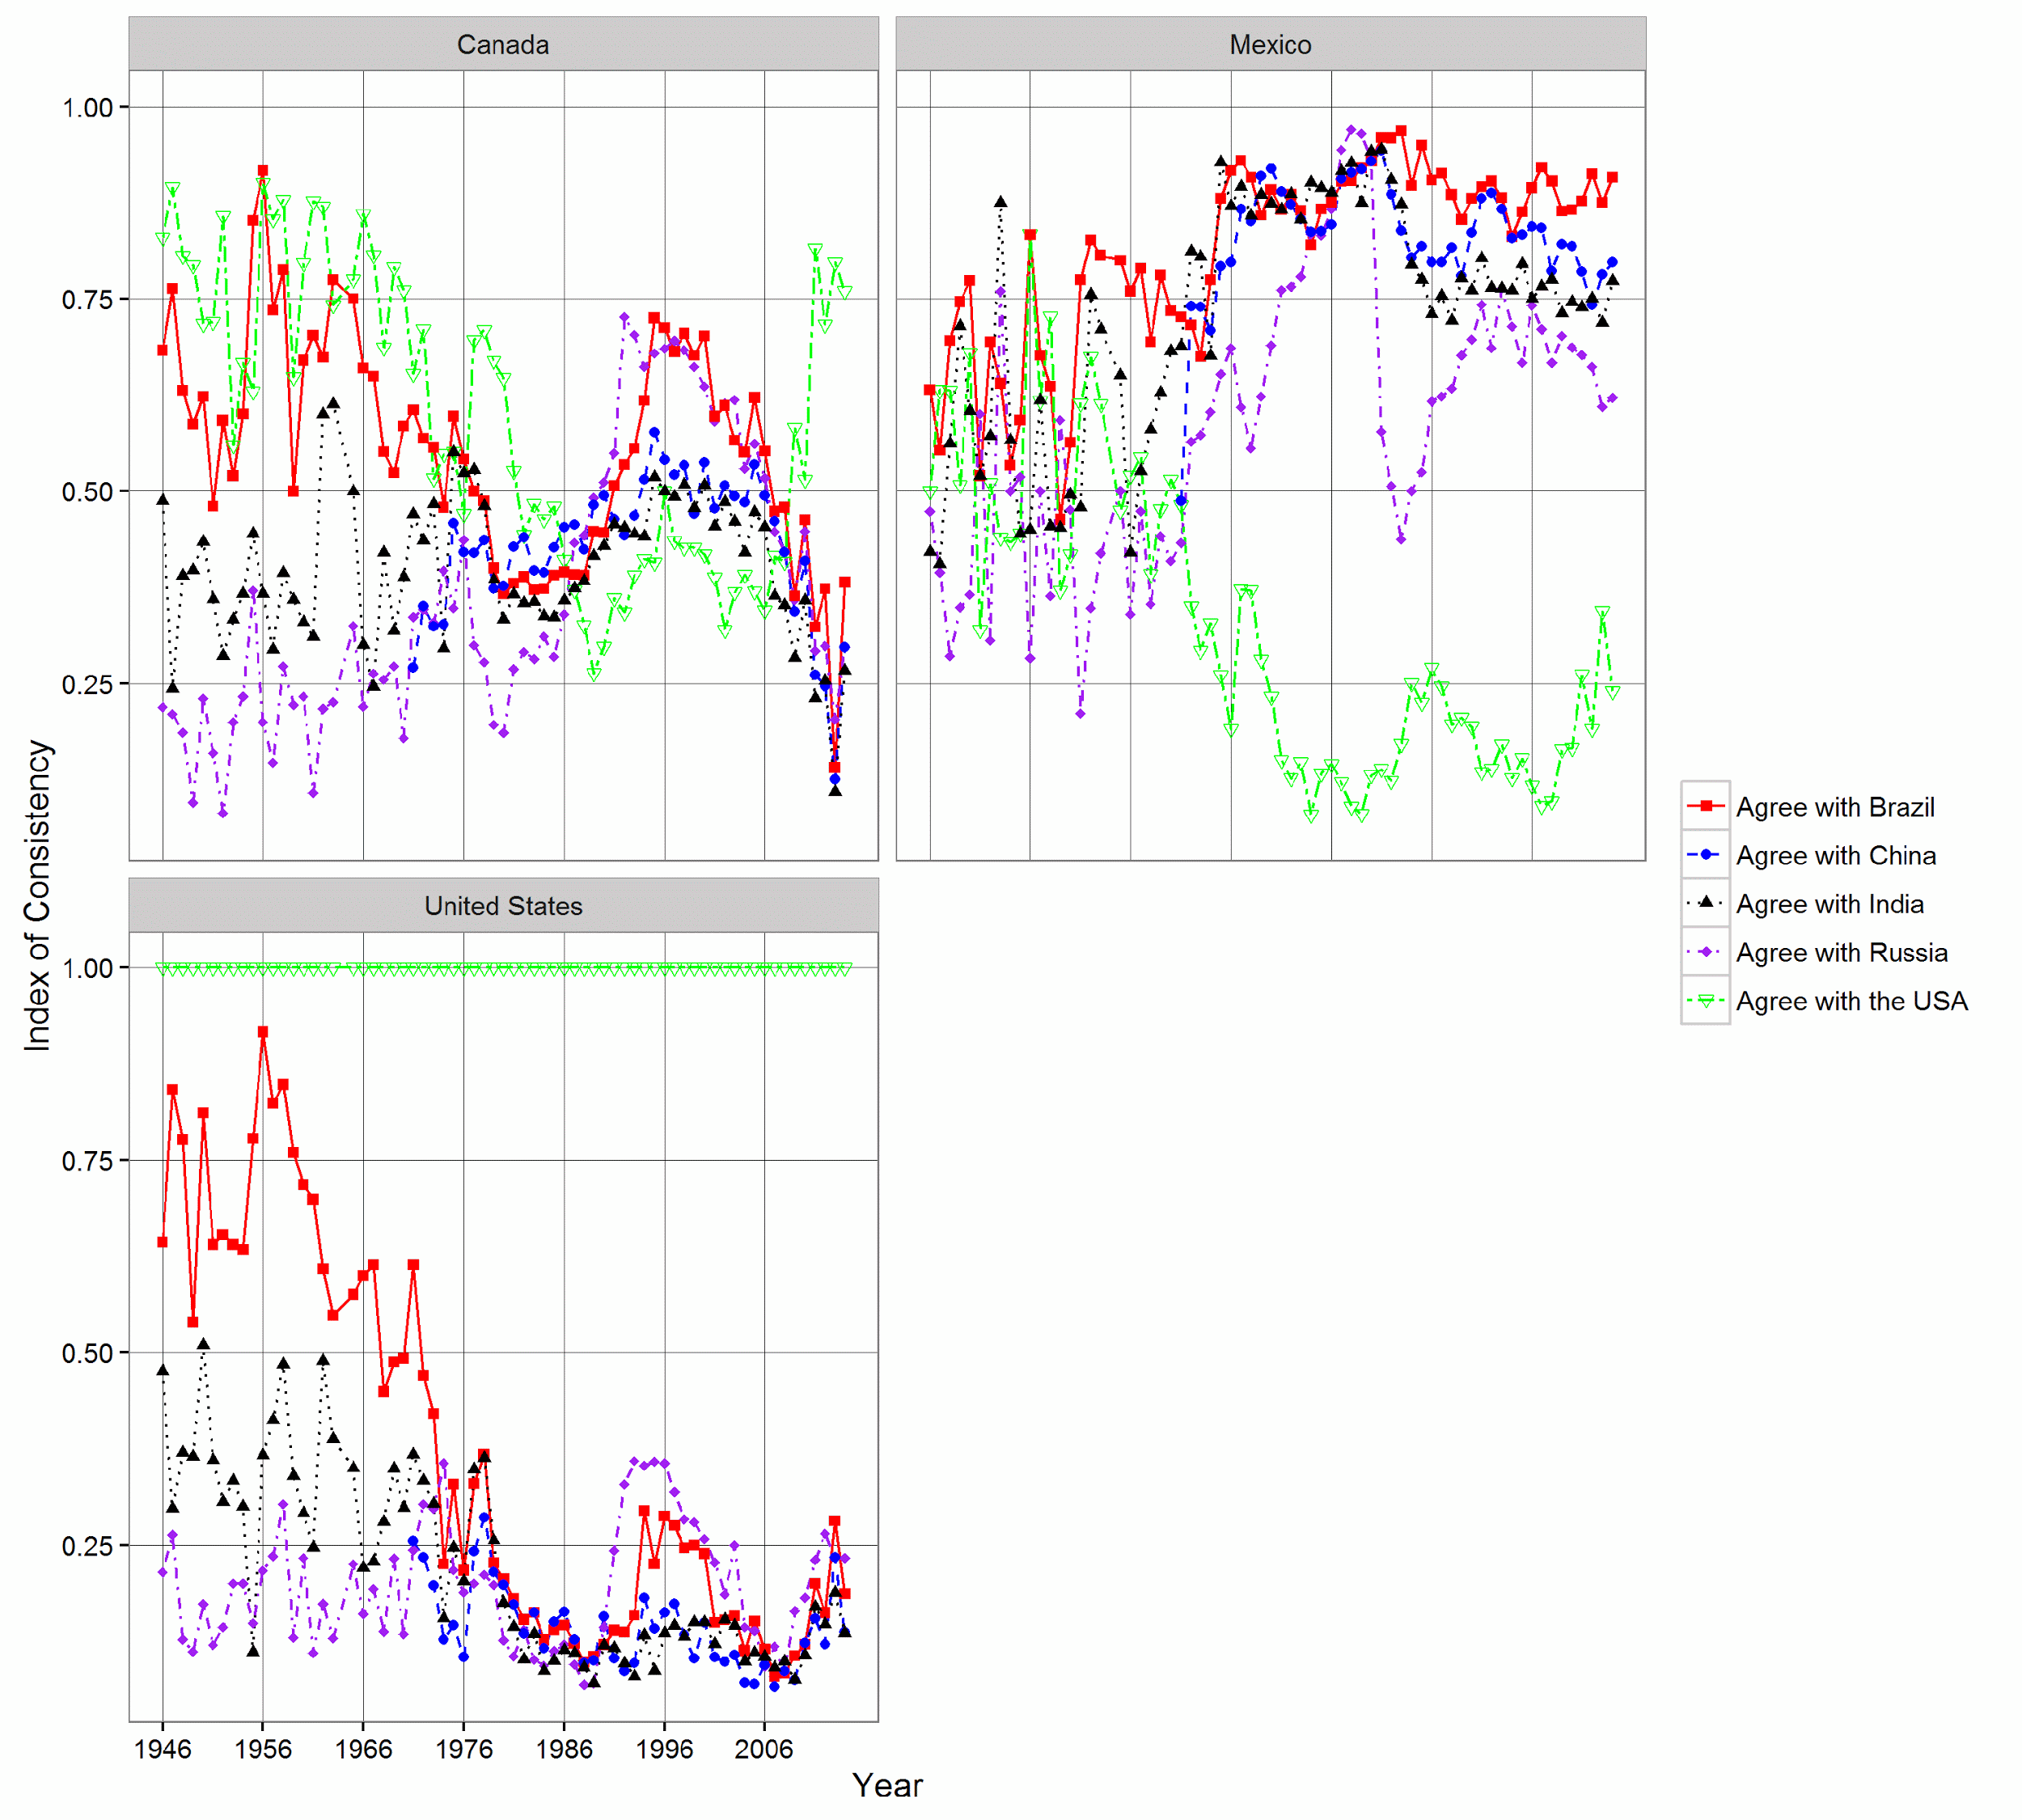
Fig. 18. Consistency criterion dynamics of NAFTA member states, 1946–2014
It is necessary to state that the North American Free Trade Zone, established in 1994, is an area of mutual interest for its member states. Thus, the member states are to demonstrate a high level of consistency while voting in the UN General Assembly. However, Canada and Mexico vote differently in the GA. Canada is a pro-American country and its voting aligns with that of the US, while Mexico's voting corresponds more with that of the BRICS nations.
Fig. 19 shows the consistency criterion of MERCOSUR member states.
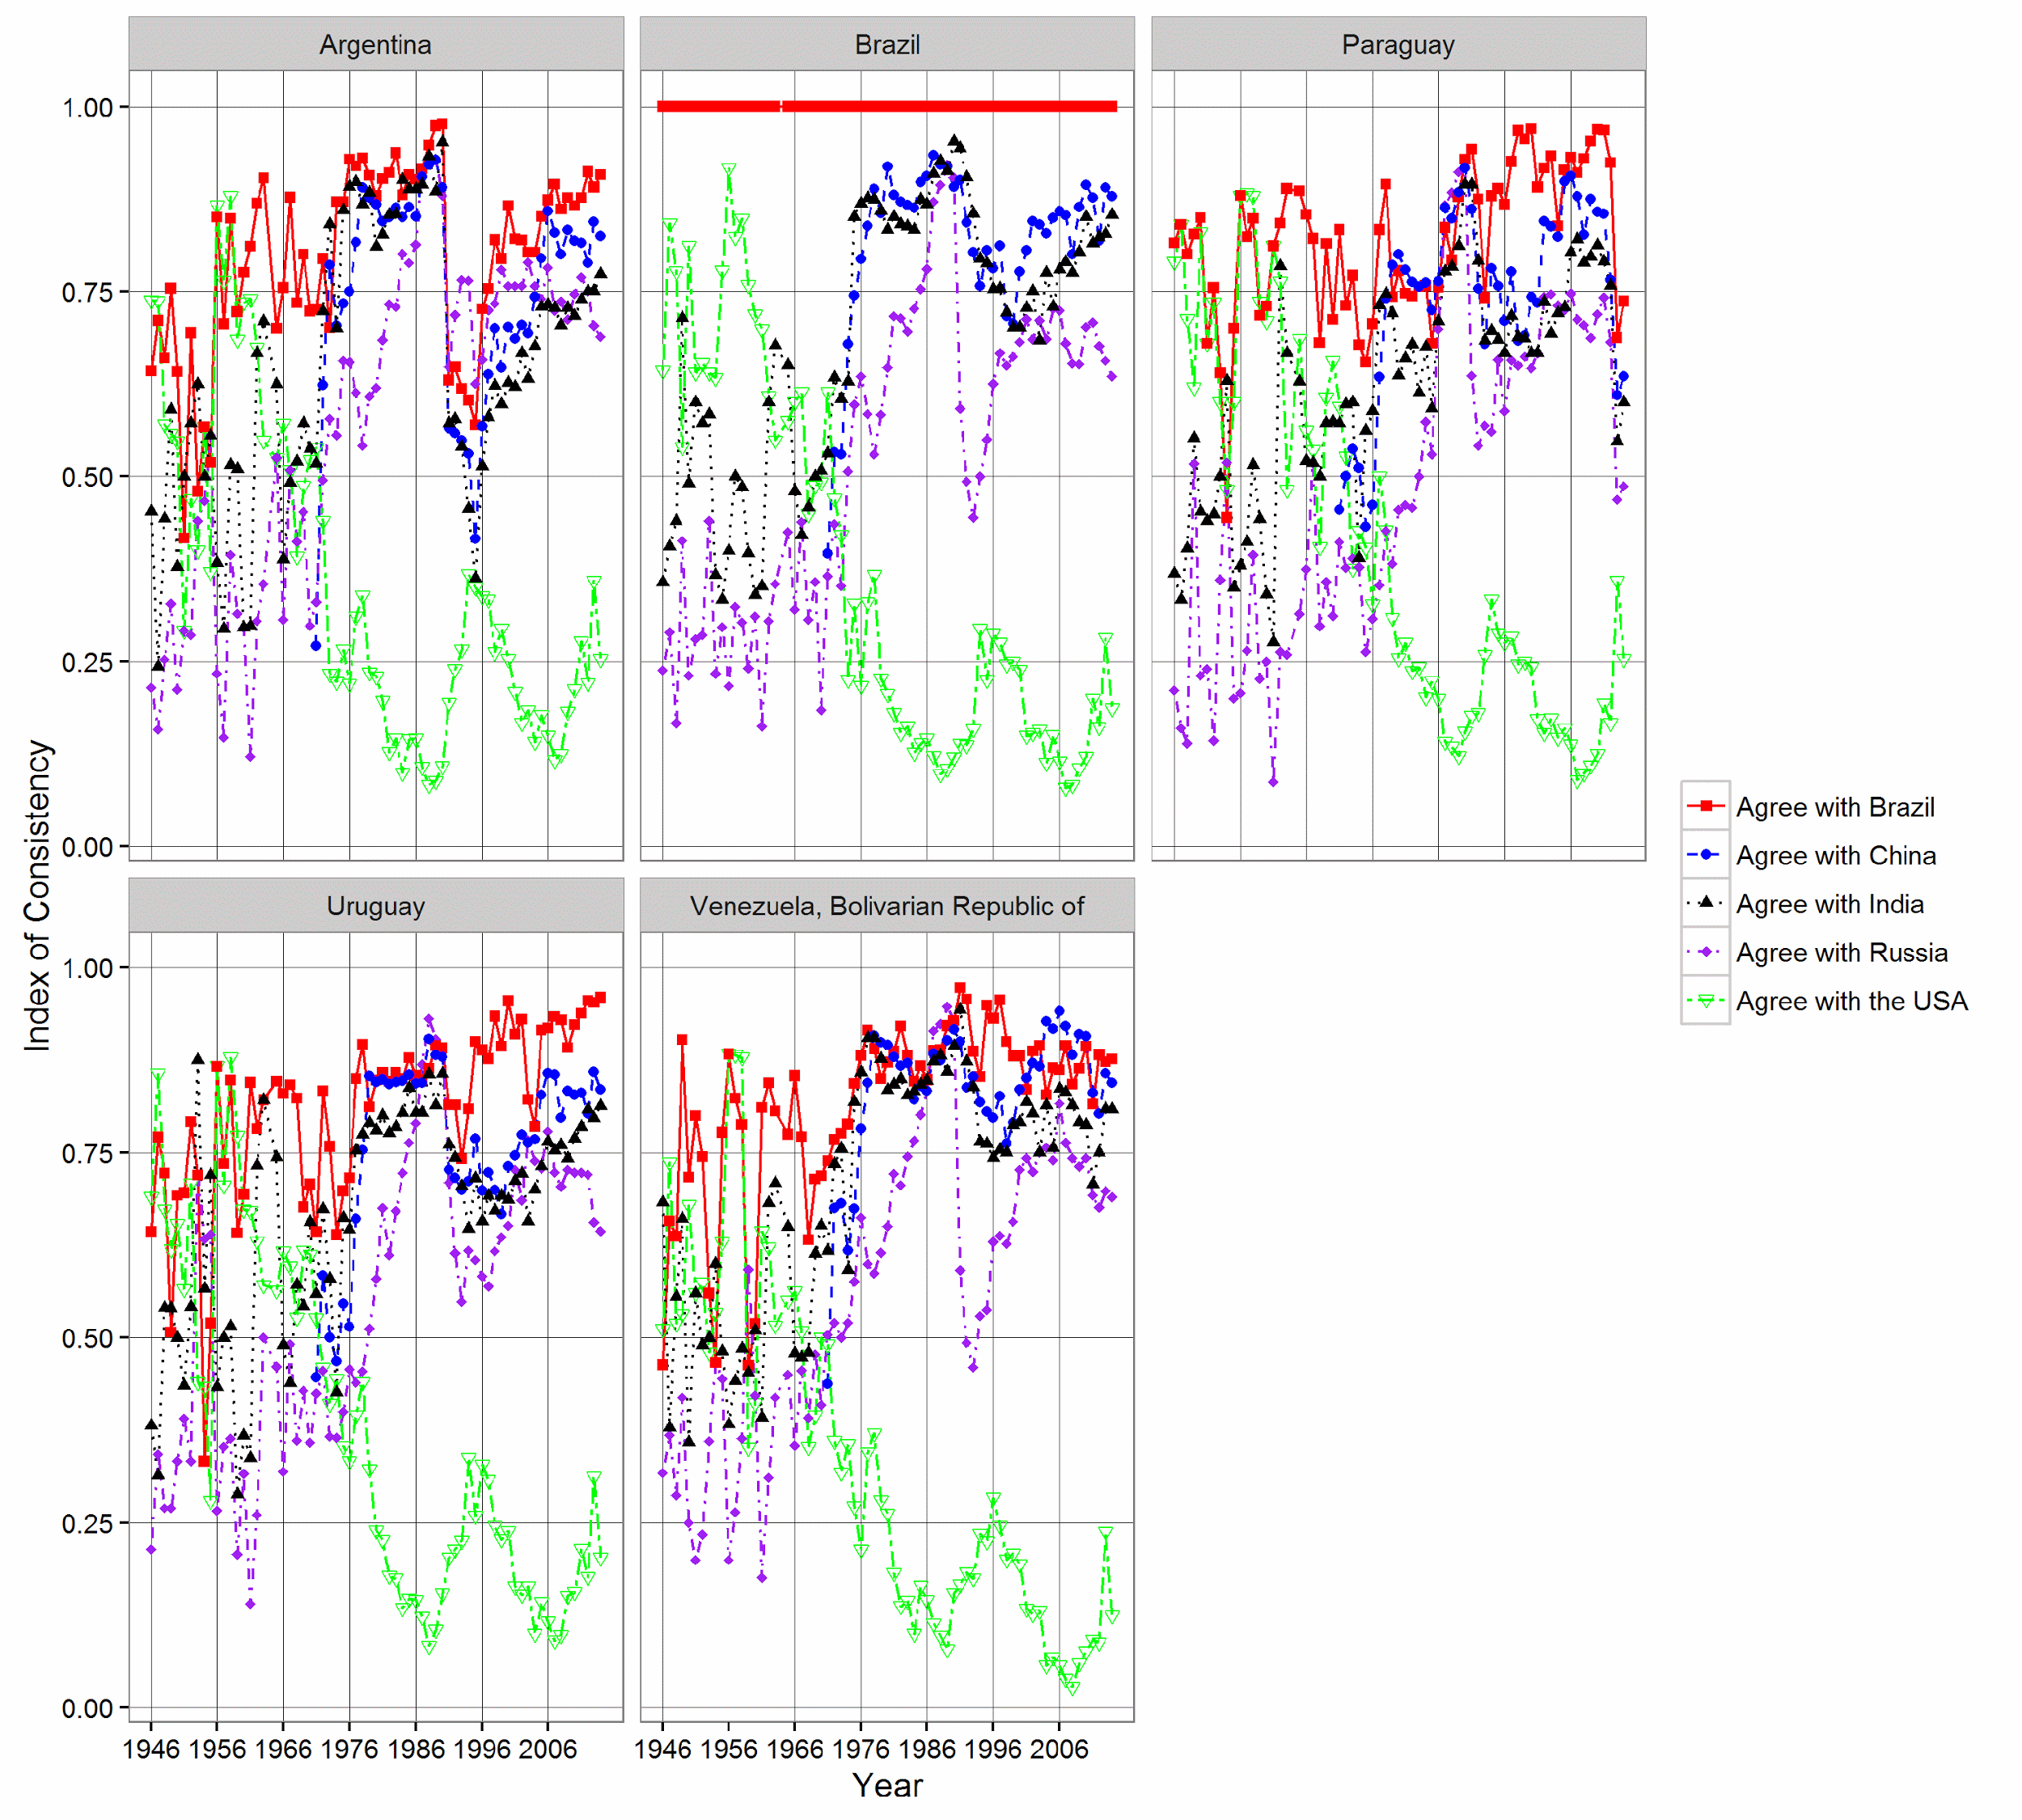
Fig. 19. Consistency criterion dynamics of MERCOSUR member states, 1946–2014
It is evident that voting dynamics of the five MERCOSUR member states corresponds almost exactly. Until 1960 voting of MERCOSUR member states was similar to one of the USA. Since 1960 the state of affairs has changed, and voting of the former has corresponded with the voting of the BRICS nations.
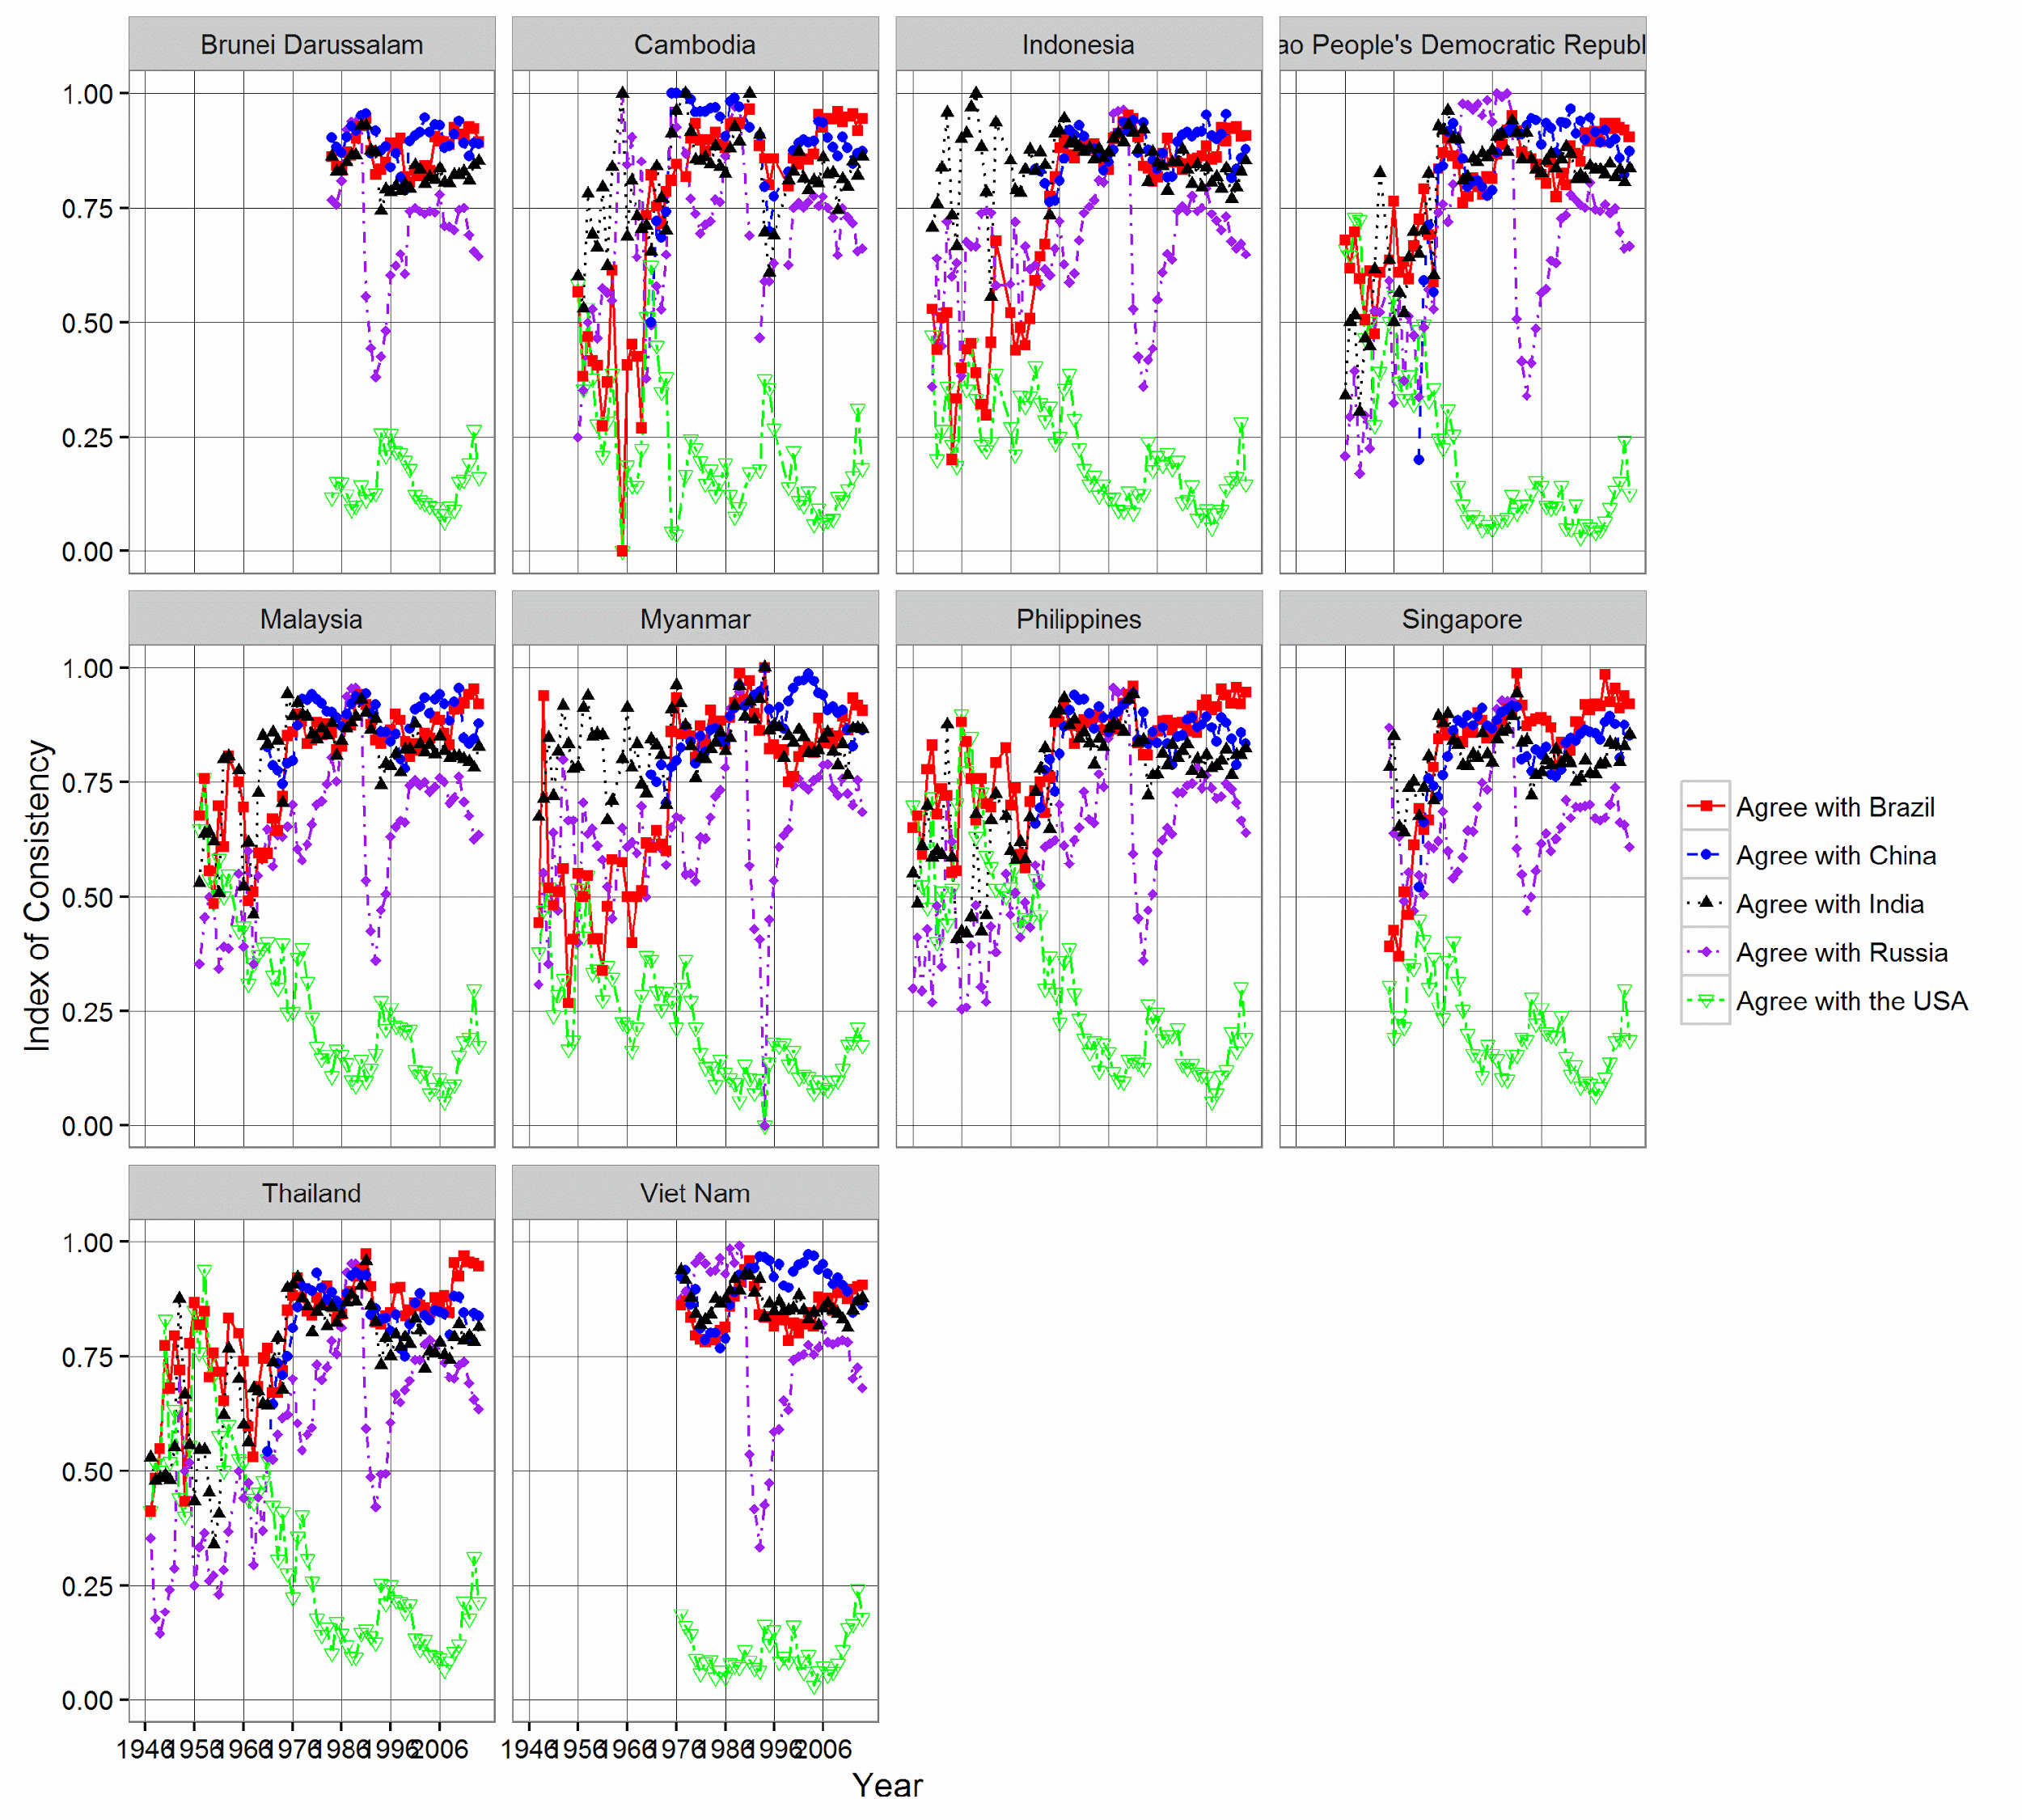
Fig. 20. Consistency criterion dynamics of the ASEAN countries, 1946–2014
As for the Asian region it is necessary to focus on ASEAN countries (see Fig. 20). Voting of the ten ASEAN countries is close to the voting of the BRICS nations, while the level of synchronization with the United States is pretty low.
Recently American establishment has tried to make global economic processes fit their interests. For example, the USA produced an idea of the Trans-Pacific Partnership, which is aimed at reducing the influence of Russia and China on the world trade. Twelve countries signed an agreement establishing the Partnership on February 4, 2016. Hence it is important to analyze member states' voting synchronization (see Fig. 21).
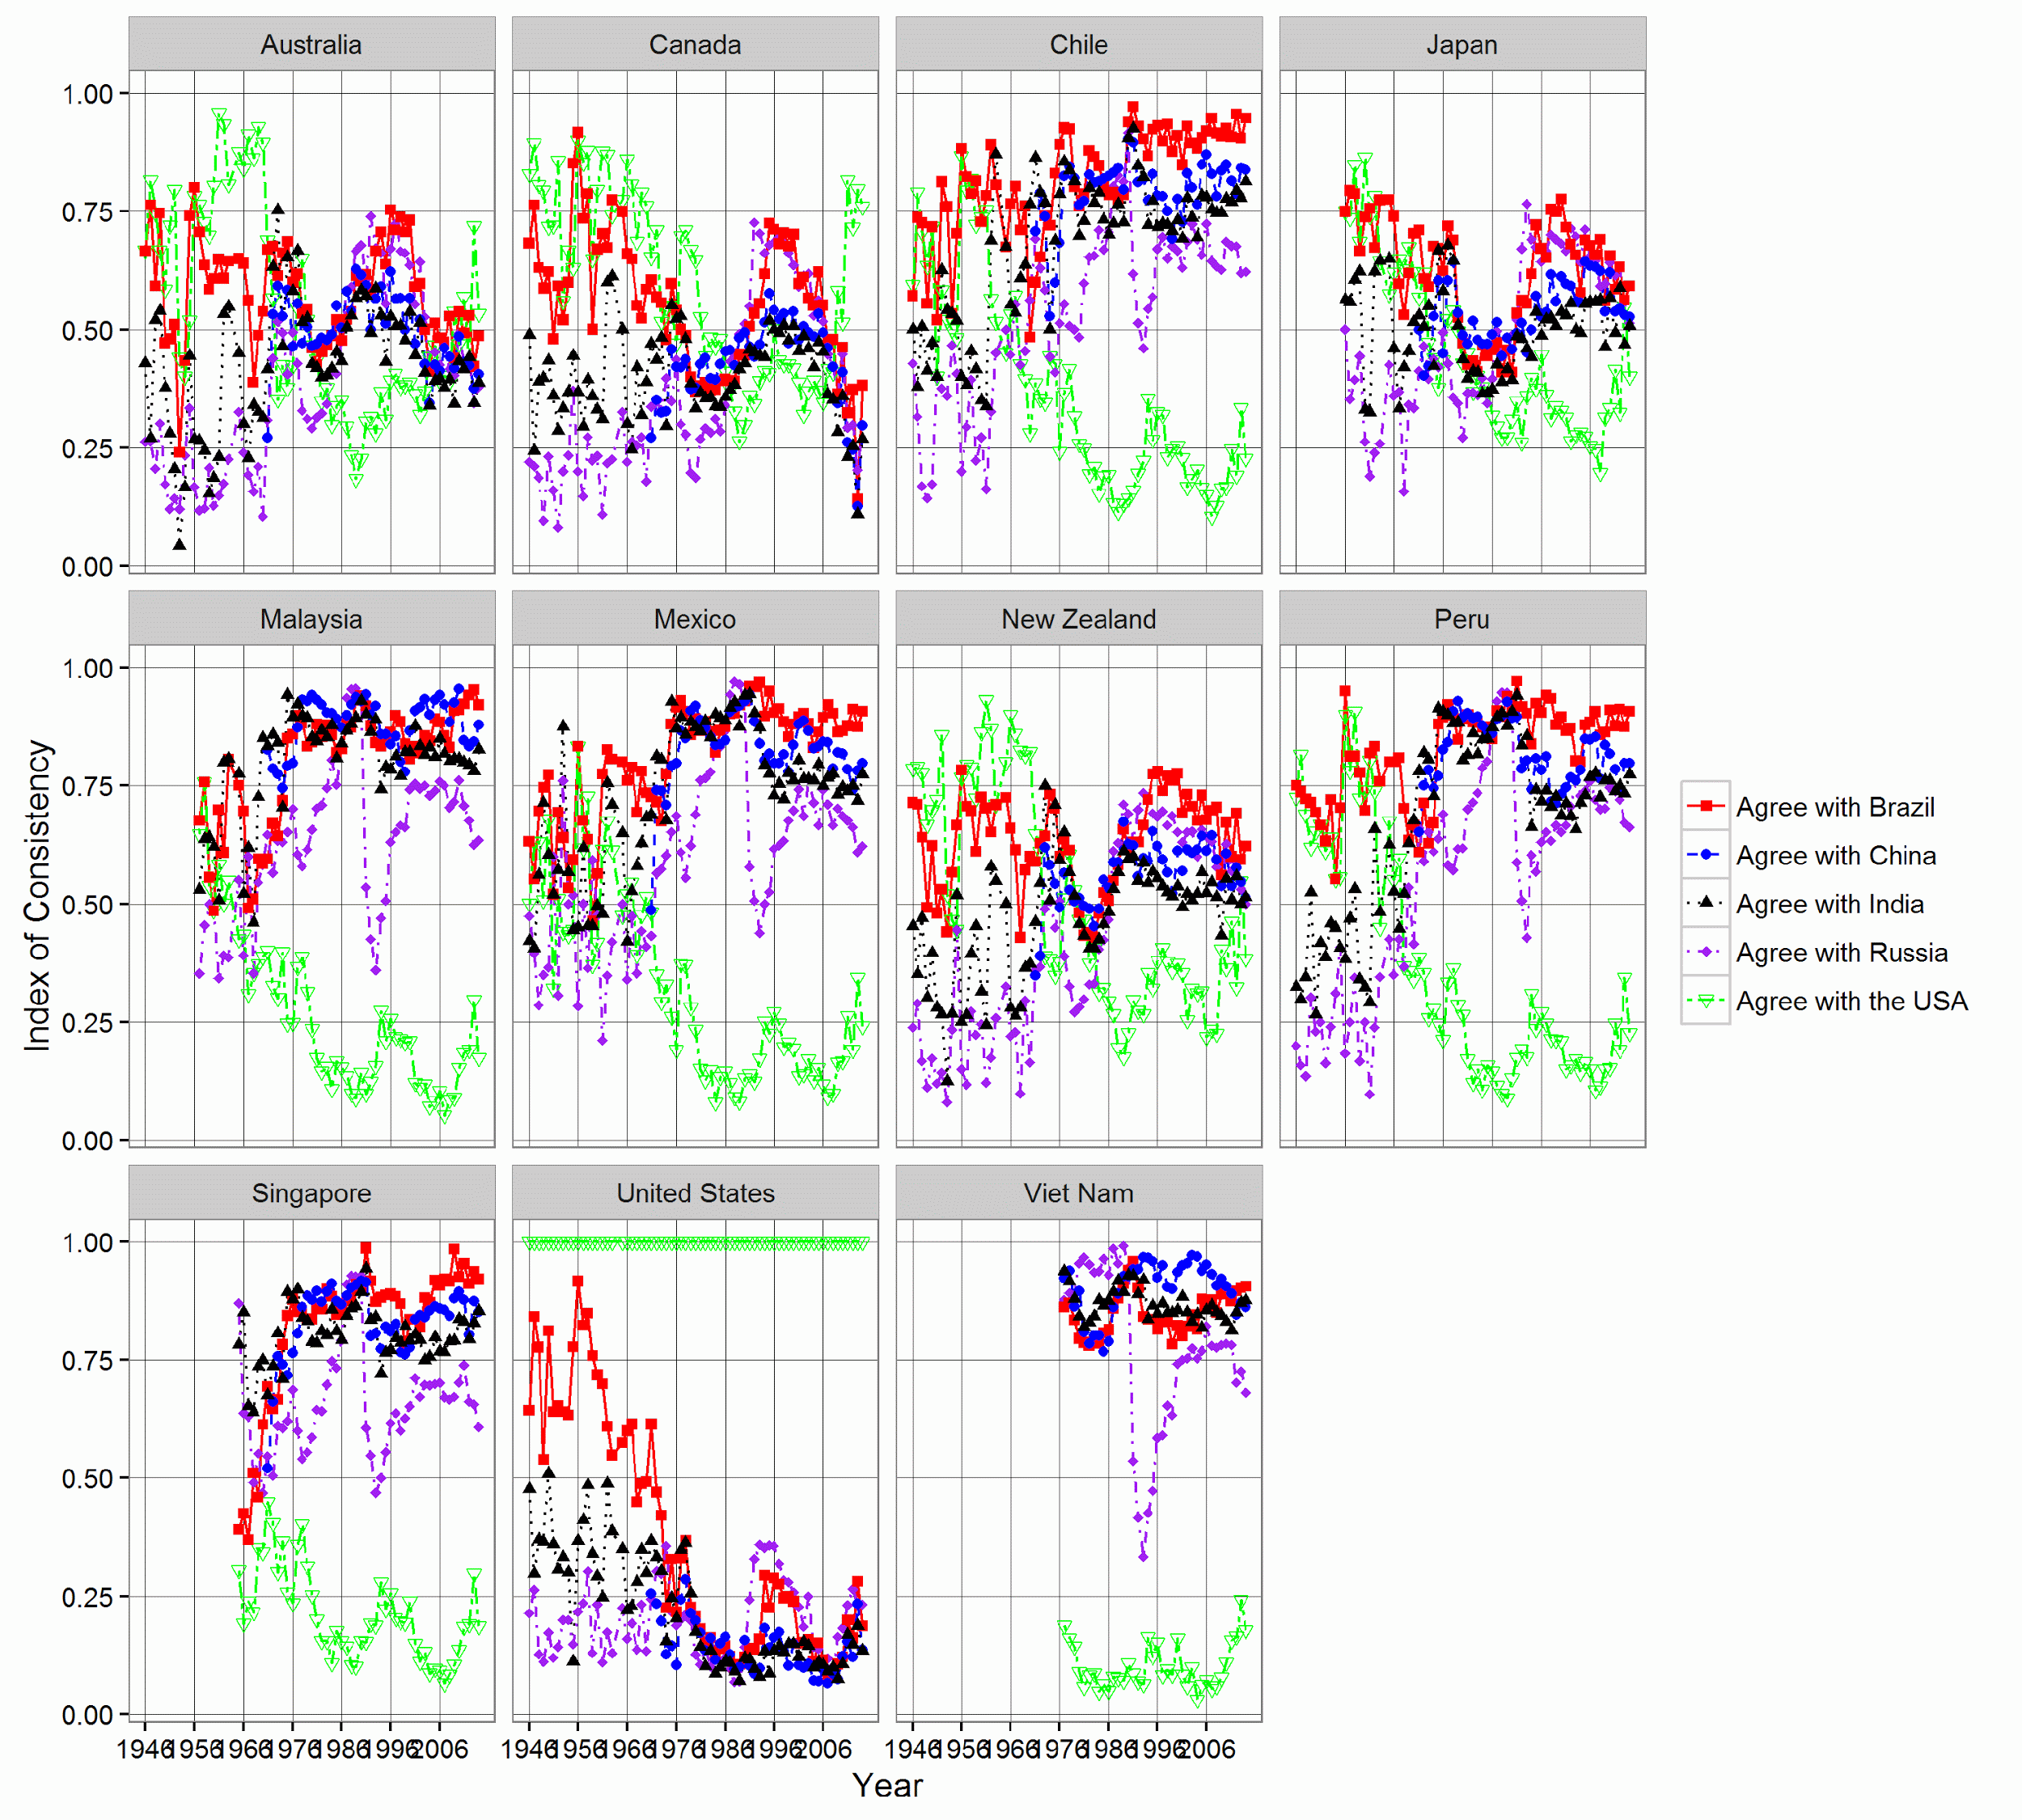
Fig. 21. Consistency criterion dynamics of the TRANS-Pacific partnership member states, 1946–2014
It is important to outline there is no common position among the above-mentioned countries:
-
thus, Australia and Canada are pro-American and their positions are not close to the ones of the BRICS nations;
-
Chile, Malaysia, Mexico, Peru, Singapore, Vietnam, on the contrary, have similar position to ones of the BRICS countries;
-
Japan and New Zealand's positions differ depending on a particular situation.
In conclusion we analyze voting dynamics in the Group of Seven (G-7), which is considered one of the most important informal bodies on the world scene (see Fig. 22).
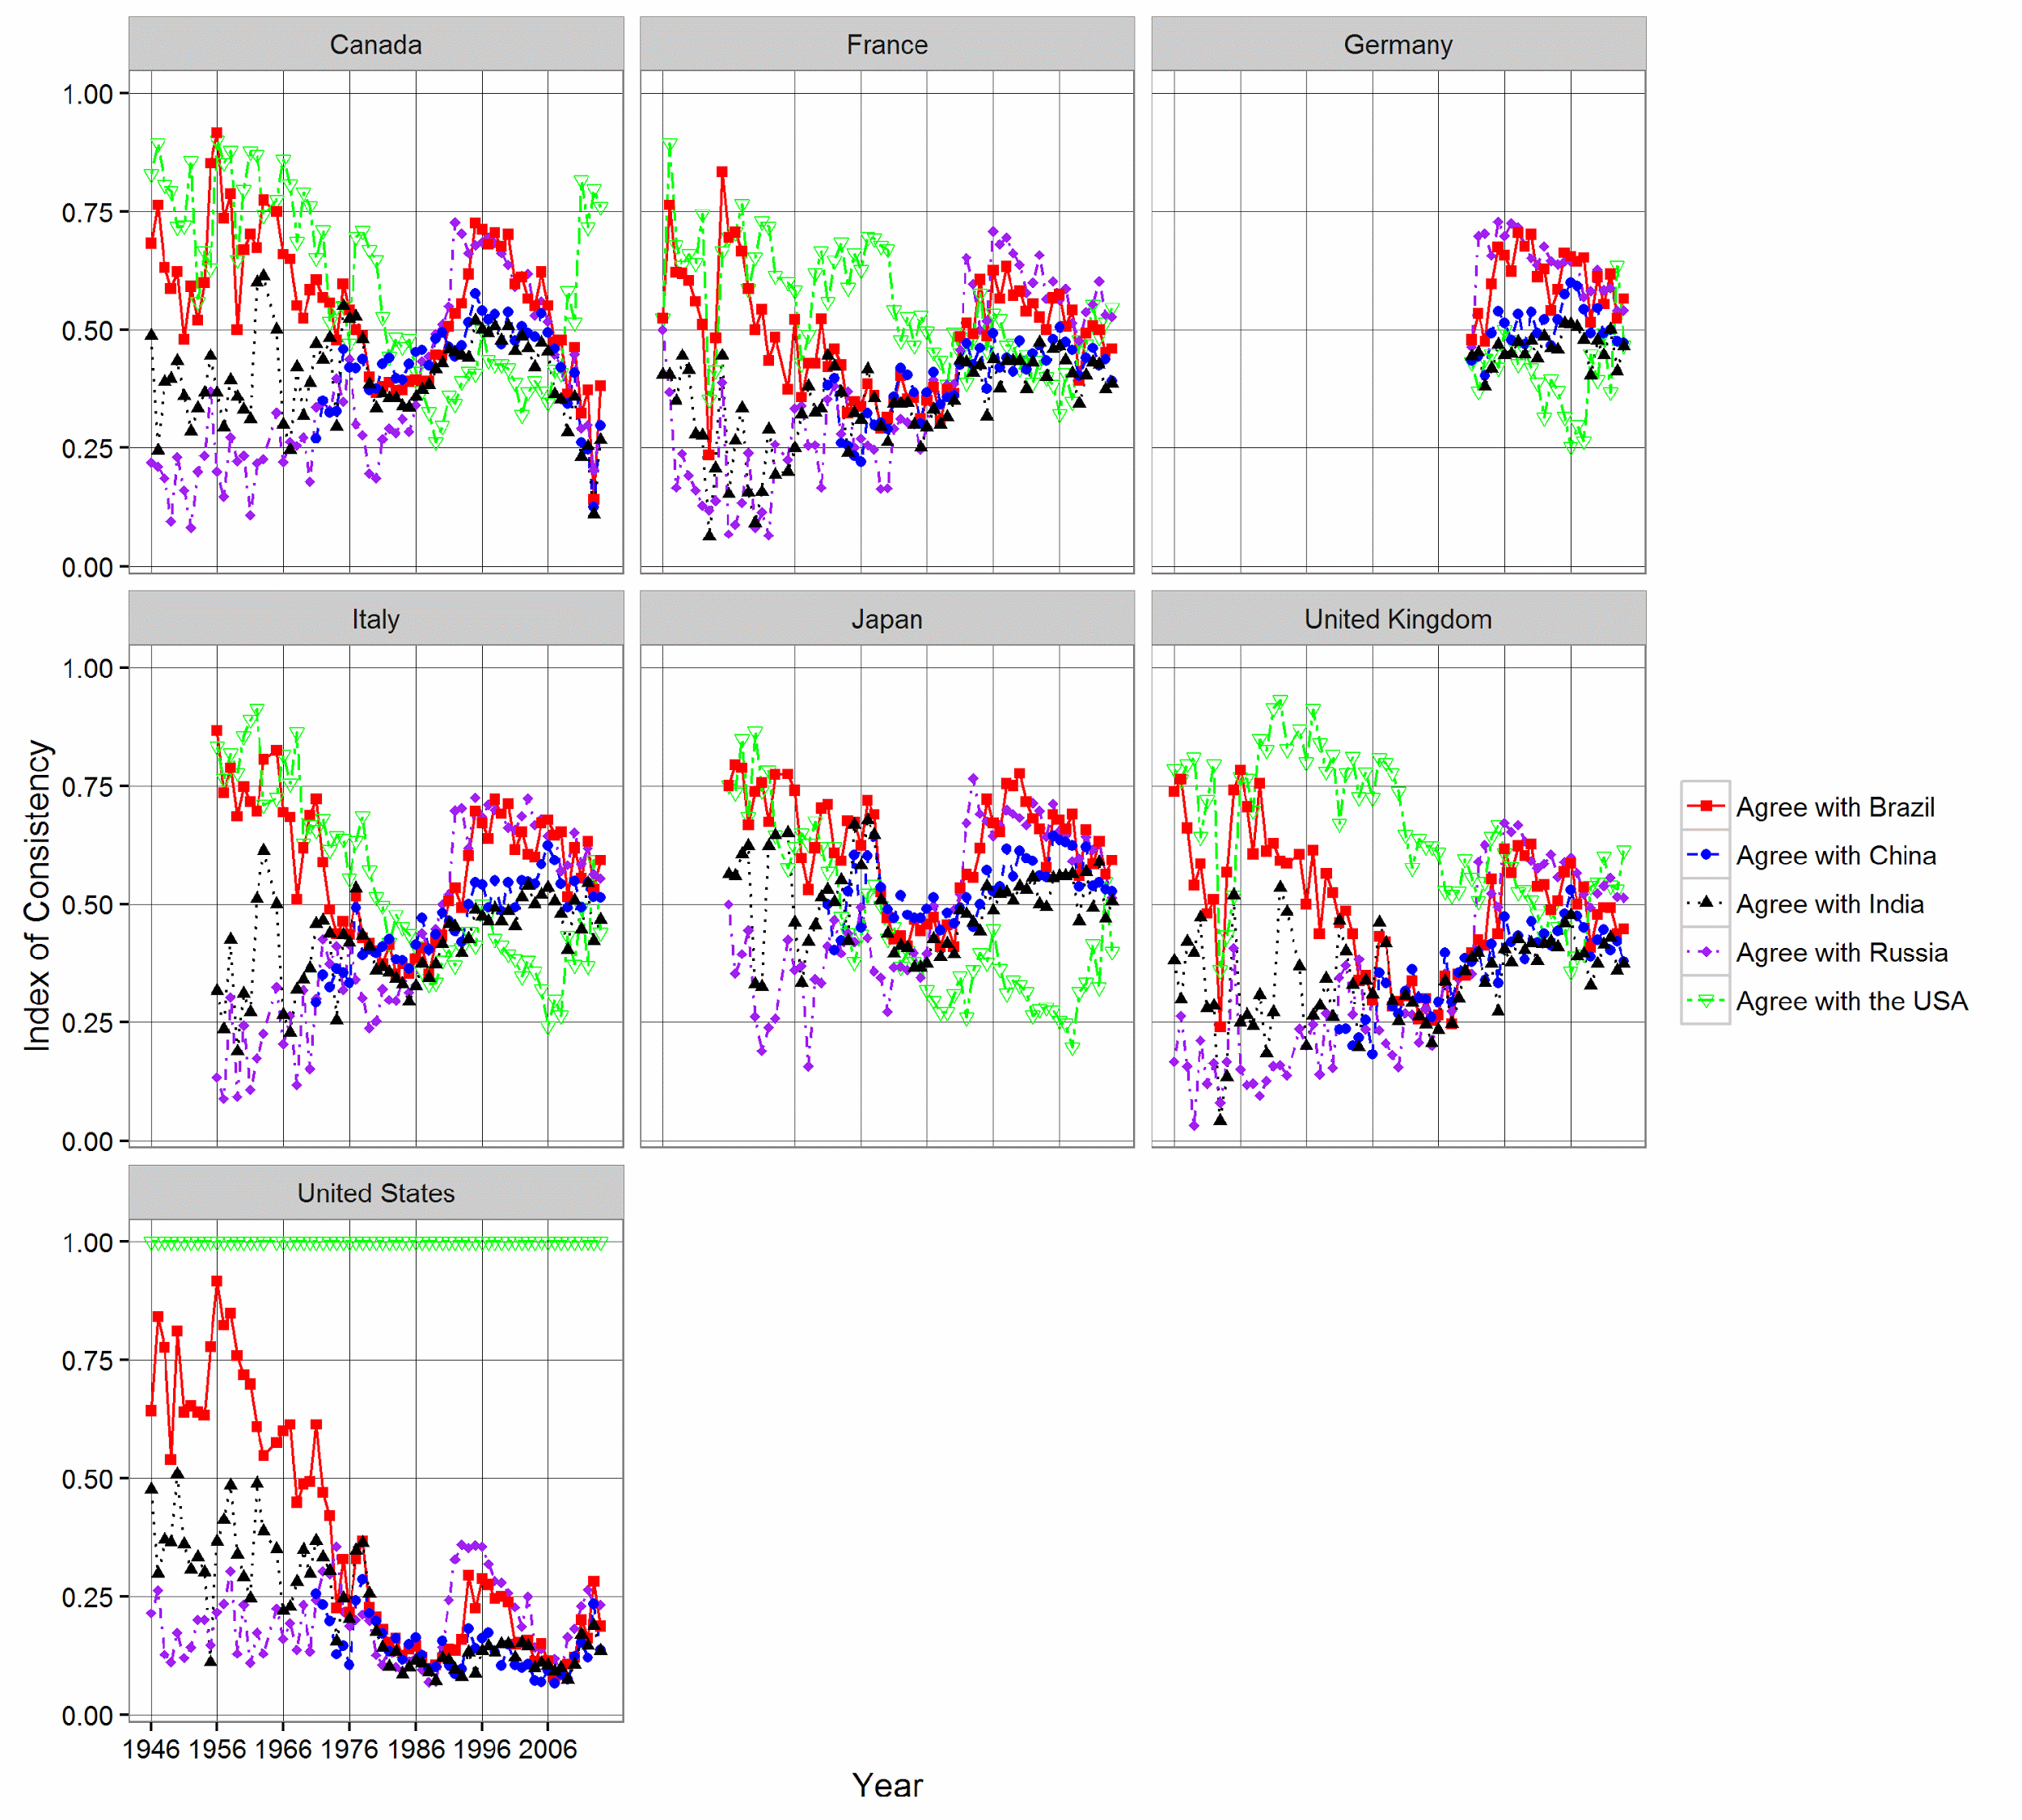
Fig. 22. Consistency criterion dynamics of the G-7 member states, 1946–2014
Apparently, over the last decades all the countries voting in the UN GA divided into two groups, ones supporting the US' position more, and ones supporting the BRICS nations' position more. Thus, voting of Canada and the UK is closer to the USA, while voting of France, Germany, Italy, Japan is closer to BRICS nations.
We can derive the following main points from the figures above:
-
after the World War II the political authority of the United States has been steadily declining (within the framework of the voting processes there is less G-7 member states alignment with the United States);
-
however, since 2008 the voting consistency of the G-7 member states and the United States started growing, which is caused by rising influence of the BRICS nations. The latter is definitely not hailed by the Western countries.
Thus, on the basis of statistical data of voting in the UN General Assembly, at present we can define at least two key players on the world scene, which are the BRICS nations and the USA. Their positions are completely opposite to each other. And other countries align with either the BRICS nations or the USA while voting.
Voting dynamics show the following:
-
although BRICS as an association was established at the beginning of the 2000s, China, India, Brazil and the USSR voted very consistently in the UN GA within the period of the second half of the 1970s – the end of the 1980s;
-
until the mid-1970s, many UN member states voted in the same way as the United States, but then the US influence in the UN went gradually down. Since 2008 however, the US influence started to rise again due to confrontation with Russia and the BRICS nations as a whole.
References
Bailey, M. A., Strezhnev, A., and Voeten, E. 2015. Estimating Dynamic State Preferences from United Nations Voting Data. Journal of Conflict Resolution: 1–27.
Lijphart, A. 1963. The Analysis of Bloc Voting in the General Assembly: A Critique and a Proposal. American Political Science Review 57 (04): 902–917.
Voeten, E. 2013. Data and Analyses of Voting in the UN General Assembly. In Reinalda, B. (ed.), Routledge Handbook of International Organization (pp. 54–66). London: Routledge.