Demographic Globalization: Contribution to Global Economic Growth in Long-Term Perspective

Journal: Journal of Globalization Studies. Volume 14, Number 2 / November 2023
DOI: https://doi.org/10.30884/jogs/2023.02.03
Sergey G. Shulgin, International Laboratory of Demography and Human Capital, Russian Presidential Academy of National Economy and Public Administration, Moscow
Andrey G. Shulgin, Volgo-Vyatka Main Branch of the Bank of Russia, Nizhniy Novgorod
Julia V. Zinkina, International Laboratory of Demography and Human Capital, Russian Presidential Academy of National Economy and Public Administration, Russian Federation; Faculty of Global Studies, Lomonosov Moscow State University
Demography is one of the important factors of the Great Convergence. We estimate the contribution of the demographic factor to the prospective GDP dynamics for all countries of the world up to 2100. We use a long-term economic growth model that is based on estimates of labor productivity growth rates and incorporates the demographic forecast for both population and life expectancy. Globally, our model estimates long-term economic growth of world GDP at an average annual rate of 1.7 per cent, of which the demographic factor accounts for 0.54 percentage points, or about one-third (31.8 per cent) of the projected world economic growth in the twenty-first century. In our forecasts, we have relied on the logic of the previous research on convergence, which considered a sufficiently high level of the human capital development and a sufficient degree of economic openness as necessary conditions for convergence, which have now largely been achieved throughout the world precisely through the globalization processes (especially in the core and the semi-periphery of the World System). However, the inclusion of the demographic projections in our forecasts allows us to emphasize an important feature of the perspective convergence – it is not the semi-periphery, but rather the periphery of the World System, or the ‘bottom billion’ according to Collier, that is likely to converge particularly rapidly with both the core and the semi-periphery (such as the BRICS countries) thanks to favorable demographic structure. The paper has been prepared within the framework of RANEPA state assignment in 2023.
Keywords: convergence, globalization, long-term economic forecast, long-term population forecast, demographic contribution to economic growth, glo-bal aging.
Introduction
The Great Convergence is one of the most important global processes of the early twenty-first century (see, e.g., Baldwin 2017; Grinin and Korotayev 2015; Grinin, Korotayev, and Tausch 2016; Korotayev and Zinkina 2014). As early as the mid-twentieth century, Alexander Gerschenkron (1962) developed the ‘theory of relative backwardness,’ according to which backward countries (with the necessary resources) were expected to benefit more from industrialization than the developed economies in terms of their economic growth rates, which would lead the former to gradually converge with the latter. However, after the peak of the Great Divergence in the 1850s–1870s, more than a century passed before the trend towards convergence manifested itself in the global economy (Grinin and Korotayev 2015: 115). It is no coincidence that the Great Convergence emerged after several decades in the late twentieth century, when globalization was intensifying in an unprecedented way. This process is directly related to, and to a large extent caused by globalization. Indeed, according to Robert Solow's seminal theory of unconditional convergence, a poorer economy (if it is open) can offer its potential foreign investors a higher marginal product of capital – and hence higher profits – than the more affluent countries (Solow 1956). Globalization makes most countries more open than ever – so foreign investment should contribute to a faster increase in the capital stock in poorer countries rather than in richer ones, even if the level of domestic savings in these countries is low (Korotayev et al. 2011: 27). The factor of capital movements works in line with the technological transfers through which Gerschenkron explains convergence, because the capital movement from the World System core to the periphery is almost inevitably accompanied by technological transfers. The spread of the technologies of the fifth technological paradigm, especially the Internet, has made it easier than ever to invest abroad. Moreover, the last decades of the twentieth century and the beginning of the twenty-first century saw an unprecedented expansion of education in the developing countries, which improved their conditions for adopting technologies developed in the World System core countries (Grinin and Korotayev 2015; Korotayev and de Munck 2013).
Demography is one of the important factors of convergence (Korotayev et al. 2015, 2020), as it can make essential contribution to economic growth and its speed. The specific attention of researchers to the relationship between demographic and economic dynamics dates back to Thomas Malthus (1978 [1798]). Simon Kuznets, and later Martin Kremer, viewed this relationship through the prism of technological development. Based on the theory of endogenous technological growth (Kuznets 1960), Kremer proposed that a large population accelerates technological growth by increasing the number of potential inventors (Kremer 1993: 685), whose inventions in turn contribute to economic growth. The factor of technological growth, together with the phenomenon of human capital, is at the center of the unified theory of growth, which links a number of patterns of economic growth to demographic factors. According to this theory, it is the demographic transition, in particular, its second phase (fertility transition), which is closely related to the diffusion of education and human capital, that allows a steady increase in per capita income (Galor and Weil 1999, 2000; Galor 2011). David Bloom shows that taking demographic structure into account improves the forecasting ability of economic models (Bloom and Canning 2008; Bloom et al. 2000, 2007).
Demographic dynamics can contribute to convergence, first and foremost, through the mechanism of the demographic dividend, which implies a high share of working-age people and a low dependency ratio. This, for example, contributed significantly to the East Asian ‘economic miracle’ (Bloom and Williamson 2001; Bloom et al. 2000; Wei and Hao 2010) and later to the economic growth of China and India (Bloom et al. 2010a). At the same time, the lack of a demographic dividend (caused by persistently high fertility and high youth dependency ratios) has caused about two-thirds of Africa's economic backwardness in the later decades of the twentieth century (Ndulu et al. 2007: xviii). More recently, the opposite of the demographic dividend (which we will call the ‘demographic onus’) occurring in the developed countries due to population ageing has recieved considerable attention (Grinin L., Grinin A., Korotayev 2017; Grinin and Korotayev 2016; Bloom et al. 2010b; Van Der Gaag and de Beer 2015; Fougère and Mérette 1999; Cuaresma et al. 2014).
However, much of the existing literature on convergence still considers only relationships based on population size and growth rates and does not consider demographic burden/population ageing in terms of its impact on prospective economic growth and convergence prospects. In this paper, we calculate multi-country GDP projections. The key feature of our projections is the two-step procedure in which we assume that productivity dynamics and demographic dynamics for each country are invariant for each other. First, we make projections of the productivity dynamics for each country. Second, we make demographic forecasts. We then proceed to use both to project GDP dynamics.
Productivity Calculations and GDP Forecast
We calculate productivity forecasts for each of the 183 countries in our sample. We use a Schumpeterian approach based on Gerschenkron's (1962) idea of the advantage of backwardness. This idea is related to the concept of the global technological frontier, which is formed by technological leaders in different industries in developed countries (Aghion and Howitt 2009: 151). According to the concept of the global technological frontier, the aggregate productivity of all countries is lower than that of a certain ‘fictitious’ country consisting of technological leaders in all industries.
We assume that each country can experience both beta-convergence to and beta-divergence from the global technological frontier (Barro and Sala-i-Martin 1992). Both convergence and divergence factors largely depend on the dynamics of the institutions, which weaken the inertia (Acemoglu and Robinson 2012; Hall and Jones 1999; North 1984). Depending on the quality of institutions and the specificities of the R&D processes, countries may find themselves further from or closer to the aggregate productivity of the ‘fictitious’ country mentioned above (Aghion and Howitt 2009).
Beta convergence in low-productivity countries can be explained, among other factors, by the adoption of technologies already developed in technologically leading countries (Aghion and Howitt 2009: 165). For this process to take place, a country needs to fulfil a number of conditions, such as having good institutions with mass coverage, a sufficiently developed social infrastructure, etc. Beta divergence is usually associated with the inability of a country to initiate the transfer of technologies from the technological leaders, which prevents it from leaving the ‘outsider club’. This may be due to ‘bad’ institutions (inaccessible to large groups of the population, dividing rather than uniting society, failing to provide equal opportunities), lack of social infrastructure or insufficient level of its development, etc. The institutions associated with beta convergence/divergence are, on the one hand, quite stable and tend to change rather slowly, but on the other hand, they should not be considered as a completely stable factor. This means that for each country, the level of convergence measured and calculated from historical data will amortize in the future.
We also assume that in some countries, the average productivity may be higher than that of one of the technological leaders, due to the presence of valuable natural resources or some other type of rent. For such countries, we use the same methodology as for all other countries and calculate the level of convergence, keeping in mind that the process of convergence is not based on technology transfer, but on the depletion of the source of prosperity.
For productivity, we use a two-step algorithm. In the first part of the algorithm, we use historical statistics for the period 1980–2016, on the basis of which the trend is calculated and the convergence model is estimated. In the second part, we calculate the productivity forecast up to the year 2100 (for more details, see Appendix A).
Productivity Forecast Results
The productivity of the G7 countries and the calculated productivity (for more details, see Appendix B) of the model technological frontier constructed on seven countries (Australia, the UK, Germany, Canada, USA, France, Japan) in 1980–2016 are shown in Figure 1. This suggects that the productivity growth rate was 0.0122.
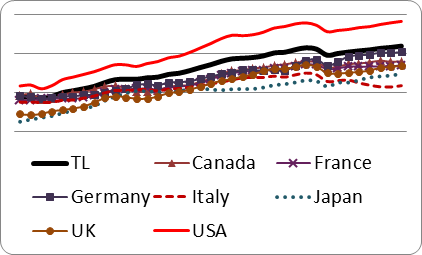
Fig. 1. Average productivity of the G7 countries
and the general dynamics
of the technologically leading countries (model technological frontier), 1980–2016
Source: author's calculations based on IMF data.1
Figure 2 shows the results of the evaluation of the convergence model. The results are presented in two dimensions: the first dimension is productivity and the second dimension is the estimated beta coefficients. Statistically significant betas are circled.
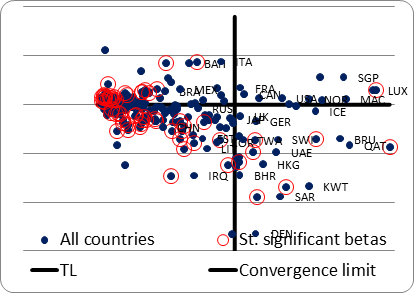
Fig. 2. Results of beta estimates (plotted
vertically)
and average productivity in 2016 (plotted horizontally)
Sixty-three significant betas were found out of 184 estimates. Of the 63 significant betas, 37 are less than one and are in the convergence zone (below the ‘Convergence Boundary’ line in Figure 2). This could serve as evidence of the prevalence of the process of convergence in the world, but if we exclude the countries located to the right of the line of technological leaders, we find that 25 of the 55 countries with statistically significant beta coefficients are in the divergence zone (upper left-hand corner of the figure). The results for the lowest productivity countries are even more impressive: 16 of the 19 poorest countries (with an average productivity of less than USD 10,000 per year per working-age person in 2016 [yj, 2016 < 10000]) with significant betas show divergence. Our results thus confirm the studies of a number of other authors in the sense that for low-productivity countries diverge from the level of the technologically leading countries (Acemoglu and Robinson 2012; Hall and Jones 1999; Aghion and Howitt 2009).
Of
the 34 countries with significant betas in the average productivity range between
10,000 USD (PPP) and 60,000 USD (PPP) a year per working-age person in 2016
[yj, 2016 < Î (10,000, 60,000)],
25 show convergence and are in the lower left-hand corner of Figure 2. These
countries take advantage of underdevelopment most effectively and are mostly
emerging market economies. The bottom right-hand corner of the figure is
occupied by rich countries showing convergence – mostly oil-exporting countries
whose ‘excess’ productivity is gradually disappearing as a result of lower real
oil prices. Only one rich country, Luxembourg, has a significant beta while
being in the upper right-hand corner (i.e.,
showing divergence).
We evaluate the simplest convergence equation (5), which does not take into account the second and higher order effects, as we believe that they are difficult to measure correctly on the available data set. The underlying model used to explain the future development of productivity assumes a second-order effect, since the institutions that induce convergence or divergence are not eternally stable. We cannot predict the emergence and disappearance of such institutions, but we can predict that existing institutions will be less effective in supporting the processes of convergence and divergence that we have identified for different countries in the 1980–2016 data. We call this process institutional depreciation and relate it to beta depreciation (Equation 8 in Appendix A). We believe that in the high and medium productivity range, the process of convergence is characterized by less depreciation than the process of divergence, because it is an extremely difficult to rescue bad institutions in times of economic turbulence. However, this logic assumes a certain level of democracy and does not work for the poorest countries, which are in a ‘vicious circle’ of ‘exclusive’ economic institutions and ‘exclusive’ institutions that develop and implement policies (Acemoglu and Robinson 2012). However, we extend our assumption of more pronounced ‘amortization’ in economies with growth trajectories that do not converge to the global technological frontier, to include the poorest countries, given the role of globalization processes that may accelerate the development of institutions in the poorest countries in the future. The role of demography in the convergence of the poorest countries may be even more important than the role of institutions, but this issue will be discussed in more detail below.
The results of the productivity forecast based on the damping of convergence and divergence processes are shown in Figure 3. We have selected several countries with statistically significant betas located in different corners of Figure 2 and present their dynamics in terms of betas and the logarithm of the productivity distance from the technology leaders.
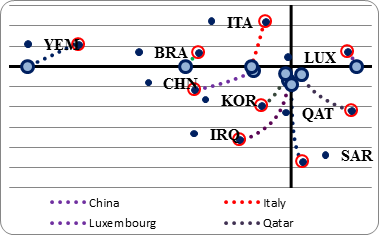
Fig. 3. Results of the productivity forecast. Dynamics of the beta coefficients (plotted vertically) and the logarithm of the distance between a country's productivity and the productivity of technology leaders (plotted horizontally)
Source: authors' calculations.
For countries that started in the divergence zone, we assume that by 2100 they will be very close to betas and that the divergence process will almost cease by 2100. For countries that started in the convergence zone, the level of convergence will decrease slightly. We assume that the current divergence process as a whole will almost cease by 2100, while the driving forces of convergence will continue to operate, but at a much lower intensity. We are aware that our performance forecast is a simplification of reality, as new drivers of convergence and divergence will emerge, but the time and place of their emergence cannot be predicted on the basis of the available information.
Results of the GDP Forecast
GDP forecasts can be calculated based on the basis of the projections of the working-age population and the productivity forecasts made above. The decomposition of the GDP growth factors is shown in Tables 1–5. Based on the projections of productivity, economically-active-aged population and GDP, the world economy will grow at an average annual rate of 1.7 per cent, with the growth rate of the global technology frontier (+1.23 percentage points) being the main contributor. The growth rate of the world's working-age population will add +0.54 percentage points, while the expected convergence and divergence processes will make a negative contribution (–0.08 percentage points) to the overall projected global GDP growth. All 183 countries in Tables 1–5 have positive average projected GDP growth rates. Outliers from the projected growth are Jamaica (+0.13 %), Moldova (+0.24 %), Poland (+0.41 %), Bulgaria (+0.45 %), and Puerto Rico (+0.45 %). All these countries are expected to have significant problems with the size of the working-age population, which, together with technological progress, is one of the main sources of the projected GDP growth dynamics.
The leaders in terms of GDP growth are Niger (+4.56 %), Angola (+3.9 %), Iraq (+3.88 %), Uganda (+3.82 %), and Zambia (+3.81 %). Their leading position is also due to the expected explosive growth of the working-age population, and only for Iraq a part of its high growth rate is due to productivity growth as a result of the convergence process. The projected productivity dynamics will make a certain contribution to the GDP dynamics in these countries, but it will be less than the contribution of the dynamics of the population of working age.
All countries will grow thanks to the growth rate of the global technological frontier (+ 1.23 %), and the productivity of some countries will grow faster (or slower) due to convergence (divergence) processes in these countries. The countries expected to lead in productivity growth due to the convergence process are Myanmar (+1.59 %), Georgia (+1.18 %), Armenia (+1.08 %), Bosnia and Herzegovina (+1.02 %), Bhutan (+ 0.93 %), and China (+0.87 %). The strongest slowdowns in growth due to the divergence process are likely to be observed in Yemen (–0.75 %), Qatar (–0.75 %), Bahamas (–0.44 %), Brunei (–0.41 %), and Haiti (–0.4 %).
Estimates of the Demographic Contribution to Economic Development
The demographic projections are based on the United Nations medium population projections. To construct demographic projections, we use the UN data on age-sex structure in 1-year age groups. Life expectancy is steadily increasing in all the countries we analyze. We use the UN medium projection estimates of male and female mortality.2
For the global economy as a whole, our model estimates long-term economic growth with an average annual global GDP growth rate of 1.7 per cent, of which the demographic factor contributes 0.54 percentage points. Thus, the demographic factor, which is related to both population growth and increases in life expectancy, accounts for about one-third (31.8 %) of projected global economic growth in the twenty-first century.
The demographic contribution to economic development is higher than the world average mainly in African countries and some countries in Central Asia and the Middle East (see the first and second lightest categories in Figure 5, and Tables 1 and 2). We single out a group of countries where the demographic factor plays a dominant role in the projected dynamics of long-term economic development. This group consists mainly of African countries (mainly sub-Saharan countries), as well as Iraq, Yemen and Afghanistan (see Table 1 and the first category in Figure 4).
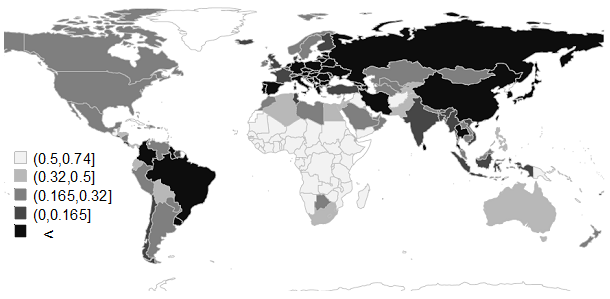
Fig. 4. Contribution of the demographic factor to future economic growth
Table 1
Countries with the dominant contribution of demographics
to long-term economic growth until 2100
| Country |
Average
growth rates, percentage points |
Demographic contribution to growth, percentage points | Share of demographic contribution to general growth, % |
| Congo, Dem. Rep. | 3.31 | 2.45 | 74.0 % |
| Niger | 4.56 | 3.29 | 72.1 % |
| Yemen | 1.66 | 1.18 | 71.1 % |
| Madagascar | 2.96 | 2.07 | 69.9 % |
| Burundi | 3.47 | 2.41 | 69.5 % |
| Cote d’Ivoire | 3.18 | 2.16 | 67.9 % |
| Angola | 3.9 | 2.63 | 67.4 % |
| Uganda | 3.82 | 2.56 | 67.0 % |
| Zambia | 3.81 | 2.55 | 66.9 % |
| Tanzania | 3.78 | 2.52 | 66.7 % |
| Togo | 2.74 | 1.8 | 65.7 % |
| Mali | 3.67 | 2.41 | 65.7 % |
| Mozambique | 3.63 | 2.37 | 65.3 % |
| Guinea | 3.25 | 2.1 | 64.6 % |
| Chad | 3.55 | 2.29 | 64.5 % |
| Burkina Faso | 3.53 | 2.27 | 64.3 % |
| Congo, Rep. | 3.49 | 2.23 | 63.9 % |
| Malawi | 3.48 | 2.22 | 63.8 % |
| Nigeria | 3.46 | 2.2 | 63.6 % |
| Senegal | 3.42 | 2.17 | 63.5 % |
| San-Tome and Principe | 2.77 | 1.74 | 62.8 % |
| Cameroon | 3.33 | 2.08 | 62.5 % |
| Benin | 3.33 | 2.07 | 62.2 % |
| Liberia | 3.33 | 2.07 | 62.2 % |
| The Comoros | 2.49 | 1.53 | 61.4 % |
| The Gambia | 3.25 | 1.99 | 61.2 % |
| Equatorial Guinea | 3.18 | 1.92 | 60.4 % |
| Kenya | 2.82 | 1.7 | 60.3 % |
| South Sudan | 3.17 | 1.91 | 60.3 % |
| East Timor | 3.16 | 1.9 | 60.1 % |
| Central African Republic | 3.13 | 1.88 | 60.1 % |
| Sudan | 3.13 | 1.87 | 59.7 % |
| Mauritania | 3.09 | 1.84 | 59.5 % |
| Guinea-Bissau | 3.07 | 1.81 | 59.0 % |
| Eritrea | 3.04 | 1.79 | 58.9 % |
| Vanuatu | 2.45 | 1.4 | 57.1 % |
| Ethiopia | 2.79 | 1.54 | 55.2 % |
| Ghana | 2.78 | 1.53 | 55.0 % |
| Zimbabwe | 2.78 | 1.53 | 55.0 % |
| Kiribati | 2.05 | 1.12 | 54.6 % |
| The Solomon Islands | 2.71 | 1.46 | 53.9 % |
| Iraq | 3.88 | 2.08 | 53.6 % |
| Rwanda | 2.69 | 1.44 | 53.5 % |
| Gabon | 2.64 | 1.39 | 52.7 % |
| Sierra Leone | 2.63 | 1.38 | 52.5 % |
| Namibia | 2.6 | 1.35 | 51.9 % |
| Afghanistan | 2.59 | 1.34 | 51.7 % |
| Guatemala | 2.15 | 1.11 | 51.6 % |
| Papua New Guinea | 2.53 | 1.29 | 51.0 % |
The second group includes countries with a very high contribution of demography to economic growth (above the world average). Among the developed countries, this group includes Israel, Australia and Qatar (see Table 2 and the second category in Figure 1).
Table 2
Countries with demographic contribution to economic growth
above the global average
| Country |
Average
growth rates, percentage points |
Demographic
contribution to growth, percentage points |
Share
of demographic contribution to general growth, % |
| Tajikistan | 2.44 | 1.19 | 48.8 % |
| Egypt | 2.36 | 1.12 | 47.5 % |
| Eswatini (Swaziland) | 2.3 | 1.06 | 46.1 % |
| Israel | 2.28 | 1.04 | 45.6 % |
| Jordan | 2.26 | 1.02 | 45.1 % |
| Belize | 2.21 | 0.97 | 43.9 % |
| Pakistan | 2.21 | 0.97 | 43.9 % |
| Qatar | 0.83 | 0.35 | 42.2 % |
| Tonga | 2.07 | 0.83 | 40.1 % |
| Bolivia | 2.08 | 0.83 | 39.9 % |
| The Philippines | 2.08 | 0.83 | 39.9 % |
| Lesotho | 2.66 | 1.02 | 38.3 % |
| Honduras | 1.79 | 0.68 | 38.0 % |
| Samoa | 1.98 | 0.74 | 37.4 % |
| Algeria | 1.63 | 0.6 | 36.8 % |
| Panama | 1.94 | 0.7 | 36.1 % |
| Djibouti | 1.43 | 0.5 | 35.0 % |
| Australia | 1.88 | 0.64 | 34.0 % |
| South Africa | 1.57 | 0.53 | 33.8 % |
| Kyrgyzstan | 1.87 | 0.63 | 33.7 % |
| Ecuador | 1.86 | 0.62 | 33.3 % |
| Haiti | 1.24 | 0.41 | 33.1 % |
| Kuwait | 1.28 | 0.42 | 32.8 % |
The third group consists of countries with a high contribution of demography to economic growth rates. Among the developed countries, this group includes the USA, Sweden, Norway, Canada, and New Zealand. It also includes several countries of the Persian Gulf (Saudi Arabia, UAE) (see Table 3 and the third category in Figure 5).
Table 3
Countries with a high contribution of demographics to economic growth rates
| Country |
Average growth rates, percentage points |
Demographic contribution to growth, percentage points |
Share of
demographic contribution to general growth, % |
| Turkmenistan | 1.81 | 0.57 | 31.5 % |
| Mongolia | 1.79 | 0.56 | 31.3 % |
| Luxembourg | 1.99 | 0.62 | 31.2 % |
| Botswana | 2.54 | 0.78 | 30.7 % |
| Kazakhstan | 1.75 | 0.52 | 29.7 % |
| Cabo Verde | 1.76 | 0.52 | 29.5 % |
| Norway | 1.74 | 0.5 | 28.7 % |
| Macao | 1.71 | 0.48 | 28.1 % |
| Paraguay | 1.69 | 0.45 | 26.6 % |
| Venezuela | 1.69 | 0.45 | 26.6 % |
| Argentina | 1.68 | 0.44 | 26.2 % |
| Saudi Arabia | 1.43 | 0.37 | 25.9 % |
| Peru | 1.65 | 0.42 | 25.5 % |
| United Arab Emirates | 1.48 | 0.37 | 25.0 % |
| Bahrain | 1.72 | 0.42 | 24.4 % |
| United States | 1.61 | 0.38 | 23.6 % |
| Oman | 1.62 | 0.38 | 23.5 % |
| Cambodia | 2.74 | 0.64 | 23.4 % |
| Morocco | 1.61 | 0.37 | 23.0 % |
| Ireland | 1.59 | 0.36 | 22.6 % |
| Micronesia | 1.33 | 0.3 | 22.6 % |
| Sweden | 1.58 | 0.35 | 22.2 % |
| Mexico | 1.36 | 0.3 | 22.1 % |
| Canada | 1.59 | 0.35 | 22.0 % |
| Malaysia | 1.95 | 0.41 | 21.0 % |
| New Zealand | 1.56 | 0.32 | 20.5 % |
| Dominican Republic | 1.54 | 0.31 | 20.1 % |
| Uzbekistan | 1.54 | 0.31 | 20.1 % |
| Nicaragua | 1.54 | 0.3 | 19.5 % |
| Lao PDR | 2.38 | 0.45 | 18.9 % |
| The Bahamas | 0.97 | 0.18 | 18.6 % |
| Antigua and Barbuda | 1.51 | 0.28 | 18.5 % |
| Libya | 1.51 | 0.27 | 17.9 % |
| Nepal | 1.49 | 0.25 | 16.8 % |
The fourth group includes countries with an insignificant positive contribution of demography to economic growth, including some developed European countries (France, the UK, Switzerland, Denmark, Iceland, and Belgium). India also belongs to this group of countries and has the highest demographic contribution among the countries in this group (see Table 4 and Category 4 in Figure 5).
Table 4
Countries with a low contribution of demographics to economic growth rates
| Country |
Average
growth rates, percentage points |
Demographic
contribution to growth, percentage points |
Share
of demographic contribution to general growth, % |
| United Kingdom | 1.47 | 0.24 | 16.3 % |
| Bangladesh | 1.48 | 0.24 | 16.2 % |
| Brunei Darussalam | 0.96 | 0.15 | 15.6 % |
| Switzerland | 1.31 | 0.2 | 15.3 % |
| Denmark | 1.44 | 0.21 | 14.6 % |
| Indonesia | 2.04 | 0.29 | 14.2 % |
| Tunisia | 1.44 | 0.2 | 13.9 % |
| India | 2.24 | 0.29 | 12.9 % |
| Turkey | 1.4 | 0.17 | 12.1 % |
| France | 1.39 | 0.16 | 11.5 % |
| Iceland | 1.39 | 0.16 | 11.5 % |
| Belgium | 1.37 | 0.14 | 10.2 % |
| Suriname | 1.36 | 0.13 | 9.6 % |
| Finland | 1.34 | 0.11 | 8.2 % |
| The Maldives | 2.06 | 0.16 | 7.8 % |
| Cyprus | 1.33 | 0.1 | 7.5 % |
| Bhutan | 2.35 | 0.17 | 7.2 % |
| Viet Nam | 2.17 | 0.14 | 6.5 % |
| Fiji | 1.29 | 0.06 | 4.7 % |
| Chile | 1.28 | 0.05 | 3.9 % |
| Myanmar | 2.95 | 0.11 | 3.7 % |
| Costa Rica | 1.27 | 0.04 | 3.1 % |
| Hong Kong, SAR | 1.21 | 0.01 | 0.8 % |
The fifth group includes countries with a negative contribution of demography to long-term economic growth. In this group of countries, long-term economic growth is linked to labor productivity growth, while the projected demographic trajectories of the population (even taking into account the increase in life expectancy) do not contribute to overall economic growth, i.e. have a negative impact on economic growth rates (see Table 5 and Category 5 in Figure 5).
Table 5
Countries with a negative contribution of demographics to economic growth rates
| Country |
Average
growth rates, percentage points |
Demographic
contribution to growth, percentage points |
Share
of demographic contribution to general growth, % |
| Uruguay | 1.22 | –0.01 | –0.8 % |
| Azerbaijan | 1.18 | –0.05 | –4.2 % |
| El Salvador | 1.18 | –0.05 | –4.2 % |
| The Netherlands | 1.16 | –0.07 | –6.0 % |
| Columbia | 1.14 | –0.09 | –7.9 % |
| Brazil | 0.92 | –0.11 | –12.0 % |
| Barbados | 0.95 | –0.12 | –12.6 % |
| Austria | 1.09 | –0.14 | –12.8 % |
| Singapore | 1.09 | –0.14 | –12.8 % |
| Iran | 1.05 | –0.18 | –17.1 % |
| Guyana | 1.03 | –0.2 | –19.4 % |
| Germany | 1.02 | –0.2 | –19.6 % |
| The Seychelles | 1.01 | –0.22 | –21.8 % |
| Russia | 0.99 | –0.23 | –23.2 % |
| Sri Lanka | 1.45 | –0.36 | –24.8 % |
| Georgia | 1.9 | –0.51 | –26.8 % |
| Malta | 1.08 | –0.31 | –28.7 % |
| China | 1.63 | –0.47 | –28.8 % |
| Montenegro | 1.42 | –0.41 | –28.9 % |
| Slovenia | 1.21 | –0.35 | –28.9 % |
| The Czech Republic | 0.95 | –0.28 | –29.5 % |
| Mauritius | 1.3 | –0.41 | –31.5 % |
| Belarus | 0.93 | –0.3 | –32.3 % |
| Lebanon | 0.92 | –0.31 | –33.7 % |
| Armenia | 1.71 | –0.6 | –35.1 % |
| Bosnia and Herzegovina | 1.65 | –0.6 | –36.4 % |
| Korea. Rep. | 1.13 | –0.44 | –38.9 % |
| Serbia | 1.44 | –0.57 | –39.6 % |
| Estonia | 1.19 | –0.5 | –42.0 % |
| Thailand | 1.21 | –0.52 | –43.0 % |
| Spain | 0.85 | –0.37 | –43.5 % |
| Italy | 0.71 | –0.31 | –43.7 % |
| Slovakia | 1.1 | –0.51 | –46.4 % |
| Lithuania | 1.16 | –0.54 | –46.6 % |
| St. Vincent and the Grenadines | 0.82 | –0.4 | –48.8 % |
| Trinidad and Tobago | 0.8 | –0.42 | –52.5 % |
| St. Lucia | 0.79 | –0.43 | –54.4 % |
| Grenada | 0.77 | –0.46 | –59.7 % |
| Macedonia, FYR | 0.76 | –0.47 | –61.8 % |
| Taiwan Province of China | 0.81 | –0.52 | –64.2 % |
| Latvia | 1.04 | –0.67 | –64.4 % |
| Greece | 0.68 | –0.55 | –80.9 % |
| Hungary | 0.68 | –0.55 | –80.9 % |
| Japan | 0.67 | –0.55 | –82.1 % |
| Ukraine | 0.64 | –0.58 | –90.6 % |
| Portugal | 0.63 | –0.6 | –95.2 % |
| Romania | 0.6 | –0.62 | –103.3 % |
| Croatia | 0.59 | –0.63 | –106.8 % |
| Albania | 0.52 | –0.7 | –134.6 % |
| Puerto Rico | 0.48 | –0.74 | –154.2 % |
| Bulgaria | 0.45 | –0.77 | –171.1 % |
| Poland | 0.41 | –0.81 | –197.6 % |
| Moldova | 0.24 | –0.98 | –408.3 % |
| Jamaica | 0.13 | –0.84 | –646.2 % |
Note: negative share of demographic contribution with less than –100 % means that the contribution of demographic factors is bigger than the resulted average growth rates.
Conclusion
In our forecasts, we have relied on the logic of the previous research on the Great Convergence that regarded a sufficiently high level of the human capital development and a sufficient degree of economic openness as necessary conditions for convergence, which have now been largely achieved throughout the world precisely through the globalization processes (especially in the core and the semi-periphery of the World System). However, the inclusion of the demographic projections in our forecasts allows us to emphasize an important feature of the prospective Great Convergence – it is not the semi-periphery, but rather the periphery of the World System, or the ‘bottom billion’ according to Collier, that is likely to converge particularly fast with both the core and the semi-periphery (such as the BRICS countries) thanks to a favorable demographic structure.
NOTES
* The views expressed herein are solely those of the authors. The content and results of this research should not be considered or referred to in any publications as the Bank of Russia's official position, official policy, or decisions. Any errors in this document are the responsibility of the authors.
1 World Economic Outlook Database / IMF. October 2017. Available at: https://www.imf.org/external/pubs/ft/weo/2017/02/weodata/index.aspx.
2 World Population Prospects 2017 / United Nations Department of Economic and Social Affairs. Available at: http://esa.un.org/.
REFERENCES
Acemoglu, D., and Robinson, J. A. 2012. Why Nations Fail: The Origins of Power, Prosperity, and Poverty. New York: Crown Books.
Aghion, P., and Howitt, P. W. 2009. The Economics of Growth. Cambridge, MA: MIT Press.
Barro, R. J., and Sala-i-Martin, X. 1992. Convergence. Journal of Political Economy 100 (2): 223–251.
Baldwin, R. 2017. The Great Convergence: Information Technology and the New Globalization. Cambridge, MA: Harvard University Press.
Bloom, D. E., and Canning, D. 2008. Global Demographic Change: Dimensions and Economic Significance. Population and Development Review 34 (suppl): 17–51.
Bloom, D. E., Canning, D., Fink, G., and Finlay, J. 2007. Does Age Structure Forecast Economic Growth? International Journal of Forecasting 23 (4): 569–585.
Bloom, D. E., Canning, D., Hu, L., Liu, Y., Mahal, A., and Yip, W. 2010a. The Contribution of Population Health and Demographic Change to Economic Growth in China and India. Journal of Comparative Economics 38 (1): 17–33.
Bloom, D. E., Canning, D., and Fink, G. 2010b. Implications of Population Ageing for Economic Growth. Oxford Review of Economic Policy 26 (4): 583–612.
Bloom, D. E., Canning, D., and Malaney, P. 2000. Demographic Change and Economic Growth in Asia. Population and Development Review 26 (suppl): 257–290.
Bloom, D. E., and Williamson, J. G. 2001. Demographic Transitions and Economic Miracles in Emerging Asia. World Bank Economic Review 12 (3): 419–455.
Cuaresma, J. C., Lábaj, M., and Pružinský P. 2014. Prospective Ageing and economic Growth in Europe. The Journal of the Economics of Ageing 3: 50–57.
Fougère, M., and Mérette, M. 1999. Population Ageing and Economic Growth in Seven OECD Countries. Economic Modelling 16 (3): 411–427.
Galor, O., and Weil, D. N. 1999. From Malthusian Stagnation to Modern Growth. American Economic Review 89 (2): 150–154.
Galor, O.,
and Weil, D. N. 2000. Population, Technology, and Growth: From Malthusian Stagnation
to the Demographic Transition and beyond. American Economic Review
90 (4):
806–828.
Galor, O. 2011. Unified Growth Theory. Princeton, NJ: Princeton University Press.
Gerschenkron, A. 1962. Economic Backwardness in Historical Perspective: A Book of Essays. Cambridge, MA: Belknap.
Grinin, L. E., Grinin, A. L., and Korotayev, A. 2017. Forthcoming Kondratieff wave, Cybernetic Revolution, and global ageing. Technological Forecasting and Social Change 115: 52–68.
Grinin, L., and Korotayev, A. 2015. Great Divergence and Great Convergence. A Global Perspective. Cham: Springer.
Grinin, L., and Korotayev, A. 2016. Global Population Ageing, the sixth Kondratieff Wave, and the Global Financial System. Journal of Globalization Studies 7 (2): 11–31.
Grinin, L., Korotayev, A., and Tausch, A. 2016. Economic Cycles, Crises, and the Global Periphery. Springer.
Hall, R. E., and Jones, C. I. 1999. Why do Some Countries Produce so Much More Output per Worker than Others? Quarterly Journal of Economics 114 (1): 83–116.
Korotayev, A., Bilyuga, S., and Shishkina, A. 2020. Which Countries Generate Kondratieff Waves in Global GDP Growth Rate Dynamics in the Contemporary World? Journal of Globalization Studies 11 (1): 33–63.
Korotayev, A., and de Munck, V. 2013. Advances in Development Reverse Inequality Trends. Journal of Globalization Studies 4 (1): 105–124.
Korotayev, A., Goldstone, J. A., and Zinkina, J. 2015. Phases of Global Demographic Transition Correlate with Phases of the Great Divergence and Great Convergence Technological Forecasting and Social Change 95: 163–169.
Korotayev, A., Zinkina, J. 2014. On the Structure of the Present-day Convergence. Campus-Wide Information Systems 31 (2–3): 139–152.
Korotayev, A., Zinkina, J., Bogevolnov, J., and Malkov, A. 2011. Global Unconditional Convergence among Larger Economies after 1998? Journal of Globalization Studies 2 (2): 25–61.
Kremer, M. 1993. Population Growth and Technological Change: One Million B.C. to 1990. Quarterly Journal of Economics 108 (3): 681–716.
Kuznets, S. 1960. Population Change and Aggregate Output. In Becker, G. S. (ed.), Demographic and Economic Change in Developed Countries (pp. 324–340). Princeton, NJ: Princeton University Press.
Malthus, T. 1978 [1798]. Population: The First Essay. Ann Arbor: University of Michigan Press.
Ndulu, B. J., Chakraborti, N., Lijane, L., Ramachandran, V., and Wolgin, J. 2007. Challenges of African Growth Opportunities, Constraints, and Strategic Directions. Washington, D.C.: The World Bank.
North, D. 1984. Transaction Costs, Institutions, and Economic History. Zeitschrift Für Die Gesamte Staatswissenschaft / Journal of Institutional and Theoretical Economics 140 (1): 7–17.
Solow, R. A. 1956. A Contribution to the Theory of Economic Growth. Quarterly Journal of Economics 70 (1): 65–94.
Van Der Gaag, N., and de Beer, J. 2015. From Demographic Dividend to Demographic Burden: The Impact of Population Ageing on Economic Growth in Europe. Tijdschrift voor economische en sociale geografie 106 (1): 94–109.
Wei, Z., and Hao, R. 2010. Demographic Structure and Economic Growth: Evidence from China. Journal of Comparative Economics 38 (4): 472–491.