Factors Influencing Private Participation in Public Infrastructure Projects: The South Asian Experience in the Global Context

Journal: Journal of Globalization Studies. Volume 14, Number 2 / November 2023
DOI: https://doi.org/10.30884/jogs/2023.02.06
Mohammad Taslim Uddin, University of Chittagong
Md. Nezum Uddin, International Islamic University Chittagong
Hasina Akter, International Islamic University Chittagong
This paper takes a global look at the main reasons why both public and private entities wish to collaborate on infrastructure projects in the form of public-private partnerships. It uses a cross-country panel regression for five South Asian countries between 1997 and 2018. The study finds that PPPs tend to be more common in countries with higher GDP per capita and larger market size. The study suggests that countries with rising exchange rate and countries where governments suffer from heavy external debt burdens are less likely to have PPPs. Countries with substantial foreign exchange reserves and development aid, are found to be less eager to pursue PPPs. The study provides evidence of the importance of the rule of law and control of corruption. Finally, the financial crisis of 2007–2008 is not proved to have negative effect on PPP flows to South Asian countries, manifesting their strong resilience to financial crisis shocks.
Keywords: public-private partnerships, infrastructures, South Asia.
1. Introduction
There is general agreement among diverse groups and individuals that infrastructure investment always remains the critical ingredient to enhance capital accumulation, accelerate economic growth, and achieve sustainable development. We live in a project driven world, and globalization has had a significant impact on the context in which projects are implemented (Andreev, Zinkina, and Petrovskaya 2022). Public and private stakeholders have different needs and goals, but they all need to work together to build social infrastructure that helps solve society's problems (Andreev et al. 2022). Governments in developing countries have limited budgets to build public infrastructure, and for decades the private sector has been involved in financing public infrastructure through public-private partnerships (PPPs) (Oktavianus and Mahani 2018). Compared to any other region in Asia, the South Asian region (SAR) suffers from huge infrastructure gaps. The infrastructure investment gap is equivalent to 5.7 per cent of the estimated (climate-adjusted) GDP for the five-year cycle from 2016 to 2020.1
However, economic stressors around the world continue to plague the funding capacity of countries and financial marketplaces, and the SAR is no exception. The fiscal situation, which has deteriorated since the 2008 global financial crisis, has not yet returned to pre-crisis rates in most countries, thereby restricting the discretionary ability to fund. Moreover, public debt levels in South Asia (SA) remain high and are higher than in comparator regions.2
With the exception of the People's Republic of China, the difference rises 5 per cent of estimated GDP for the remaining Asian economies. Fiscal adjustments may produce two-percent additional revenue of GDP to close the deficit by about 40 per cent for these economies. To close the remaining 60 per cent of the gap (or 3 per cent of GDP), private sector investments will need to increase from around $63 billion today to as much as $250 billion per year between 2016 and 2020.3
So far, we have had the idea that SAR governments face significant capacity constraints in meeting capital demands – both financial and technical, especially in undertaking big-ticket infrastructure projects on their own. With this backdrop, public entities continue to explore and enhance programmes for the financing and delivery of public infrastructure projects. They find private sector participation to be an easy option, and hence public-private partnerships (PPPs) are becoming fashionable for procuring public goods and services, although community attitudes strongly support universal public pro-vision of those services (Hall 2015). The availability of private financing for major infrastructure projects, in fact, allow the government a ‘buy now, pay later’ scheme with a private sector ‘mega‐credit card’ (Flinders 2005).
PPP can essentially be defined as a contract between government and private sector entities, under which the private party builds and operates some element of a public asset or service (Regan, Smith, and Love 2014). Under this contract, the private sector bears significant risk (e.g., financial risk) and responsibility, and receives performance-based remuneration over a stipulated period of time, either in the form of user fees, or payments from the public authority, or a combination of both. According to the Organisation for Economic Co-operation and Growth (OECD), this is a partnership between the government and one or more private partners that the private partners offer the service in such a manner that the goals of government service delivery are compatible with the benefits of private partners, and the effectiveness of this agreement relies on a sufficient transition of risk to private partners. The idea behind PPP is that both the public and private sectors will be better served if they share their resources, skills, and expertise (Ginsburg 2012). PPP can help the economy recover from short-term shocks and play an important role in global socioeconomic development. In global governance, which used to be the domain of states and intergovernmental organizations, public and private actors are increasingly working together (Andonova 2006). Partnership models involving private (market-based organizations) and public actors (direct regulatory agencies) in a socialization context can improve maritime governance. A stronger governance structure, such as a public-private partnership, can start to put more emphasis on partnership models to involve more people and take into account all kinds of interests (Hammer 2018). The COVID-19 outbreak has severely damaged the global tourism sector. Collaboration between private and public organizations was needed to ensure that the sector could start up smoothly, become more efficient, and gain the travelers' trust (Sunil 2021).To get more people involved in higher education, it seems important and urgent that the public and private sectors work together to come up with a better solution (Althonayan et al. 2021) To implement its cultural policies, the EU actively collaborates with private stakeholders and civil society actors (Shamkhal, Beyrak, and Ceyhun 2022).
Academics regard PPPs as the best solution for filling infrastructure gaps and addressing various growth and development issues, while others are sceptical regarding their value and efficacy. Kwak, Chih, and Ibbs (2009) advocate the PPPs as they enhance supply diversity and contestability, and such partnerships can ensure better quality infrastructure and services with optimal cost and risk allocation. They also believe that it can help close the infrastructure gap by mobilizing private sector investment and expertise. A successful PPP arrangement can: reduce government expenditures and increase fiscal receipts – resulting in a net positive fiscal impact; and improve competitiveness – creating an environment conducive to private sector involvement in basic services (energy, water, transport, health and education) to promote economic growth and development (Lammam, MacIntyre and Berechman 2013 and Van Herpen 2002). The proponents of PPPs also opine that it can transfer risk from the public to the private sector, increase competition and operational efficiency, improve the value of money, leverage private finance, expertise, and experience, create new technologies and personnel development, create new assets and upgrade deteriorating assets, increase accountability and transparency, and help overcome political and legislative conflicts.
PPPs in the SAR began in India in 1988 with the commissioning of the Gujarat Gas Company Limited, a Greenfield project – a completely new project that was not modified or upgraded – implemented on the Build-Own-Operate (BOO) basis. PPP investment in this region was very nominal until 2005 and remained relatively flat with some fluctuations, including two downturns following the Asian financial crisis (1997) and subsequent crises in Russia (1998), Brazil (1998), and Argentina (2001). Since then, PPP investments in this region increased rapidly and peaked in 2010, driven primarily by high growth in India, surprisingly, despite the global financial crisis of 2007–2008 and the European debt crisis of 2008–2009. However, they then fell sharply, perhaps, as the aftermath of the crises was felt, and started to recover gradually since 2015, a year when the oil shocks hit the global economy as a whole (World Bank PPI database).
The objective of this paper is to examine the determinants of PPPs in SA countries, where the outcome variable is the number of projects (project count) and investment (dollar value) in infrastructure projects from 1996 to 2018.
2. Literature Review
Several factors help explain the increased interest in using PPP modalities. It is widely accepted that a shortage of domestic funds to meet infrastructure gaps can delay the implementation of large projects for many years, or prevent them from being undertaken at all. The need to stay within debt and deficit limits can motivate governments to use PPPs in an effort to reduce their own direct spending or debt, thus shifting the immediate burden onto the private sector and off the government's books, and generate new user fees as an alternative to raising taxes. Such debt and deficit limits may be stipulated in international agreements, such as the Stability and Growth Pact, a binding diplomatic agreement of the European Union, or may be self-imposed via balanced budget legislation (Loxley and Loxley 2010: 28–33) or cyclical balance requirements through the fiscal ‘Golden Rule’, which states that the Government will borrow only to invest and not to fund current spending, as in the UK (McQuaid and Scherrer 2010: 30). International organizations, such as the World Bank, the International Finance Corporation (IFC), the IMF, the OECD, the Asian Development Bank, the African Development Bank, the European Investment Bank, and the UN agencies, have long been promoting this new modality, presenting it as an effective and worthy instrument for achieving economic growth, and hence it has gained momentum for sustaining the current pace of development, especially in developing countries (see UNESCAP 2011).
However, the perceptions of public and private entities regarding the factors making PPPs attractive are different. Based on a literature review, Zagozdzon (2013) inquired into the determinants of PPP implementation in the transport infrastructure sector, and proposeed three main groups of determinants: the economic theory of the government, which incorporates the macroeconomic state of the economy, the legal framework, and the capacity of public institutions.
Hammami, Ruhashyankiko and Yehoue (2006) made the first empirical attempt to examine the determinants of PPPs in infrastructure projects in developing countries, using the PPI database of the World Bank between 1990 and 2003. Their findings suggest that PPPs tend to be more common in countries with heavy external debt burdens, sizable aggregate demand and market size to allow for cost recovery, and macroeconomic stability. More PPP projects are also found to be correlated with reduced corruption, successful rule of law and previous PPP initiatives. They also highlight the beneficial role that foreign and regional organizations have played in promoting and supporting PPPs in developing countries. Using a panel of developing countries over the period from 1990 to 2008, Sharma (2012) identified that large and relatively higher income markets attract more PPPs. Macroeconomic stability, quality of regulation, and governance were also found to be important factors in determining infrastructure PPPs. Bogado (2015) identified the legal framework, public sector efficiency, and market conditions, specifically the market size, as the most relevant factors in determining PPP projects in Latin America and the Caribbean.
Basılio (2011) identified market size and purchasing power as the most critical determinants of infrastructure flows, and that the institutional environment matters mostly for the decision to invest in emerging economies. Using a panel of 48 Muslim countries for the period 2002–2011, Kasri and Wibowo (2015) identified market conditions (GDP per capita and population), institutional quality (government effectiveness, regulatory quality, and political stability), and macroeconomic conditions (M2 money supply and currency reserves in the month of import) as the most crucial factors. A study on Asian infrastructure PPPs by Hyun, Park, and Tian (2018) identified macroeconomic variables, such as economic growth and inflation, and previous PPP experience as the most relevant determinants of PPP investments.
Sanni (2016) attempted to identify the most essential factors that may influence the success of PPP projects in Nigeria. Project feedback, leadership focus, risk allocation, economic policy, effective governance, political backing, short construction time, favorable socio-economic variables, and provision of a publicly required service were found to be seven critical success variables in an exploratory factor analysis. This study suggests that if the government could focus on these key criteria during the implementation phase, PPP could have more projects.
Nataraj (2007) examined the role of PPPs as important tools for enhancing infrastructure development in South Asia. He also looked for the first time at the role of multilateral banks in promoting infrastructure in the South Asian region. His study proposes policy steps to reduce constraints to investment by the private sector in sustainable infrastructure growth in the South Asian region.
Hwang, Zhao, and Gay (2013) examine the crucial success criteria and the relevance of positive and negative elements in determining the desirability of PPP projects in Singapore. The findings of the questionnaire survey revealed that negative aspects were more affirmative than positive variables. The private sector should take up more risks than the state sector. Some risks were preferred to be shared by both partners, while others were determined by project conditions.
The elements that contributed to the success of the infrastructure development plan under the PPP scheme from 2009 to 2015 are examined by Priyarsono, Rizal, and Heny (2019). It was discovered that government support, cost-benefit analysis, and the economic sector to which the infrastructure belonged were key determinants of the success of the PPP scheme. Furthermore, government backing was considered as the most significant component among the others.
Dolla and Laishram (2020) aim to draw lessons on the variables influencing the choice of PPP in the Indian Municipal Solid Waste (MSW) sector. According to the research, PPP resulted in adverse outcomes such as failed projects, high transaction costs, and overexploitation of the private sector. As a result, deliberating on the favorable elements and finding ways to overcome the negative factors would help the public sector in effectively implementing PPP in the MSW sector and develop policies for procuring MSW projects through the PPP route.
What has been generally observed in the extant literature on the motivation for PPPs suggests that they are more common in countries where debt-burdened governments are under pressure to balance their budgets and where the purchasing power of the population and aggregate demand are fairly large, in order to encourage recovery of costs and profitability.
Due to the long duration of project phases, from start-up to completion, macroeconomic stability, particularly mild inflation and prudent money supply, is crucial for PPPs. PPPs are also more common in countries with business-friendly environment, less corruption, effective rule of law, good regulatory quality, overall government effectiveness, and long-term PPP experience.
A fairly large body of literature has been published on infrastructure PPPs, but most of it has been based on some case studies and literature reviews rather than on robust econometric studies and analysis. Although there are many assessments of PPP experiences around the world, very few have dealt with the factors affecting PPPs in the South Asian region. This paper aims to fill this gap. It also aims to shed light on the private sector motivations for maximizing the present value (PV) of its future risk-adjusted cash flows, and on public sector motivation for maximizing votes and political benefits while minimizing current budget expenditures and tax requirements. To this end, the study will compare different regression specifications based on panel data from five countries of the SAR from 1996 to 2018. The robust results of the regression analysis as well as other findings could be useful for governments in this region to guide the design and implementation of policies conducive to a sound investment environment and supportive of sustained economic growth and poverty alleviation.
3. Methodology
3.1. Data and Variables
In this study, we examine the factors affecting PPP project and investment flows in SAR countries. The empirical/regression analysis uses a panel data set covering the period from 1996 to 2018 for five4 countries in the SAR. The basic information has primarily been collected from secondary sources, including the World Bank's PPI database, the World Development Indicators (WDI), and Global Insight Business Risk and Conditions (available online at www.globalinsight.com). The PPI dataset, however, has considerable shortcomings: it only includes information on economic infrastructure in the form of ICT, energy, transport, water and sewerage, and municipal solid waste, although there has been an increasing trend of PPPs in ‘social infrastructure’ investments such as health services and education.
The theory of PPPs, studied through the lens of contract theory, can be traced back to the concept of x-efficiency proposed by Leibenstein (1966). The following Table 1 lists the potential variables affecting PPPs in the SAR.
Table 1
Variable List
|
Category |
Regressors |
Direction of impact |
|
Market |
Market size [total population (logged)] |
Positive |
|
Macroeconomic condition |
GDP per capita (lagged by 1 year) |
Positive |
|
GDP per capita growth rate (lagged by 1 year) [Higher growth is an indicator of an emerging economy] |
Positive |
|
|
Inflation rate (CPI) |
Positive |
|
|
Financial Risk |
External debt (as a percent of GNI, lagged by 1 year), |
– |
|
Exchange rate |
Negative |
|
|
Foreign exchange/currency reserve (in the month of import) |
Positive |
|
|
Money and quasi money (M2) as percent of GDP |
|
|
|
Government |
Foreign aid or ODA (current, lagged by 1 year)
|
Negative |
|
Country Risk |
Voice and accountability, |
Positive |
|
Government effectiveness |
Positive |
|
|
Regulatory quality |
– |
|
|
Rule of law |
Positive |
|
|
Control of corruption |
Positive |
|
|
Financial Crisis |
Dummy with a value of 1 for FCY till 2008 and 0 for beyond 2008 |
– |
|
Country dummies |
Bangladesh, India, Nepal, Pakistan, Sri Lanka |
– |
3.2 Econometric Model
This study surveys the impacts of different factors in determining the flows of the PPP projects, and the level of PPP investment to SA countries. However, each factor is proxied by a number of indicators, which are listed in Table 2. Based on the factors listed in Table 2, the regression model for the number of PPP project and the level of PPP investment can be specified as follows:
![]()
where, refers to the project count (number of PPP projects) or level of PPP investment, stands for the vector of independent variables listed in Table 2, is the disturbance term, is the number of parameters to be estimated, and and serve as subscripts for the cross-section and time dimension of the panel, respectively.
However, since count data (number of projects) are highly non-normal, an OLS regression of ‘project count’ cannot efficiently fit the data under consideration. On top of that, the data on outcome variable exhibits Poisson characteristics and suggests the use of Poisson regression techniques for estimating this regression; however, since there are a large number of zeros (21 zeros out of 116 observations), as evident from the histogram in Figure 1, the ordinary Poisson model might not be a good fit for the data. Hence, we favour the zero-inflated version of the Poisson (ZIP) model after performing the Vuong (1989) test.
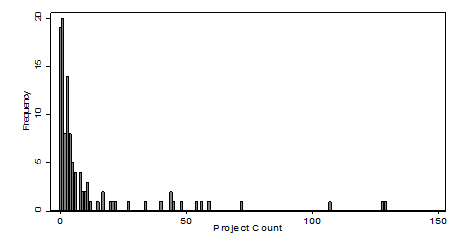
Fig. 1. Number of PPP Projects, 1997–2018
The regression of ‘PPP investment (the dollar value)’ also considers the same set of determinants that the regression of ‘project count’ considers, for which we run the lower-bound tobit regression technique because investment cannot be less than zero.
The study also recognizes and attempts to account for potential reverse causality, which might result in inconsistent parameter estimates. For example, we suspect the presence of endogeneity between PPP investment and a subset of explanatory variables such as GDP, GDP growth, and so on. Most econometric specifications dealing with GDP and investments usually suffer from endogeneity (Moszoro et al. 2015). Applying simultaneous equation techniques can help address this issue. Alternatively, lagged values can be considered for potentially endogenous variables, since their past values cannot be affected by the current level of PPP investments. The latter approach was adopted here.
Finally, recognizing that the motivation for engaging in PPPs may differ across time and region, the study extends each of the regressions by controlling for country dummies as well as time factors in order to see the region and time-specific impacts on PPPs.
4. Empirical Findings and Discussion
The regression results of the PPP determinants (number of PPP ventures and amount of PPP investment) in developing countries are presented in Tables 2 and 3. The analysis uses the same explanatory factors, as shown earlier, with all specifications focused on the number of PPP projects and the level of PPP investment.
А. Number of PPP projects/ project counts.
Table 2 presents the regression results on the number of PPP projects. As indicated earlier, since the count data are highly non-normal and because the dataset contains a large number of zeros, the study uses the ZIP regression model, after failing to reject the hypothesis in favour of fit of the ZIP regression performed by the Vuong (1989) test. There are four versions of the regression of the ‘project count’ variable. Model 1 is the baseline model, which incorporates all the variables of interest except the country and financial crisis dummies, while Model 2 adds the financial crisis dummy added. Model 3 and 4 extended Model 1 and Model 2, respectively, with country dummies incorporated.
Table 2
ZIP Regression of Projects Count
Regressors |
Model 1 |
Model 2 |
Model 3 |
Model 4 |
|
|
Coefficient (Standard |
Coefficient (Standard |
Coefficient (Standard |
Coefficient (Standard |
||
|
Population |
1.24e–09*** (4.62e–10) |
1.50e–09*** (4.65e–10) |
3.05e–09 (2.85e–09) |
3.19e–09 (2.84e–09) |
|
|
GDP per capita (lagged one year) |
0.0003894*** (0.0000738) |
0.0003014*** (0.0000767) |
0.0004377** (0.0001732) |
0.0002037 (0.000179) |
|
|
GDP per capita growth rate (lagged one year) |
0.0037328 (0.023495) |
0.0389999 (0.0247455) |
0.0140285 (0.0255419) |
0.0691666** (0.0289654) |
|
|
Inflation |
0.0011296 (0.0164377) |
0.0015385 (0.0165859) |
0.0085195 (0.0186033) |
0.0077374 (0.0189772) |
|
|
External Debt (% of GDP) |
–0.0429008*** (0.0114076) |
–0.034749*** (0.0113909) |
–0.042672*** (0.0125383) |
–0.034345*** (0.0126339) |
|
|
Exchange Rate |
–0.0178702*** (0.0066697) |
–0.0219376*** (0.0066306) |
–0.0168859** (0.0074496) |
–0.0166017** (0.0072687) |
|
|
Currency Reserve |
–0.0762125*** (0.0275907) |
–0.0664253** (0.0277398) |
–0.0514652* (0.0300331) |
–0.0433127 (0.0300224) |
|
|
M2 |
0.0178703** (0.0074412) |
0.0088359 (0.0080166) |
–0.0031327 (0.0105144) |
–0.003912 (0.0109687) |
|
|
ODA |
–7.30e–11 (6.22e–11) |
–1.96e–10*** (6.98e–11) |
–8.65e–11 (6.57e–11) |
–2.60e–10*** (7.93e–11) |
|
|
Voice and accountability |
–0.6899762 (1.132339) |
–1.565516 (1.165307) |
–0.6814839 (1.382763) |
–.4826415 (1.41327) |
|
|
Government effectiveness |
–2.966309** (1.527588) |
–1.031516 (1.61284) |
–2.1907 (1.938407) |
–1.049928 (1.965938) |
|
|
Regulatory quality |
0.1894523 (1.653934) |
–0.5873891 (1.658416) |
1.207458 (2.329811) |
–0.0701598 (2.354226) |
|
|
Rule of law |
1.716427* (0.9553884) |
2.020025** (0.9707889) |
2.815015** (1.586529) |
3.593461** (1.624621) |
|
|
Control of corruption |
1.865522** (0.7774591) |
1.411615 (0.7810311) |
2.722113*** (0.9471569) |
2.462629*** (0.9616905) |
|
|
Financial crisis dummy |
– |
0.5293475 (0.1339328) |
– |
0.5957518*** (0.1527134) |
|
|
Country dummy (reference category: Bangladesh) |
India |
– |
– |
–2.631514 (2.28474) |
–2.567484 (2.265266) |
|
Nepal |
– |
– |
–.1245625 (0.7232361) |
–0.2599689 (0.7238063) |
|
|
Pakistan |
– |
– |
–0.472842 (0.3936742) |
0.1517814 (0.4264538) |
|
|
Sri Lanka |
– |
– |
–1.350396 (1.495165) |
–0.7631105 (1.495141) |
|
|
Constant |
2.0563** (0.8636954) |
3.08728*** (0.8932397) |
1.524564 (1.192213) |
1.84252 (1.203228) |
|
|
Vuong test of ZIP vs. standard Poisson |
z = 4.61 with Pr>z = 0.0000 |
z = 4.32 with Pr>z = 0.0000 |
z = 4.83 with Pr>z = 0.0000 |
z = 4.47 with Pr>z = 0.0000 |
|
Note: Figures parentheses indicate standard errors.
Each of the four model specifications produces relatively consistent results. All support the hypothesis that market size, proxied by population, has a strong positive impact on the number of PPP projects. This result sheds light on the motivation of private firms for a guaranteed rate of return that may be higher than the government's bond rate, which may also imply that PPP arrangements, in effect, serve an opportunity for private profits at the expense of the public (taxpayers).
The result also demonstrates that GDP per capita has a significant positive affect on the number of PPPs. That is, higher purchasing power, with its high demand for infrastructure, attracts more PPPs, indicating a central motivation for private investors to secure financial gains.
As hypothesized, both external debt and exchange rate are found to negatively affect PPP projects in all model specifications. Of course, the impact of external debt can be either positive, as found in Hammami, Ruhashyankiko and Yehoue (2006), or negative, as found in this study.
Governments burdened with high levels of external debt tend to choose PPP options more frequently to build infrastructure, but private investors view these countries as unsafe for their investment. In such circumstances, if the public sector's eagerness and actions to attract investment overcome the private sector's disincentives, external debt would have a positive effect on PPPs; however, the effect will be negative if the private sector's incentive for avoiding partnership with heavily debt-burdened governments is the determining factor, and the results of this study support the latter.
However, the negative exchange rate impact is straightforward because the PPP project revenues and costs are usually denominated in different currencies. While project financing is usually denominated in US dollars or other hard currencies, the projects typically generate revenues in local currencies. As a result, exchange rate depreciation may result in low revenues that are insufficient to cover project costs. For example, the real impact of this kind of risk was seen, for example, in the past 1997 Asian crisis, when the sharp depreciation of the Indonesian Rupiah pushed many PDAMs to the verge of bankruptcy, as the crisis aggravated weak management, poor financial discipline, and deteriorating network systems (Khrisna and Pangeran 2010).
Contrary to the hypothesis, we found international liquidity/ foreign exchange reserves to exert significant negative impact in all model specifications. The result is not surprising: when foreign exchange reserves increase, the host country can use them to finance infrastructure projects, hence less dependence on PPP arrangements, as was the case in India during the 1990s (Singh 2006). On the other hand, in line with the hypothesis, foreign aid or ODA appears to have negative effects on PPPs, but only in models where a financial crisis dummy has been captured. This implies that countries receiving an exogenous rent in terms of aid or ODI are less likely to rely on PPPs.
While M2 money, an indicator of financial crisis, is found to affect positively PPP projects in our baseline model (Model 1), the institutional quality in terms of government effectiveness, an indicator of country risk, displays a significance negative impact on PPP projects in the same model. The explanation for positive impacts would be relatively straightforward. However, a negative impact can also be understood intuitively if we consider it from the perspective of the political economy of corruption: the more effective a government is, the less chance there will be for investors to engage in corruption to increase their economic profits. Hence, investors with the intention to make money by any means, including corruption, will refrain from investing in new projects, and so government effectiveness will have a negative effect on PPPs. On the other hand, the rule of law and control of corruption, two other indicators of country risk, are found to have a highly significant positive impact on PPPs, as expected.
The financial crisis dummy appears here with a positive sign, indicating that PPP project flows increased in SA countries after 2008. This implies that PPPs have miraculously acted as a counter-cyclical tool in SA, while they have been very pro-cyclical in other countries around the world. While the number of projects has declined elsewhere and especially so in Sub-Saharan Africa, East Asia and the Pacific and Europe and Central Asia, it has increased sharply in South Asia. For example, according to the World Bank report (December 2008), of 173 projects valued at $120 billion surveyed by the World Bank, 6 projects worth $6.3 billion were cancelled or at risk of cancellation, and some 99 projects worth US$82 billion were reported to be delayed or at risk of delay. On the other hand, over the same period, SA has shown strong resilience to the global financial crisis.
The main insights of this empirical study on the number of PPP projects can be summarized as follows. Countries with large markets, higher purchasing power and high demand for infrastructure tend to have more PPPs. Currency depreciation discourages investors from investing in new projects. Governments burdened with high levels of external debt struggle to attract more PPP projects, although they tend to rely on the PPP option more frequently for building infrastructure. Finally, the rule of law and control of corruption are also the significant factors for attracting more PPPs. The analysis now turns to the regression of PPP investment.
B. Investment in PPP Projects
Table 3 represents the tobit regression of PPP investment, measured as the dollar value of PPP projects, which is regressed against the same determinants as used for the regression discussed above.
Table 3
Tobit Regression of Investment
|
Regressors |
Model 1 |
Model 2 |
Model 3 |
Model 4 |
|
|
Coefficient (Standard |
Coefficient (Standard |
Coefficient (Standard |
Coefficient (Standard |
||
|
Population |
3.09e–06 (6.79e–06) |
4.05e–06 (6.51e–06) |
0.0001316*** (0.0000312) |
0.0001465*** (0.0000316) |
|
|
GDP per capita (lagged one year) |
1.022007 (0.9315774) |
0.547647 (0.9105767) |
0.2566672 (1.789185) |
–1.500381 (1.995478) |
|
|
GDP per capita growth rate (lagged one year) |
419.8094 (433.0958) |
597.0475 (420.8964) |
137.2791 (370.1756) |
404.5677 (389.8004) |
|
|
Inflation |
232.3361 (239.3865) |
331.2486 (233.934) |
270.3196 (188.5498) |
311.6766* (185.8601) |
|
|
External Debt (% of GDP) |
111.3628 (131.6194) |
181.8386 (128.638) |
–3.162734 (106.8642) |
26.11664 (105.7231) |
|
|
Exchange Rate |
–117.4792 (87.41705) |
–165.2537* (85.6075) |
–132.9818 (81.34983) |
–126.6653 (79.80674) |
|
|
Currency Reserve |
–134.9097 (560.5421) |
12.32881 (539.5956) |
–42.17296 (447.3393) |
93.17982 (443.0941) |
|
|
M2 |
208.8156* (107.702) |
127.6895 (108.7031) |
–24.36343 (97.08958) |
–75.06361 (98.84744) |
|
|
ODA |
3.79e–06*** (1.42e–06) |
2.94e–06** (1.40e–06) |
4.13e–06*** (1.36e–06) |
3.35e–06** (1.39e–06) |
|
|
Voice and accountability |
4137.425 (13798.29) |
3167.602 (13213.32) |
2697.201 (12357.16) |
6428.152 (12225.66) |
|
|
Government effectiveness |
–18164.61 (28931.54) |
–9269.885 (27931.11) |
30018.4 (24979.67) |
37296.68 (24758.03) |
|
|
Regulatory quality |
10897.35 (22681.14) |
8008.92 (21700.49) |
–21317.06 (23257.58) |
–32069.43 (23472.29) |
|
|
Rule of law |
16544.09 (13755.03) |
15912.06 (13044.23) |
–18900.61 (18663.64) |
–26771.5 (18776.79) |
|
|
Control of corruption |
–6823.802 (10708.19) |
–8397.082 (10331.2) |
–4012.359 (9244.254) |
–4438.274 (9070.946) |
|
|
Financial crisis dummy |
|
5595.528** (2293.086) |
|
3919.961* (2097.46) |
|
|
Country dummy (reference category: Bangladesh) |
India |
|
|
–117331.7*** (25137.37) |
–126926.1*** (25134.96) |
|
|
Nepal |
|
|
23886.3*** (7780.767) |
26834.12*** (7788.315) |
|
|
Pakistan |
|
|
–4686.68 (4160.754) |
–669.3621 (4607.149) |
|
|
Sri Lanka |
|
|
27543.39* (15563.71) |
38047.69** (16270.28) |
|
Constant |
–21833.56* (11914.81) |
–13570.77 (11852.14) |
–14093.65 (10850.32) |
–7166.447 (11193.19) |
|
Note: Figures parentheses indicate standard errors.
The regression result indicates that while the market size is not significant in the first two models, it is found to have a highly significant positive effect on PPP investment in Model 3 and Model 4, which incorporate the country-specific effects. Foreign aid or ODA emerges as the most relevant factor in attracting investment in PPPs, implying that investors feel safe where a country's fiscal capacity is strong because of increased foreign aid to the country.
Consistent with the regression of project count, the financial crisis dummy has some positive significance, at a level of 5 per cent in Model 2 and at 10 per cent in Model 4, in affecting PPP investment. Concerning the country dummies, the results suggest that the coefficient for India is negative, implying that (compared to Bangladesh, the reference category) the PPP investment was in decline during the sample period. On the other hand, the PPP investment in Nepal and Sri Lanka increased (compared to Bangladesh) over same period.
Regarding other variables, they are not found to be significant, perhaps due to the fact after a project has already been implemented, these variables do not have any significance in determining the level of PPP investment.
5. Conclusion
High quality infrastructure is important not only for faster economic growth, but also to ensure poverty alleviation and the reduction of inequality, which can be achieved by inclusive growth, meaning that the benefits of growth are shared by a majority of the population. Yet, the infrastructure in SA countries is incommensurate with the need. Despite a recent increase in private sector participation in infrastructure financing in SA countries, private finance continues to provide only a small portion of aggregate infrastructure investment in these countries. Of course, there are diverse and dissenting opinions among economists and politicians regarding the most appropriate form of infrastructure financing: traditional public procurement, pure privatization, PPIs, or PPPs? This study focuses on the PPP mechanism and investigates the nature and significance of potential determinants of the number of projects and investment, with a view to understanding public and private sector motives for entering into PPPs. The findings of this empirical study can play an important role in determining the factors of PPPs in infrastructure development globally in the light of the experience of SA countries.
The empirical evidence suggests that private involvement in delivering and maintaining public infrastructure is primarily determined by the macroeconomic and financial conditions, which strongly hints at the profit seeking behaviour of public-private collaboration. Large and high-income economies are found to attract more PPPs compared to small and/or low-income countries, again reinforcing the notion of a profit motive for private participation. The direction of influence of other variables, such as aid flows to recipient countries, in determining PPP investment corroborates the claim that PPPs are indeed new mechanisms for achieving the controversial goal of privatization to benefit the corporate sector at the expense of taxpayers' resources. In other words, PPPs are in effect an alternative tool for redistributing public assets to private companies. If so, the use of PPPs to leverage private sector financing and expertise to help weaker economies achieve the UN's Sustainable Development Goals remains highly controversial. And this analysis raises the suspicion that such private participation may actually reduce economic efficiency through poor allocation of resources, reduced real wealth creation, increased tax burdens, lost government revenues, and increased income inequality. In this era of globalization, these findings will also serve as a guide in the planning of the world's governments.
It is absolutely critical, therefore, that before pursuing PPPs, governments should carefully evaluate them to ascertain whether or not they meet the claims made for them by their proponents. A Keynesian approach provides a useful framework for governments to use when negotiating contracts with potential partners that prioritize the interests of their citizens over the profits of private partners (Chavez 2017). From a public policy perspective, the prime objective of a PPP should be to achieve an improvement in the quality and efficiency of a given service for citizens and allow public money be diverted into other critical areas while alleviating long-term pressure on public finances (Jomo et al. 2016). However, in many cases, these gains have not been realized, and the performance and viability of PPPs varies greatly across activities and sectors (Ibid.). So, when it is necessary to undertake a PPP project, it is imperative for countries to have the institutional ability to create an enabling environment, channel the PPP towards the desired goals, and critically evaluate it, especially in relation to other possible sources of funding that may offer a superior option to the PPP and to conventional ways of delivering services and infrastructure.
NOTES
1 Estimated infrastructure investments and gaps, 25 DMCs, 2016–2020 ($ billion in 2015 prices) ADB (2016a); Country sources; Investment and Capital Stock Dataset, 1960–2015, IMF; Private.
2 South Asia Regional Update, August 2019 South Asia: Shifting Outlook Calls For Steadfast Reforms.
3 https://www.adb.org/publications/asia-infrastructure-needs.
4 Due to severe data limitations, Afghanistan, Maldives, and Bhutan were excluded from the regression analysis.
REFERENCES
Althonayan, A., Tarasova, E. E., and Isaenko, E. V. 2021. The Role of Higher Educational Institutions in the Implementation of UN Sustainable Development Goals (SDGs). In Grinin, L. E., Ilyin, I. V., and Korotayev, A. V. (eds.), Globalistics and Globalization Studies: Current and Future Trends in the Big History Perspective (pp. 217–227). Volgograd: ‘Uchitel’ Publishing House.
Andonova, L. B. 2006. Globalization, Agency, and Institutional Innovation: The Rise of Public-Private Partnerships in Global Governance. Goldfarb Center Working Paper No. 2006-004.
Andreev, A. I., Zinkina, J. V., and Petrovskaya, I. G. 2022. Globalization Impact on Project Management. Journal of Globalization Studies 13 (1): 60–72.
Basılio, M., 2011. Infrastructure PPP Investments in Emerging Markets. URL: http://www.efmaefm.org/0EFMAMEETINGS/EFMA%20ANNUAL%20MEETINGS/2011-Braga/pa-pers/0337_update.pdf.
Bogado, C.M.M., 2015. Determinants of Infrastructure Investment through Public-Private Partnership in Latin America and the Caribbean. Final Thesis. URL:
http://www.stp.gov.py/v1/wp-content/uploads/2017/04/Final-Thesis.pdf. Accessed April 10, 2019.
Chavez, K., 2017. Public-Private Partnerships from a Neoclassical and Keynesian Political Economy Perspective. URL:
http://www.ssa.uchicago.edu/sites/default/files/uploads/AdvocatesForum_2017_PublicPri vatePartnerships.pdf. Accessed April 12, 2019.
Dolla, T., and Laishram, B. 2020. Factors Affecting Public-Private Partnership Preference in Indian Municipal Waste Sector. International Journal of Construction Management 20 (6): 567–584.
Flinders, M., 2005. The Politics of Public–Private Partnerships. The British Journal of Politics and International Relations 7 (2): 215–239. URL: https://journals.sagepub.com/doi/pdf/10.1111/j.1467-856X.2004.00161.x
Ginsburg, M. 2012. Public Private Partnerships, Neoliberal Globalization and Democra-tization. In Robertson, S., Mundy, K., Verger, A., and Menashy, F. (eds.), Public Private Partnerships in Education: New Actors and Modes of Governance in a Globalizing World (pp. 63–78). Cheltenham: Edward Elgar Publishing.
Hall, D., 2015. Why Public-Private Partnerships don't Work: The Many Advantages of the Public Alternative. Public Services International.
Hammer, L. 2018. The ‘Socialization’ of Maritime Global Governance and Taiwan: Perceiving the Benefits. Journal of Globalization Studies 9 (1): 20–37.
Hammami, M., Ruhashyankiko, J.-F., and Yehoue, E. B. 2006. Determinants of Public-Private Partnerships in Infrastructure. IMF Working Paper WP/06/99. IMF Institute. URL: https://www.imf.org/external/pubs/ft/wp/2006/wp0699.pdf.
Hyun, S., Park, D. and Tian, G. 2018. Determinants of Public–Private Partnerships in Infrastructure in Asia: Implications for Capital Market Development. Asian Development Bank Economics Working Paper Series 552. URL: https://www.adb.org/sites/default/files/publication/438966/ewp-552-ppps-infrastructure-asia-capital-market.pdf.
Hwang, B.-G., Zhao, X., and Gay, M. J. S. 2013. Public Private Partnership Projects in Singapore: Factors, Critical Risks and Preferred Risk Allocation from the Perspective of Contractors. International Journal of Project Management 31(3): 424–433.
Kasri, R. A., and Wibowo, F. A. 2015. Determinants of Public-Private Partnerships in Infrastructure Provision: Evidence from Muslim Developing Countries. Journal of Economic Cooperation & Development 36 (2): 1–34. URL: http://www.sesric.org/pdf.php?file=ART14032702-2.pdf.
Kwak, Y. H., Chih, Y., and Ibbs, C. W. 2009. Towards a Comprehensive Understanding of Public Private Partnerships for Infrastructure Development. California Management Review 51 (2): 51–78. URL: https://journals.sagepub.com/doi/pdf/10.2307/41166480?casa_token=fapZ8BVoXLAAAAAA:RfL1yIPoS4-vleXtsXXiYbsZNc7vHUccB81XBvE01jbV uHi2O1dkv_WIb4cHpUVIH0Onfkg1KwDQ.
Khrisna, S. P., and Pangeran, M. H. 2010. Important Risks on Public-Private Partnership Scheme in Water Supply Investment in Indonesia. Group of Construction Management. URL: https://www.researchgate.net/publication/255621913_Important_Risk_on_Public-Private_Partnership_Sche....
Lammam, C., MacIntyre, H., and Berechman, J., 2013. Using Public-Private Partnerships to Improve Transportation Infrastructure in Canada. Fraser Institute Studies in Economic Prosperity. URL: https://www.fraserinstitute.org/sites/default/files/using-public-private-partnerships-to-improve-transportation-infrastructure-in-canada-rev.pdf. Accessed August 23, 2017.
Leibenstein, H. 1966. Allocative Efficiency vs. ‘X-efficiency’. The American Economic Review 56 (3): 392–415. URL:
https://wolfweb.unr.edu/homepage/pingle/Teaching/BADM%20791/Week%209%20Behavioral%20Microeconomics/Leibenstein%20X-Efficien-cy.pdf.
Loxley, J. and Loxley, S., 2010. Public Service, Private Profits: The Political Economy of Public-Private Partnerships in Canada. Fernwood Pub.
McQuaid, R. W., and Scherrer, W. 2010. Changing Reasons for Public–Private Partnerships (PPPs). Public Money & Management 30 (1): 27–34. URL:
https://www.researchgate.net/profile/Walter_Scherrer/publication/232969950_Changing_reasons_for_public-private_partnerships_PPPs/links/56eb436908ae9dcdd82a9d15/Changing-reasons-for-public-pri-vate-partnerships-PPPs.pdf.
Moszoro, M. W., Araya, G., Ruiz Nunez, F., and Schwartz, J., 2015. Institutional and Political Determinants of Private Participation in Infrastructure. Available at SSRN 2508 474. URL: https://www.econstor.eu/bitstream/10419/109166/1/818310596.pdf.
Nataraj, G., 2007. Infrastructure Challenges in South Asia: The Role of Public-Private Partnerships. ADB Institute Discussion Papers No. 80.
Oktavianus, A., and Mahani, I. 2018. A Global Review of Public Private Partnerships Trends and Challenges for Social Infrastructure. Paper presented at the MATEC Web of Conferences.
Priyarsono, D. S., Rizal, R. M., and Heny, K. 2019. The Success Factors of Public Private Partnership Implementation for Infrastructures Development: New Evidence from theIndonesian Experience. Paper presented at the 3rd International Conference on Indonesian Social & Political Enquiries (ICISPE 2018). Atlantis Press, pp. 64–67.
Regan, M., Smith, J., and Love, P. 2014. Assessing Risk in Infrastructure Public Private Partnerships. In Proceedings of the DII–2014 International Conference on Infrastructure Development and Investment Strategies 25-26 September 2014. Livingstone, Zambia (pp. 177–190). URL: https://pure.bond.edu.au/ws/portalfiles/portal/14127837/0980029837.pdf.
Sanni, A. O. 2016. Factors Determining the Success of Public Private Partnership Projects in Nigeria. Construction Economics and Building 16 (2): 42–55.
Shamkhal, A., Beyrak, H., and Ceyhun, M. 2022. A Globalization Project in Practice? The EU's Cultural And Educational Activities in Azerbaijan in the Framework of the Eastern Partnership Programme. Journal of Globalization Studies 13 (1): 3–19.
Sharma, C. 2012. Determinants of PPP in Infrastructure in Developing Economies. Transforming Government: People, Process and Policy. URL:
https://www.emeraldinsight.com/doi/full/10.1108/17506161211246908. Accessed April 10, 2019.
Singh, C. 2006. Should India Use Foreign Exchange Reserves to Finance Infrastructure? Eco-nomic and Political Weekly 41 (6): 517–525.
Sunil, K. 2021. The Outbreak of SARS-COV-2 (Covid-19): Impact on International Tourism. Journal of Globalization Studies 12 (1): 145–158.
UNESCAP. 2011. A Guidebook on Public-Private Partnership in Infrastructure. United Nations. URL: http://www.unescap.org/ttdw/common/TPT/PPP/text/ppp_guidebook.pdf.
Van Herpen, G. W. E. B. 2002. Public Private Partnerships, the Advantages and Disadvantages Examined. Publication of Association for European Transport.
Vuong, Q. H. 1989. Likelihood Ratio Tests for Model Selection and Non-Nested Hypotheses. Econometrica 57 (2): 307–333. URL: https://www.jstor.org/stable/1912557.
Zagozdzon, B. 2013. Determinants of Implementation of Public-Private Partnership in Poland: The Case of Transport Infrastructure. Advances in Economics and Business 1 (2): 57–71. doi: 10.13189/aeb.2013.010203002E.