Power and Size: Urban and Polity Size Swings and Changes in the Distribution of Power among States in Interstate Systems since the Bronze Age

Journal: Social Evolution & History. Volume 16, Number 2 / September 2017
ABSTRACT
This study examines the temporal relationships between the growth and decline of cities and states and changes in the distribution of power among states in five whole interstate systems (world-systems) since 2700 BCE. World historians have long recognized that the population sizes of settlements and the territorial sizes of polities both increase over time and go through cyclical growth and decline phases. Earlier studies have found that urban and polity upsweeps (large increases in scale) are correlated in time. But the number of these instances of large-scale change (upsweeps) is few. More numerous are the smaller upswings in which the sizes of the largest city or polity increase but do not become significantly larger than earlier increases. Sweeps are large changes and swings are smaller changes. In this paper we will study these more numerous urban and polity swings in five political-military interaction networks (PMNs) in which we have enough size estimates to study changes in the sizes of the largest cities and empires. We will compare swings with sweeps to see if there are patterned differences. The political military networks or interstate systems that we will study are those located and centered in Mesopotamia, Egypt, East Asia, South Asia and the expanding Central PMN1 since 1500 BCE.2 Thus, the main unit of analysis in this paper is the political/military interaction network. We will study the relationships across time between city and empire growth and decline in each of these interstate networks and we will examine the relationships between these and changes in the power configuration of these same systems. Interstate power configurations vary from decentralized to centralized based on the relative sizes and power of the in-teracting states in each system. We will also discuss such potential causes of upswings and upsweeps as demographic change, warfare and trade. And we will consider whether or not the causes of downswings are different from the causes of upswings.
In earlier work (Inoue et al. 2012, 2015) we have identified big changes in the sizes of the largest settlements and polities in political-military interaction networks (PMNs) and world regions, which we call sweeps. An upsweep is an increase in size that is at least one-third larger than the size of the three earlier size peaks. But these upsweeps are somewhat rare. We found a total of eighteen urban upsweeps in the five PMNs studied (Inoue et al. 2015: Table 7) while there were thirty-six upswings. And we found only five urban downsweeps,3 while there were thirty-two downswings (Inoue et al. 2015: Table 8). Regarding polity size changes, we found twenty-two upsweeps and fifty-nine upswings (Inoue et al. 2012: Table 1); and nineteen downsweeps versus fifty-eight downswings (Inoue et al. 2012: Table 2). The questions we are asking in this paper, which uses whole interpolity systemic networks as the unit of analysis, are: what are the causal relationships between changes in the sizes of largest cities and empires? Does empire growth cause city growth? Does city growth cause empire growth? And what are the other causes of these size changes? Our earlier work identifies and focusses on large-scale changes (sweeps) because it is these large changes that constitute the instances that account for the long-term trends toward larger settlements and larger polities. But we also would like to know the patterns and causes of smaller scale changes, and so this paper will analyze swings and compare them with sweeps.
We use the comparative evolutionary world-systems perspective (Chase-Dunn and Hall 1997; Chase-Dunn 2014; Chase-Dunn and Lerro 2014; Hall 2014) to study and compare relatively small regional world-systems4 with larger continental and global systems in order to study sociocultural evolution. The concepts of the world-system perspective as developed by Immanuel Wallerstein and others have been broadened to be useful for the analysis of pre-capitalist economic systems, including stateless regional systems. Thus we must be able to abstract from scale in order to examine changes in the structural patterns of small, medium and large whole human interaction networks. But in this article we focus on medium-term change in the scale of settlements and polities.5
In the long run human settlements have tended to get larger, but our research focuses on medium-term sequences of growth and decline in order to identify those upward sweeps (upsweeps) in which the scale significantly increased. Accurate identification of these events will facilitate our understanding of sociocultural evolution because these are the events that were an important part of the long-term trend toward larger and more complex human social institutions.6
World-systems are interacting sets of polities7 and settlements. And many, but not all, world-systems are organized as core/ periphery hierarchies in which some polities exploit and dominate the populations of other polities. Semiperipherality is an intermediate position within such a core/periphery hierarchy. When we study whole interstate systems we see that they all oscillate in what we call a normal cycle of growth and decline (see Fig. 1). The largest settlement or polity in each region reaches a peak size and then declines and then this or another settlement or polity returns to the peak size again. These cycles are usually not observed by looking at single settlements or polities in isolation, but rather by looking at the largest settlement or polity within each region of interaction.8
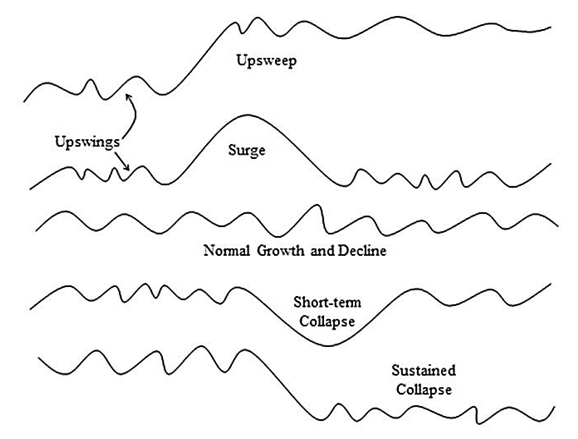
Fig. 1. Types of Medium-term Scale Change in the Largest Settlements or Polities in an Interacting Set of Polities
In Fig. 1 the normal cycle of growth and decline is half way down the figure and is labeled ‘normal growth and decline’. At the top of Fig. 1 is a depiction of an upward sweep (upsweep) in which the size of the largest settlement or polity increases significantly. When an upward movement is sustained and a higher level of scale becomes the new normal we call this an ‘upward sweep’ or an ‘upsweep’. We define an upsweep as a peak that is more than one-third higher than the average of the three immediately earlier peaks.9 We distinguish between an ‘upswing’, which is any upturn in a growth/decline sequence, and an upsweep, which goes to a level that is more than one-third higher than the average of three prior peaks. When an upsweep is temporary and returns to the old lower norm we call it an ‘upsurge’ (see the 2nd line from the top in Fig. 1). We also distinguish between four hypothetical types of decline: a ‘normal’ downswing that is part of the normal growth and decline sequence, a downsweep in which the decline goes significantly below what had been established as the normal trough, a sustained collapse in which the new lower scale becomes the norm for at least two further cycles, and a downsurge in which a large decline is the result of the collapse of an upsurge. Sweeps are large changes and swings are any up or down.
MODELING THE CAUSES OF POLITY AND SETTLEMENT SCALE CHANGES
Our earlier research has shown that about half of the upsweeps of polity and settlement sizes were associated with the actions of non-core marcher states (Inoue et al. 2016). This confirms our hypothesis that core/periphery relations and uneven development are important for explaining the emergence of complexity and hierarchy in world-systems, but it also shows that a significant portion of upsweeps were not associated with the actions of non-core marcher states. We are developing a multilevel model (Chase-Dunn and Inoue 2017) that combines interpolity dynamics with the ‘secular cycle’ model developed by Turchin and Nefedov (2009). This study of upswings will help us determine the nature of the relationships across different PMNs between urban and polity scale changes. To what extent is the timing of urban and polity upswings correlated? Since both go up over the long run, we seek to determine their medium run relationship by calculating partial correlations that control out the long-term trend by controlling for year as an independent variable. We also examine the graphs that show the track of largest city and polity sizes together for each PMN. In order to correlate urban and polity sizes we needed to produce time series of the two that have the same time points. This was done by using the estimates we had to calculate linear interpolations at time points every fifty years. So our estimates are for fifty-year intervals.
UNITS OF ANALYSIS
Our approach to the spatial bounding of the unit of analysis is very different from those who try to comprehend a single global system that has existed for thousands of years. Gerhard Lenski (2005), Andre Gunder Frank and Barry Gills (1994), George Modelski (2003; Modelski, Devezas, and Thompson 2008) and Sing Chew (2001, 2007) all analyze the entire globe as a single system over the past several thousand years. We contend that this approach misses very important differences in the nature and timing of the development of complexity and hierarchy in different world regions. Combining apples and oranges into a single global bowl of fruit is a major mistake that makes it more difficult to both describe and explain social change. Our comparison of different world regions and interaction networks of polities makes it possible to discover both their similarities and the differences. Global comparisons among these regional systems are certainly appropriate, but the claim that there has always been a single global world-system is profoundly misleading.
In this paper we use Political-Military networks as the unit of analysis (see Chase-Dunn and Jorgenson 2003). These are composed of states and empires that are making wars and alliances with one another. David Wilkinson has carefully studied the spatial boundaries of these interstate systems and we follow his lead in delineating them (Wilkinson 2017). Following Wilkinson's (1987) specifications, the timings of the incorporation of smaller PMNs into the Central PMN are as follows: Egyptian and Mesopotamian PMNs merged to form the Central PMN in 1500 BCE; Europe was engulfed by the Central PMN in 500 BCE; South Asia was engulfed into the Central PMN in 1000 CE and East Asia was engulfed into the Central PMN in 1830 CE.10
ESTIMATING THE POPULATION SIZES OF CITIES
We use Tertius Chandler (1987), George Modelski (2003), and Ian Morris (2010) as the main sources for city population size estimates. Morris reviews the debate among demographers and urbanists about the definitions of urban spatial boundaries and the reliability of census data (Morris 2010: 107). In his work, the premodern period's settlement size estimates are based on archaeological evidence of their areal size and historical records (Morris 2010: 108). For modern cities he uses definition and estimates from the Economist Pocket World in Figures, which bounds cities as urban agglomerations comprising a contiguous built-up area (Economist 2008: 23).
Modelski regards cities as ‘the central places of area-wide interactions; they facilitate the operation of the system, and in turn depend upon its support’ (Modelski 2003: 4). He argues that cities are ‘a manifestation of the growth of institutions capable of organizing vast regions into integrated systems’ (he uses Richard Blanton's definition, which is the urban agglomeration) (Modelski 2003: 4).
Chandler's (1987) data compendium uses various proxies to estimate city populations such as the number of households, the number of solders, estimates of areal population density, and more. Chandler's definition includes the resident population of the city and surrounding suburban or urbanized areas. His estimates of city population sizes have been criticized due to his rough approximations using the several proxies without rigorously relying on archaeological evidence (Smith 2016).
From the comparisons of these three data sources, we have found that Morris's estimates are overall conservative in contrast to Modelski's estimates. Morris compiled his largest city size data using multiple data sources. He selects what he considers to be the best of the estimates among them, yet he is aware of the fact that the use of a single data source (e.g., only using Modelski's data) makes it easier to amend errors since it provides more consistent errors compared with using multiple sources (Morris 2010: 108). We compiled our estimates in a similar manner as Morris and followed the comprehensive approach developed by Daniel Pasciuti (2002). In our data compendium of city population estimates archived at IROWS (2017), we include all the estimates from all the sources, but in this research, we used what we have judged to be the best estimate from the three sources and supplemented with other sources from archaeology and history. For most of the time, the priority is given to most current research (Morris), yet it is not always the case – that is, we put priority for Morris or Modelski's data and Chandler's data are our last choice, yet if it is considered as the best estimate, we use Chandler. The city size estimates compiled in this way have a problematic degree inconsistency because the methods used by Morris, Modelski, and Chandler were somewhat different. For the state/empire data, most of the estimates we use are from a single author, Rein Taagepera (1978a, 1978b, 1979, and 1997). These estimates are less vulnerable to methodological inconsistencies than are the settlement size estimates.
We define a settlement as a spatially contiguous built-up area. This is the best definition for comparing the sizes of settlements across different polities and cultures because it ignores the complicated issues of governance boundaries (e.g., municipal districts, etc.). But it still has some problems. Most cultures have nucleated settlements in which residential areas surround a monumental, governmental or commercial center. In such cases it is fairly easy to spatially bound a contiguous built up area based on the declining spatial density of human constructions. But other cultures space residences out rather than concentrating them near a central place (e.g., many of the settlements in the prehistoric American Southwest such as Chaco Canyon). In such cases it is necessary to choose a standard radius from the center in order to make comparisons of population sizes over time or across cultures.11
ESTIMATING THE TERRITORIAL SIZES OF POLITIES
The territorial sizes of polities are difficult to accurately estimate from archaeological evidence alone. What we want to know is the size of the area over which a central power exercises a degree of control that allows for the appropriation of important resources (taxes and tribute). The ability to extract resources falls off with distance from the center in all polities, and controlling larger and larger territories requires the invention of new transportation, communications and organizational technologies (what Michael Mann [1986] has called ‘techniques of power’). Military technologies and bureaucracies are important institutional inventions that make possible the extraction of resources over great distances, but so are new ideologies and new technologies of communication (Innis 1950).
Of course, territorial size is only a rough indicator of the power of a polity because areas are not equally significant with regard to their ability to supply resources. A desert empire may be large but weak. But this rough indicator is quantitatively measurable in different world regions over long periods of time, so it is valuable for comparative historical research.
Estimating the territorial sizes of states and empires is based on the use of published historical atlases. For the ancient and classical worlds these are based primarily on knowledge about who conquered which city, and whether or not and for how long tribute was paid to the conquering polity. Sometimes it is difficult to tell whether or not tribute is asymmetrical or symmetrical exchange. Only asymmetrical (unequal) exchange signifies a tributary imperial relationship. Otherwise, it is just trade and does not signify an extractive relationship.
Most of the large ancient and classical empires involved the conquest of territory that was contiguous with the home territory. But once naval power was taken up by tributary states an empire could conquer and dominate a client state that was far from its home territory, such as Rome's control of areas on the south shore of the Mediterranean Sea. If these distant non-contiguous tribute-payers were small in number and size, not including them in the estimates of the territorial sizes of empires would not constitute a large error. But, as capitalism moved from the semiperiphery to the core, capitalist nation-states increasingly adopted the thallassocratic form of empire that had been pioneered by semiperipheral capitalist city-states12 – control over distant overseas colonies. The mo-dern colonial empires (British, French, etc.) require estimating the territorial sizes of colonies that are spread across the seas. The increasing institutionalization of the territorial boundaries of states makes this much easier than it was in the ancient and classical worlds in which polity boundaries were often quite fuzzy.
Not all maps in political atlases show the boundaries of territorial control. They may represent linguistic or religious groups or other distinctions that have little or nothing to do with state power. And maps may not have good time resolution. Our data on the territorial sizes of polities are mostly taken from the published articles of Rein Taagepera (1978a, 1978b, 1979, 1997), except that some estimates for South Asia have been added based on Schwartzberg (1992). In this paper we employ an interval of 50 years between the time points of estimates.13
POWER CONFIGURATIONS
David Wilkinson (1996, 1999, 2001, 2004a, 2004b, 2006) has coded the power configurations of interstate systems by reading the histories of battles and diplomacy. His coding scheme is based on seven polarity categories: 0 = Nonpolarity; 1 = Multipolarity; 2 = Tripolarity; 3 = Bipolarity; 4 = Unipolarity (Non-hegemonic); 5 = Hegemony; and 6 = Empire. These vary in terms of how unequal is the distribution of power among states in an interacting network of warfare and diplomacy based on Wilkinson's judgements of the relative power of the states in each system. Wilkinson sees these categorical polarities as somewhat unique configurations, but it is also possible to use his categories as rough continuum that varies from very decentralized nonpolarity to a very centralized situation of either hegemony or empire. It should be noted that Wilkinson's conception of hegemony requires that the hegemon has the power to enforce its wishes on the other states of the system.
We should note here that there is a logical overlap between Wilkinson's power configuration variable and our measure of the territorial size of the largest state in an interstate system. The size of the largest state is an important component of power configuration, but it does not include any information about the sizes of the other states. We expect that power configuration and largest territorial state will be positively related, but our research will show how large the positive relationship is and will show when and where these two variables diverge.
It should also be noted that Wilkinson coded power configuration every 10 or 25 years.14 We used those of his coding that corresponded with the fifty-year time points at which we have estimates of largest city population sizes and the territorial sizes of largest empires.
BIVARIATE CORRELATIONS: CITIES, STATES, AND POWER CONCENTRATION
Table 1 shows the bivariate Pearson's correlation coefficients (r) between power concentration, largest city size and largest polity size for each of the PMNs we are studying. David Wilkinson has not yet finished coding power concentration for the Central PMN, so we only show the correlation between cities and states for that PMN. Table 1 also shows the time periods and the number of time points used to calculate the Pearson's rs. And we also show the correlations between cities and states with year to see how important the usual long-term trend may be and how it may influence the other correlations. There is no long-term trend in power concentration (see http://irows.ucr.edu/cd/appendices/powsize/powconfig.xls).
Table 1 shows the bivariate Pearson's or Spearman's correlation coefficients (r) between power configuration (powcon), largest city size, and largest polity size for each of the PMNs we are studying. For Egypt and Mesopotamia, we use 100 year intervals, but for the others we use 50 year intervals. David Wilkinson has not yet finished coding power configuration for the Central PMN, so the correlations between powcon, cities and states are only for the period from 1500 BCE to 700 BCE. Table 1 also shows the time periods used to calculate the correlation coefficients. And it also shows the correlations between cities and states with year to see how important the long-term trend may be and how it may influence the other correlations. There is no usual long-term trend for power configuration so we do not show its correlations with year.
The bivariate correlation between largest states and largest cities is generally positive, as expected. It is slightly negative during the period studied for Mesopotamia because cities had grown large in an earlier period and were stuck at this size or declining in the period covered in Table 1. The bivariate correlations between largest cities and largest states in East Asia and the Central system are positive and statistically significant.
Table 1
Pearson's r bivariate correlation coefficients
| PMN | Time period | State/ city | Powcon/ city | Powcon/ state | Year/ city | Year/ state |
| Mesopotamia | 2700–1500 bce | –.09 | .25 | .14 | –.66* | .48 |
| Egypt | 2600–1500 bce | .39 | –.62* | –.01 | .48 | .45 |
| South Asia | 400 bce – 1000 ce | .50 | .09 | .30 | –.22 | .07 |
| East Asia | 1000 bce – 1800 ce | .49** | .07 | .43 | .80** | .59** |
| Central | 1500 bce – 1900 ce | .63** | –.25# | .28# | .67** | .72** |
# For the period from 1500 BCE to 700 BCE.
Source: http://irows.ucr.edu/cd/appendices/powsize/powsize.xlsx.
The power configuration correlation with the size of the largest state is slightly negative for Egypt, but positive for the other PMNs as expected.
The correlation between year and city is positive for the Central, East Asian, and Egyptian PMNs, and it is significant for East Asian PMN. The correlation between year and city is highly negative and significant for South Asia and Mesopotamian PMN. This is because in both systems cities arose earlier and had peaked out by the time we have Wilkinson's powcon estimates. The correlation between year and state is positive and for all the PMNs showing the long-term upward trend for polity size. More light can be shed on these correlations by examination of the charts that plot the changes for each PMN (see below).
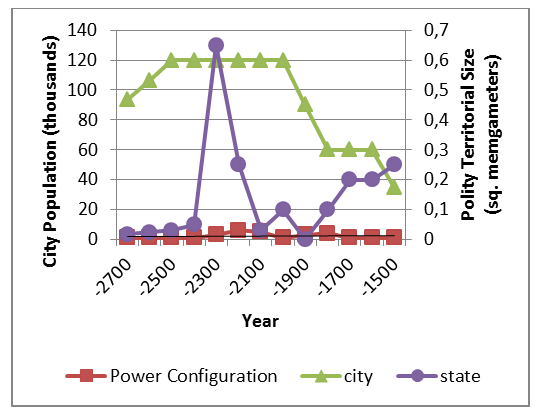
Cioffi-Revilla (2001) has identified most of the polities that were in interaction with one another in the Mesopotamian/West Asian international system from 6000 BCE to 1500 BCE, including the chiefdoms as well as the states and the empires. Fig. 2 shows the trajectories of Mesopotamia in the Late Bronze and early Iron ages. Cities grew in the earlier Bronze Age and then got smaller during the period shown in Figure 2. This explains the negative correlation between year and city sizes in Table 1. This correlation is positive for the whole period from 4500 bce to 1500 bce. The polity size story is rather different. Polities grew more slowly until the dramatic rise and fall of the huge but short-lived Akkadian Empire, but then their upward trajectory resumed, unlike that of the cities. The Power Configuration polarity sequence, which Wilkinson starts coding from 2700 BCE, shows oscillations that sometimes, but not always, follow the trajectory of the territorial sizes of the largest polities. The Akkadian empire corresponds with a rise in the centrality of the power configuration coding, but later territorial size rises do not seem to track it. The bivariate state/city correlation in Table 1 is slightly negative because of the temporally different developmental sequences of cities and states in Mesopotamia.
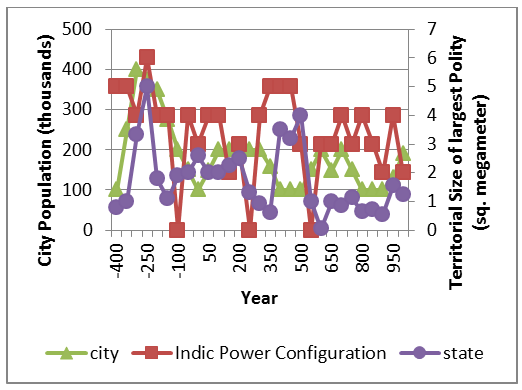
The South Asia PMN displays some peculiarities noted elsewhere (Chase-Dunn, Manning, and Hall 2000). The huge size of the Mauryan Empire in 300 bce was not repeated in later polity size upswings. The correlation between state size and year in Table 1 is .07, and the story is similar for city sizes (–.22) because cities were larger in the time of the Mauryan Empire than they were later on. Nevertheless, the relationship between city and state sizes is positive (.50) because of both the long-term down-trend and the medium-term variations. They both go down and the swings were somewhat contemporaneous. The power concentration variable swings the gamut from non-polar to empire and is correlated .30 with the size of the largest polity. The Mauryan Empire was a peak for both power concentration and polity size and just follows the largest peak of city sizes in the South Asia PMN.
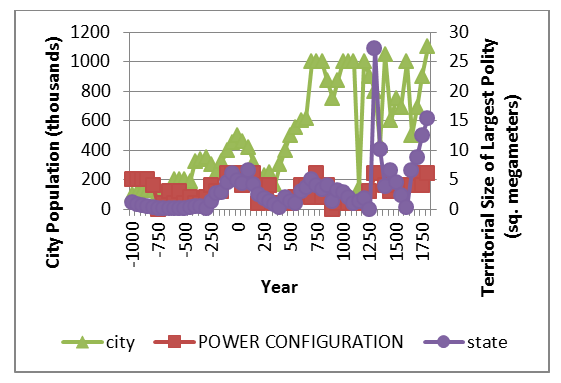
The East Asian PMN graph contains fifty-seven time points to display change in our three variables from 1000 BCE until 1800 CE. All of the correlations in Table 1 are positive. The only one that is not very positive is that between power concentration and city size (.07). The correlation between city and polity size is .49 and statistically significant. The Mongol Empire, which was an important player in both the East Asian and the Central PMNs shows a peak in 1300 ce for all three variables in Fig. 5. The correlation between power concentration and the size of the largest polity is .43. Both the trend correlations are high and significant (city/year .80 and state/year .59) so detrending is needed to see what happens with the state/city correlation.
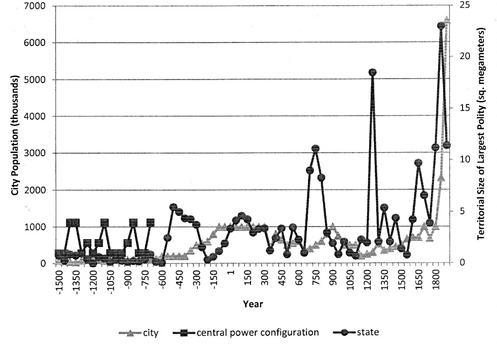
The bivariate correlation between city and state size for the sixty-nine time points between 1500 BCE and 1900 CE is .63 and it is statistically significant. We do not include 1950 and 2000 CE in Figure 5 because the cities get so large that the scale makes it impossible to see earlier variations. Both of the trend correlations are large and positive for the Central PMN (city/year = .67; state/year = .72) so the city/state correlation should be detrended to see the medium term variations hold up when the long-term trend is removed.
PARTIAL CORRELATIONS BETWEEN CITIES AND STATES
Table 2 reports the partial correlation coefficients between largest cities and states when year is held constant in order to remove the long-term trends to see if medium term swings are correlated. We also report the partial correlations between city, state and power concentration for the periods in which the latter estimates are available.
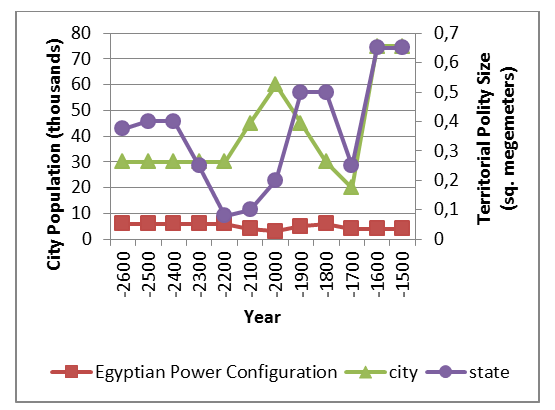
The partial correlation results generally confirm the hypothesis that changes in the sizes of cities and states are contiguous in time but there are some important exceptions. The Mesopotamian partial correlation is positive but not very large. The Egyptian partial correlation is negative (–.41) (see also Fig. 3). Both the Egyptian and Mesopotamian PMNs are during the Bronze and Early Iron ages when estimates of the sizes of both cities and polities are less reliable, and we have already remarked that we had to rely on more interpolations for both of these cases. But it is also possible that there are period differences that account for these lower or even negative relationships between city and state sizes.
Table 2
Partial Correlations
| PMN | Time period | State/city (whole period) | Powcon/city (shorter period) | Powcon/state (shorter period) |
| Mesopotamia | 2700– 1500 bce | .16 | .48* | .31 |
| Egypt | 2600– 1500 bce | .34 | –.46 | .40 |
| South Asia | 600 bce – 1000 ce | .38** | .00 | .19 |
| East Asia | 1000 bce – 1800 ce | .32** | .07 | .49*** |
| Central | 1500 bce – 1900 ce | .28** | –.51* | .46 |
Table 2 also shows some differences in size across the PMNs in the partial correlations between largest city sizes and the sizes of the largest states, but all the partial correlations are positive. And three of the five are statistically significant. Regarding the partial correlations between largest states and power configuration all the estimates are positive as we would expect because of the overlap between these two variables discussed above. The correlation for South Asia is low, suggesting that this may be a somewhat unique state system as discussed elsewhere.
The partial correlations between power concentration and largest cities show the greatest differences across PMNs, varying from .48 for Mesopotamia to –.51 for the Central PMN. The Egyptian PMN also has a rather large negative partial correlation.
DISCUSSION AND CONCLUSIONS
An earlier study (Chase-Dunn, Alvarez, and Pasciuti 2005) found positive cross-temporal correlations in several world regions in the relationship between the territorial sizes of the largest and the second largest states. This was surprising because of the hypotheses that territorial sizes of states are somewhat of a zero-sum game. If one state has a lot of territory there is less available for other states. This finding was interpreted to mean that world regions experienced periods of growth in which both the largest and second largest states were getting larger and periods in which the largest and second largest states were getting smaller, thus producing the positive cross-temporal correlation between largest and second largest states. If this is true it has implications for our study of the relationships between cities and states. The positive medium-term partial correlations may be due to these regional growth/decline phases.
As estimates of polity and settlement sizes for the Bronze and Early Iron Ages improve we should be able to be more certain about what accounts for the lack of a positive cross-temporal correlations between city and state sizes in Mesopotamia and Egypt – poor data or a truly different relationship during this early time period.
NOTES
1 The idea of the Central Political/Military Network (PMN) is derived from David Wilkinson's (1987) definition of ‘Central Civilization’. It spatially bounds systemic networks as sets of allying and fighting polities. The Central Political-Military Network is the interstate system that was created when the Mesopotamian and Egyptian PMNs became directly connected with one another in about 1500 BCE. The Central PMN expanded in waves until it came to encompass the whole Earth in the 19th century CE. Because it was an expanding system its spatial boundaries changed over time. We mainly follow Wilkinson's decisions about when and where the Central System expanded, and the temporal bounding of the regions we are studying also follows Wilkinson's dating of when these regions became incorporated into the expanding Central PMN. The contemporary global PMN is the international system of states. The merger of the Mesopotamian and Egyptian interstate systems began as a result of Eighteenth Dynasty Egypt's invasions, conquests, and diplomatic relations with states of the Southwest Asian (Mesopotamian) systems – first of all Mitanni, then the Hittites, Babylon, and Assyria. The signal event was Thutmosis I's invasion of Syria in about 1505 BCE. The fusion of the systems began then but enlarged and intensified until 1350 BCE. Thutmosis III's many campaigns in Syria and the establishment of tributary relations, wars and peace-making under Amenhotep II, as well as the peaceful relations and alliance with Mitanni by Thutmosis IV, eventually led to Egyptian hegemony under Amenhotep III (Wilkinson pers. comm. Friday, April 15, 2011). The final linking of the South Asian PMN with the Central PMN was begun by the incursion of Mahmud of Ghazni in 1008 CE. Alexander of Macedon's earlier incursion into South Asia in the 4th century BCE had been a temporary connection between the Central and the South Asian PMNs that ceased after the Greek conquest states in South Asia had been expelled. The connection was made permanent by Mahmud of Ghazni. After 1850 CE the East Asian PMN was engulfed by the Central PMN.
2 Europe was never a whole interstate system separate from the one in the Near East, though Wilkinson (1987) specifies a short-lived separate Aegean state system in the early Iron Age (1600 to 600 BCE).
3 A downsweep is a low point (trough) that is at least one-third lower than the average of the three previous troughs.
4 World-systems are defined as being composed of those human settlements and polities within a region that are importantly interacting with one another (Chase-Dunn and Hall 1997; Chase-Dunn and Lerro 2014). When communication and transportation technologies were less developed world-systems were small.
5 Settlement is a general term that includes camps, hamlets, villages, towns, cities and the great megacity urban regions that compose the contemporary global urban system.
6 This article reports results from a research project on the growth of settlements and polities in regional world-systems since the Stone Age. The project is the Settlements and Polities (SetPol) Research Working Group at the Institute for Research on World-Systems at the University of California-Riverside. The project uses both quantitative estimates of the population sizes of the largest settlements in world regions as well as estimates of the territorial sizes of largest polities to study the location and timing of changes in the scale of human institutions. The project web site is at http://irows.ucr.edu/research/citemp/citemp.html. IROWS collaborates with SESHAT: The Global History Data Bank. The data appendix containing the estimates used in this paper is at http://irows.ucr.edu/cd/ appendices/powsize/powsizeapp.htm.
7 We use the term ‘polity’ to generally denote a spatially-bounded realm of sovereign authority such as a band, tribe, chiefdom, state or empire (see also Cioffi-Revilla 2001: 4). Our study of polity size upsweeps is presented in Inoue et al. (2012).
8 The normal cycle roughly approximates a sine wave, although few cycles that involve the behaviour of humans actually display the perfect regularity of amplitude and period found in the pure sine wave.
9 This cutting point specifies what we mean by ‘significant’ in a way that can be used to systematically compare widely different times and places.
10 In a later version of this research we shall also use temporally-constant world regions as the unit of analysis.
11 Data Modification Note: Mesopotamia data. Modelski's data do not have the year –2250. Chandler has it but his estimate is hugely different from Modelski's. Therefore, Chandler's estimate is not used. The year –2250 is interpolated from Modelski's estimates.
12 The comparative world-systems perspective developed by Chase-Dunn and Hall (1997) contends that semiperipheral capitalist city-states (specialized trading states in semiperipheral locations in the interstices between large tributary states and empires) were the main agents that encouraged commercialization and the production of commodities in the Bronze and Iron Ages.
13 Interpolations: Egyptian city: 23 out of 34 cases (68 %) is interpolation; Egyptian empire: 19 out of 34 cases (56 %) is interpolation; Mesopotamian city: about 72 % interpolation; Mesopotamian empires: about 83 % interpolation. Egyptian and Mesopotamian estimates are composed of more than 50 % of interpolations and the intervals of the interpolations are large.
14 Wilkinson codes the Central, Mesopotamian and South Asia PMNs every 10 years. The East Asian and Egyptian systems are coded every 25 years.
REFERENCES
Chase-Dunn, Ch. 2014. Continuities and Transformations in the Evolution of World-Systems. Journal of Globalization Studies 5 (1): 11–31.
Chase-Dunn, Ch., Anderson, E. N., Inoue, H., Álvarez, A., Álvarez, R., Bao, L., Khan, A., and Jaworski, C. 2013. Semiperipheral Capitalist City-States and the Commodification of Wealth, Land, and Labor since the Bronze Age. IROWS Working Paper No. 79. URL: http:// irows.ucr.edu/papers/irows79/irows79.htm.
Chase-Dunn, Ch., and Hall, T. D. 1997. Rise and Demise: Comparing World-Systems. Boulder, CO: Westview Press.
Chase-Dunn, Ch., and Inoue, H. 2017. Spirals of Sociocultural Evolution within Polities and in Interpolity Systems. To be presented at the Annual Meeting of the International Studies Assiciation. Baltimore, MD, February 22–25.
Chase-Dunn, Ch., and Jorgenson, A. K. 2003. Regions and Interaction Networks: An Institutional Materialist Perspective. International Journal of Comparative Sociology 44 (1): 433–450.
Chase-Dunn, Ch., and Lerro, B. 2014. Social Change: Globalization from the Stone Age to the Present. Boulder, CO: Paradigm.
Chase-Dunn, Ch., Manning, S., and Hall, T. D. 2000. Rise and Fall: East-West Synchronicity and South Asia Exceptionalism Reexamined. Social Science History 24 (4): 727–754.
Chew, S. C. 2001. World Ecological Degradation: Accumulation, Urbanization, and Deforestation, 3000 B.C. – A.D. Walnut Creek, CA: Altamira Press.
Chew, S. C. 2007. The Recurring Dark Ages: Ecological Stress, Climate Changes, and System Transformation. Walnut Creek, CA: Altamira Press.
Cioffi-Revilla, C. 2001. Origins of the International System: Mesopotamian and West Asian Polities, 6000 BC to 1500 BC. Annual Meeting of the ASOR, November. URL: http://citeseerx.ist.psu.edu/viewdoc/ download?doi=10.1.1.189.2373&rep=rep1&type=pdf.
Economist. 2008. The Economist Pocket World in Figures. London: Profile.
Frank, A. G., and Gills, B. 1994. The World System: 500 or 5000 Years? London: Routledge.
Granger, C. W. 1988. Some Recent Development in a Concept of Causality. Journal of Econometrics 39 (1): 199–211.
Hall, T. 2014. Toward Comparative Globalizations: Globalization in Historical Retrospective and World-System Analysis. Journal of Globalization Studies 5 (1): 3–10.
Innis, H. 1972 [1950]. Empire and Communications. Toronto: University of Toronto Press.
Inoue, H., Álvarez, A., Lawrence, K., Roberts, A., Anderson, E. N., and Chase-Dunn, Ch. 2012. Polity Scale Shifts in World-Systems since the Bronze Age: A Comparative Inventory of Upsweeps and Collapses. International Journal of Comparative Sociology. URL: http://cos. sagepub.com/content/53/3/210.full.pdf+html.
Inoue, H., Álvarez, A., Anderson, E. N., Owen, A., Álvarez, R., Lawrence, K., and Chase-Dunn, Ch. 2015. Urban Scale Shifts since the Bronze Age: Upsweeps, Collapses and Semi-peripheral Development. Social Science History 39 (2). URL: http://irows.ucr.edu/papers/ irows89/irows89.htm.
Inoue, H., Álvarez, A., Anderson, E. N. Lawrence, K., Neal, T., Khutkyy, D., Nagy, S., DeWinter, W., and Chase-Dunn, Ch. 2016. Comparing World-Systems: Empire Upsweeps and Non-core Marcher States since the Bronze Age. IROWS Working Paper #56.
IROWS 2017. Settlement Data Sets. URL: wsarch.ucr.edu/archive/data/ setdataset.htm.
Lenski, G. 2005. Ecological-Evolutionary Theory. Boulder, CO: Paradigm Publishers.
Mann, M. 1986. The Sources of Social Power. Vol. 1. A History of Power from the Beginning to A.D. 1760. Cambridge: Cambridge University Press.
Modelski, G. 2003. World Cities: –3000 to 2000. Washington, DC: Faros 2000.
Modelski, G., Devezas, T., and Thompson, W. R. (Eds.) 2008. Globalization as Evolutionary Process: Modeling Global Change. London: Routledge.
Morris, I. 2010. Why the West Rules – For Now. New York: Farrer, Straus and Giroux.
Pasciuti, D. 2002. A Measurement Error Model for Estimating the Population Sizes of Preindustrial Cities. Urbanization and Empire Formation Project, Institute for Research on World-Systems, University of California. URL: http://irows.ucr.edu/research/citemp/estcit/modpop/ modcitpop.htm (accessed 13 October 2011).
SESHAT: The Global History Data Bank. The Evolution Institute. URL: http://evolution-institute.org/seshat.
SetPol Project. The Research Working Group on Settlements and Polities, Institute for Research on World-Systems, University of California-Riverside. URL: http://irows.ucr.edu/research/citemp/citemp.html.
Schwartzberg, J. E. 1992. A Historical Atlas of South Asia. New York: Oxford University Press. eMap: Atlas: Document: English: 2nd impression. Chicago: Digital South Asia Library, Center for Research Libraries. URL: http://dsal.uchicago.edu/reference/schwartzberg/.
Smith, M. E. 2016. Why would a Journal Called ‘Scientific Data’ Publish Bad Data? The Chandler/Modelski City-Size Problem. URL: http:// publishingarchaeology.blogspot.jp/2016/06/why-would-journal-cal led-scientific.html.
Taagepera, R. 1978a. Size and Duration of Empires: Systematics of Size. Social Science Research 7: 108–127. URL: http://www.sciencedirect. com/science/article/pii/0049089X78900078.
Taagepera, R. 1978b. Size and Duration of Empires: Growth-Decline Curves, 3000 to 600 B.C. Social Science Research 7: 180–196. URL: http://www.sciencedirect.com/science/article/pii/0049089X78900108.
Taagepera, R. 1979. Size and Duration of Empires: Growth-Decline Curves, 600 B.C. to 600 A.D. Social Science History 3 (3–4): 115–138. URL: http://www.jstor.org/pss/1170959.
Taagepera, R. 1997. Expansion and Contraction Patterns of Large Polities: Context for Russia. International Studies Quarterly 41 (3): 475–504. URL: http://onlinelibrary.wiley.com/doi/10.1111/0020-8833.00 053/abstract.
Turchin, P., and Nefedov, S. 2009. Secular Cycles. Princeton, NJ: Princeton University Press.
Wallerstein, I. 2011 [1974]. The Modern World-System. Vol. 1. Berkeley: University of California Press.
Wilkinson, D. 1987. Central Civilization. Comparative Civilizations Review 17: 31–59.
Wilkinson, D. 1996. Configurations of the South Asia States System. Comparative Civilizations Review: 63–119.
Wilkinson, D. 1999. Power Polarity in the Far Eastern World System, 1025 BC–AD 1850: Narrative and 25-Year Interval Data. Journal of World-Systems Research 5(3): 501–617.
Wilkinson, D. 2001. Problems in Power Configuration Sequences: The Southwest Asian Macrosystem to 1500 BC. Comparative Civilizations17: 1–13.
Wilkinson, D. 2004a. Power Configuration Sequences in the Northeast African World System to 1500 BC. Comparative Civilizations Review: 82–104.
Wilkinson, D. 2004b. The Power Configuration Sequence of the Central World System, 1500–700 BC. Journal of World-Systems Research 10 (3). URL: http://jwsr.pitt.edu/ojs/index.php/jwsr/article/view/279.
Wilkinson, D. 2006. Analysis of Power-Structure Fluctuations in the Longue Durée of the South Asian World System. 1 Structure and Dynamics: eJournal of Anthropological and Related Sciences No. 2, Article 2 (with S. V. Tsirel). URL: http://repositories.cdlib.org/imbs/ socdyn/sdeas/vol1/iss2/art2.
Wilkinson, D. 2017. When States-Systems Unite: Spatio-temporal Boundary and Transition Issues in the Unification of the Central, Far Eastern and South Asia States-Systems. In Chase-Dunn, Ch., and Inoue, H. (eds.), Systemic Boundaries: Time Mapping Globalization since the Bronze Age (p. 40). Vienna: Springer-Verlag GmbH.
Wilkinson's Maps. URL: http://irows.ucr.edu/research/citemp/asa01/wil kinson.htm.