The Imperial Curve of Large Polities

Journal: Social Evolution & History. Volume 16, Number 2 / September 2017
ABSTRACT
Many researchers, from Edward Gibbon to Arnold Toynbee, were interested in how large polities would emerge and collapse. Traditionally, the history of empires was considered both in temporal and spatial dynamics. This article focuses on the study of the external manifestations of polities' structural features which may be expressed by a limited set of mathematical curves described by the specified Zipf's law. An ideal Zipf's curve is characteristic of the classical empires with complex economies (China, Rome, and others). However, the curves of some empires have a distinctive feature – an ‘imperial tail’. The simpler the structure of large polities is, the closer is the line describing their livelihoods to a right line.
INTRODUCTION
One of the most intriguing problems in world history is how and why enormous empires would emerge and later break up and disappear from the arena of world history. Abundant works have been published on the subject considering various aspects including the causes of origin and decline of the empires as well as the analysis of duration of empires' cycles. Great English historian Edward Gibbon was also interested in this subject when he wrote The History of the Decline and Fall of the Roman Empire (1776–1979) which volumes are still reprinted in many countries.
In the years that followed, the researchers got interested in how long the great empires and states can exist from their inception to fall. Great English historian of civilizations Arnold Toynbee wrote that a life cycle of a civilization lasts for about 1,200 years. In the Soviet Union a similar idea was expressed by Leo Gumilev who argued that large multi-national polities (‘super-ethnoses’ in Russian) exist from 1,200 to 1,500 years (Gumilev 1989). Still it is surprising that none of the researchers would ever check the accuracy of this supposition. Obviously, any empire sooner or later is predetermined to disintegrate. But is it possible to calculate the life-span of a polity similar as it can be done for a biological or-ganism?
The subject of the present study is a search for common patterns and characteristics of the formalized properties of polities' life cycle within the framework of cliodynamics (Turchin 2008) which considers various approaches to long-term forecasting of the world historical processes. The studies within this approach have already provided some important results for the comprehension of secular cycles, growth of the world population, and of other important laws governing the dynamics of social systems (Turchin 2003, 2009; Cioffi-Revilla 2005; Korotayev 2005; Korotayev, Malkov, and Khaltourina 2006; Turchin and Nefedov 2009; Chase-Dunn 2014; Grinin and Korotayev 2014, 2015, 2016; Goldstone 2016 etc.).
SOURCES AND METHODS
There are various factors, including the population number, number of cities and their population, and polity land area, which support the formalization of long-term (long) historical processes. However, for the pre-industrial societies we do not have sufficient and accurate data on the first two characteristics.
For this study, we have selected 46 societies which we find most important for our purposes. While selecting the examples we intuitively tried to choose those societies, for which it was possible to more or less reliably reconstruct the size of polities in different stages of their existence.
As a source database we chose the ‘Central Political Military Network (Empires)’ available at the website of the Institute for Research on World-Systems (IROWS) at the University of California, Riverside. The works of Estonian researcher Rein Taagepera studying the dynamics of empires and states throughout 5,000 years of written history served as sources for this database (Taagepera 1978a, 1978b, 1979). These data have already been used by different scholars who drew a number of important conclusions about the dynamics of the pre-industrial polities (Chase-Dunn, Alvarez et al. 2006; Chase-Dunn and Hall 1997; Chase-Dunn, Hall, Niemeyer et al. 2010; Turchin 2009; Marchetti and Ausubel 2012 etc.).
To pursue the research objective of studying the degree of impact of geographic variable (territory size) on the dynamics of empires and states, we should divide polities according to this characteristic. The baseline data for each of the selected polities represent a one-dimensional array of data analyzed in order to examine the structure and peculiarities of the sample, to determine the semantics embedded in the information and to choose the methods for further processing and scrutiny.
Processing was carried out within the frameworks of Data Mining technology, which allows revealing the hidden, non-trivial and non-formalizable patterns in data sets based on a template concept, expressed in a clear and understandable form of rank distributions.
A set of elements with their names listed in descending order by their quantitative characteristics forms a rank distribution. The rank distributions have been known since 1913 (Auerbach 1913; Zipf 1949; Mandelbrot 1977). They are currently used in various fields of science from linguistics (Zipf's law) to investigations of galactic radiation intensity, size of the US oil deposits, size of cities in the world, daily price fluctuations on Forex markets, number of citations of most famous physicists and so on (Clauset, Shalizi, and Newman 2007). The issues related to the mathematical interpretation of Zipf's law (and its modifications) were considered in Maslov (2005).
In our work we constructed the rank distributions of the area data corresponding to countries in different stages of their existence. The data were ranked according to the increasing area occupied by respective countries. A rank was attributed to each element of the attained data sets and it coincides with the largest number of data elements in the general list.
In accordance with the Zipf-Mandelbrot law, for data grouped in such order there is a dependence of the rank on the selected characteristics. In our case, this law can be interpreted as follows

where r is a rank and s is the size of polity territory in a given year. After the elaboration of the rank distributions we can identify similar in type functions (f) characterizing different groups of polities. We obtained several alternatives which we discuss below.
Something similar has already been done by Marchetti and Ausubel (2012). Traditionally, these data are represented as a curve line in which the abscissa reflects the time arrow and the ordinate represents the size of a polity's territory. The line reflects the polity life cycle, from the rise to decline (Fig. 1).
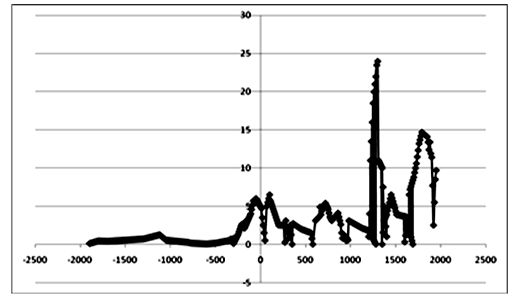
Fig. 1. Change in China's territory size in historical dynamics
However, our methodology involves a rearrangement of data in accordance with the ‘size-rank principle’. In fact, we excluded time from the analysis. The result is the line of rank distribution (Fig. 2).
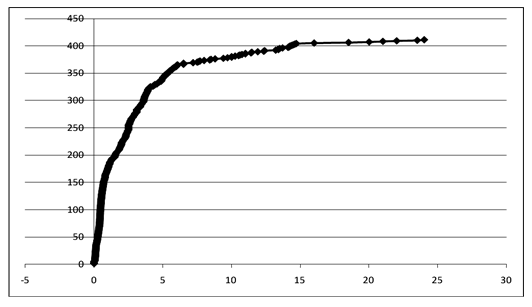
Fig. 2. The rank distribution of China's territory size
We suppose that the character of the graph (a curve, right line, etc.) may be the reflection of the structural characteristics and dynamics of large polities. Figuratively, it can be compared with a spectrum, which allows one to judge the chemical composition of substances by color. The more complex the polity's internal structure and longer its existence, the more the rank distribution curve of its area resembles the classic Zipf's curve. Conversely, the shorter the period of existence and simpler the internal structure of a polity, the more the rank curve resembles a piecewise-linear curve (Fig. 3 and Fig. 4).
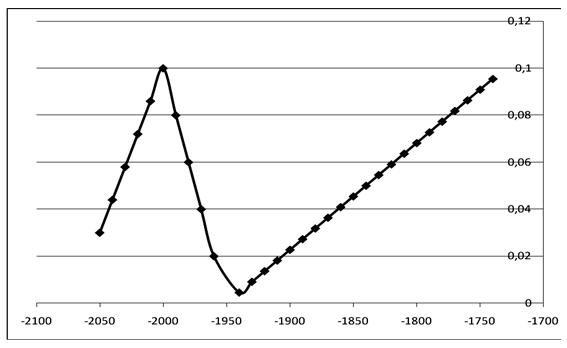
Fig. 3. Change of Sumer area size in chronological sequence
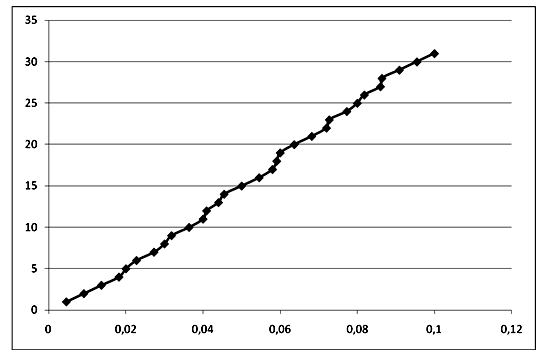
Fig. 4. Rank distribution of Sumer's area
In addition, we decided to somehow move away from Taagepera's division of societies into four geographical macro-regions, namely: Afro-Europe (centered in the Mediterranean), West Asia, South Asia, and East Asia. In our sample America is represented by a single example of the Incas. We found it necessary to introduce the steppe region of Central Asia and the level of inter-regional empires (in Table 1 the latter will be denoted by a slash mark), and in some cases to distinguish the areas of a lower order within macro-regions. This was done in order to verify the role of the geographical factor in the dynamics of empires and states.
RESULTS AND DISCUSSION
We have defined two types of dependencies. The first type with a non-linear character has four varieties:
1.1. ‘Classic curves’ similar in shape to the Zipf-Mandelbrot distribution's logarithmic curves (Babylon, China) (Fig. 5).
1.2. In some cases, the classic curves have a kind of ‘tail’. This is determined by a drastic changes in some empires' territory size which manifest in a sharp rise in the rank value with a respective graphic expression (the Roman Empire, the Incan Empire, Carthage, and Ottoman Empire) (Fig. 6). We called it the ‘imperial curve’ or ‘imperial curve with the imperial tail’ since this feature can be encountered often in large-area empires.
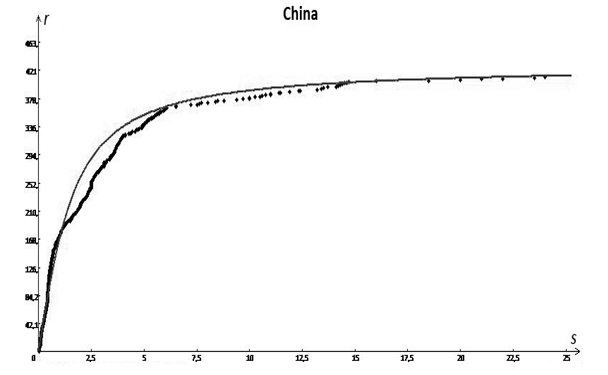
Fig. 5. Rank distribution of China's polity size
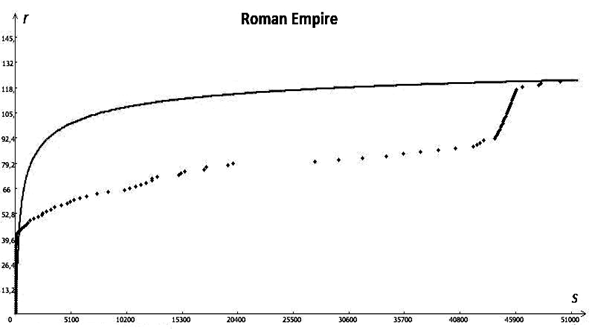
Fig. 6. Rank distribution of the Roman Empire's polity size
The following two curves are versions of the Zipf distribution's hyperbolic curves.
1.3. ‘Convex curves’ (Assyria, Byzantium, the Seleucid state) (Fig. 7).
1.4. ‘Concave curves’ (Persia, Polish-Lithuanian Commonwealth, Ptolemaic Egypt, and Frankish Kingdom) (Fig. 8).
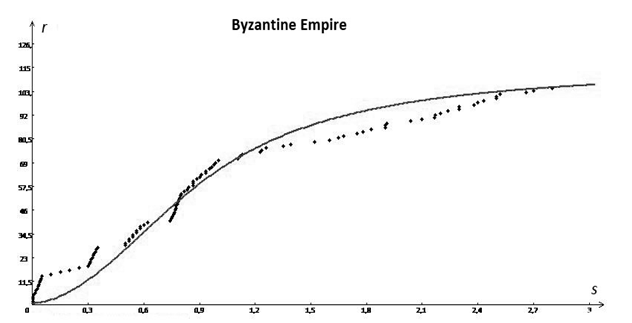
Fig. 7. Rank distribution of the Byzantine Empire's polity size
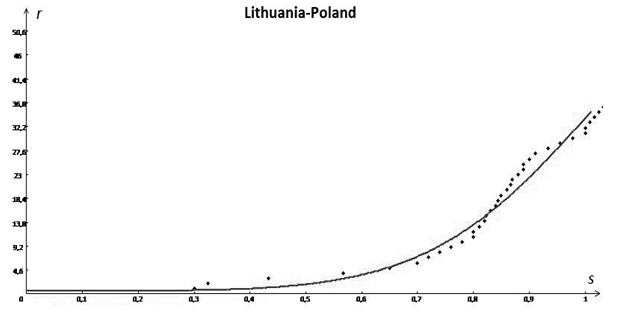
Fig. 8. Rank distribution of Polish-Lithuanian Commonwealth's polity size
The second type of dependencies has a piecewise-linear character and includes three varieties:
2.1. Right lines without breaks (the Avarians, the Il-khanate, the Mali state, and the Uighurs) (Fig. 9).
2.2. Lines with one break (Media, Samanids, Urartu, Elam, and Kievan Rus) (Fig. 10).
2.3. Lines with two or more breaks (the Golden Horde, India, Mongolia, and Russia) (Fig. 11).
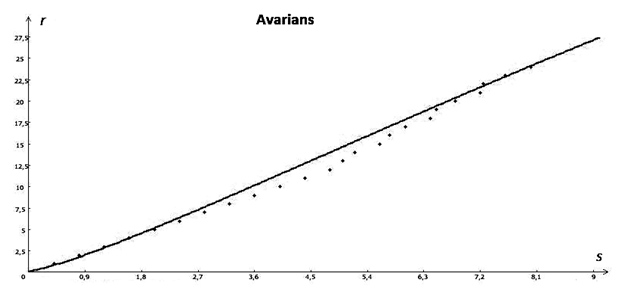
Fig. 9. Rank distribution of the Avarian khanate's polity size
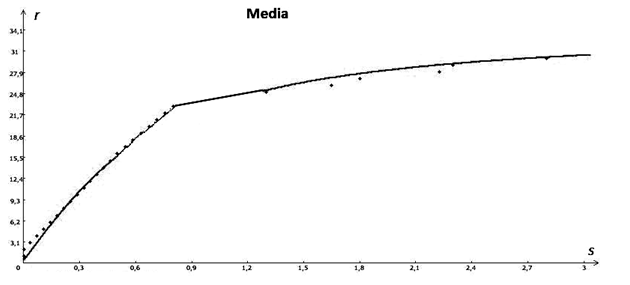
Fig. 10. Rank distribution of Media's polity size
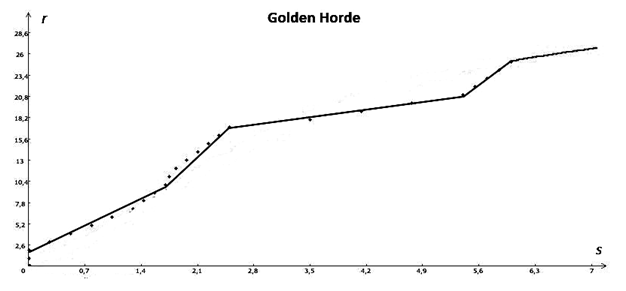

Fig. 11. Rank distribution of the Golden Horde's polity size
For particular regions the correlation between the size of a polity and the type of the curve looks as presented in Table 1.
Table 1
Afro-Europe (with a center in the Mediterranean)
| Name of polity | Period | Region | Type of the curve |
| Carthage | antiquity | NAf/SEu | classic curve |
| The Roman Empire | antiquity | WEu/NAf | imperial curve |
| Ptolemaic Egypt | antiquity | NAf | concave curve |
| Fatimid-Ayyubid-Mamluk Egypt | medieval | NAf | convex curve |
| Frankish Kingdom | medieval | WEu | concave curve |
| Mali state | medieval | Af | line without breaks |
Eastern Europe
| Name of polity | Period | Region | Type of the curve |
| Avars | medieval | EEu | line without breaks |
| Khazars | medieval | EEu | line without breaks |
| Golden Horde | medieval | EEu | line with two or more breaks |
| Kievan Rus | medieval | EEu | line with one break |
| Polish-Lithuanian Commonwealth | medieval | EEu | concave curve |
| Russia | medieval | EEu/CA | line with two or more breaks |
West Asia
| Name of polity | Period | Region | Type of the curve |
| Sumerian | early antiq. | WAsia | line without breaks |
| Akkad | early antiq. | WAsia | line without breaks |
| Elam | early antiq. | WAsia | line with one break |
| Hittites | early antiq. | WAsia | line with one break |
| Samanids | mediaeval | WAsia | line with one break |
| Mitanni | early antiq. | WAsia | line with one break |
| Assyria | early antiq. | WAsia | convex curve |
| Babylon | early antiq. | WAsia | classic curve |
| Byzantium | mediaeval | EEu/WAs | convex curve |
| Urartu | early antiq. | WAsia | line with one break |
| Media | early antiq. | WAsia | line with one break |
| Persia | antiquity | WAsia | concave curve |
| Parthia | antiquity | WAsia | concave curve |
| Sasanian kingdom | antiquity | WAsia | line with one break |
| Seleucid | antiquity | WAsia | convex curve |
| Ottoman Empire | medieval | WAsia | imperial curve |
| Arab Сaliphate | medieval | NAf/Was | line with two or more breaks |
| Seljuks | medieval | WAsia | classic curve |
| Jou-jan | medieval | WAsia | classic curve |
| Almoravides | medieval | NAf | line without breaks |
Central Asia
| Name of polity | Period | Region | Type of the curve |
| Il-Khan | medieval | CAsia | line without breaks |
| Khwarizm (Chorezm) | medieval | CAsia | line with two or more breaks |
| Timur | medieval | CAsia | line with two or more breaks |
East Asia
| Name of polity | Period | Region | Type of the curve |
| Hsuing-Nu (Huns) | antiquity | EAsia | the convex curve |
| Turkish Empire | medieval | EAsia | line with two or more breaks |
| Western Turks | medieval | EAsia | concave curve |
| Uighurs | medieval | EAsia | line without breaks |
| Khitan | medieval | EAsia | line without breaks |
| Mongols | medieval | Eurasia/EA | line with two or more breaks |
| China | all | EAsia | classic curve |
South Asia
| Name of polity | Period | Region | Type of the curve |
| Pratihara | medieval | SAsia | line without breaks |
| India | medieval | SAsia | classic curve |
| Khmer Empire | medieval | SAsia | line without breaks |
America
| Name of polity | Period | Region | Type of the curve |
| Incas | mediaeval | SAmer | imperial curve |
The visual analysis of function graphs reveals the following:
1. For states based mostly on power factors (the conquering states, nomadic empires, tributary-redistributive empires, and maritime empires) the area distribution function is more characterized by a right line than a curve.
This group includes such societies as the Sumerian, Akkad, Arabs, Almoravides, Il-Khan, Turks, Uighurs, Khitan, Avars, Khazars, Rus, Mongols, the Golden Horde, Russia, Franks, and Mali. The Sumerian and Akkad cases require further explanation.
2. The more complex internal structure of the polity and more developed its market economy are, the more the graph of the distribution function corresponds either to the classic Zipf's hyperbolic curve or to the Zipf-Mandelbrot's logarithmic curve. This group of polities includes such empires as Egypt after the decline of the caliphate, India, Assyria, Babylon, Byzantium, Media, Seleucids, Seljuks, and Ottomans.
3. The classic Zipf-Mandelbrot's logarithmic curves are typical of the largest and most important empires of the antiquity and the Middle Ages (China, India, Rome, Incan, and others). The empires that suffered an irreversible decay (ancient Rome, Ottoman Empire, Carthage, and Incan) necessarily display a sharp rise in the ranks for the large values of polity size. We denote such cases as imperial curves. The empires that succeeded to retain their integrity did not display such growth (China). Perhaps, the imperial curve represents a non-trivial complexity of the polities under study.
4. The Zipf's hyperbolic curves are characteristic of such polities as Ptolemaic Egypt, Western Turks, Poland and others. Probably, it is the evidence of a society's certain structural instability.
5. In a number of cases we obtained the functions (1) in the form of right lines with breaks. One can distinguish two alternative cases here. The first case is typical of earlier states: at the beginning there is a sharp rise which is followed by a more gentle sloped line after the break (the Elam, Hittites, Mitanni, Urartu, and Samanids). In the second case we deal with later empires where a gentle rise is followed by a sharp rise (Persia, Sassanids, Parthia, Khwarezm, and Tamerlane's empire). It has yet to be studied whether a certain historical pattern underlies the established chronological distinction.
6. In some cases one can argue that in some regions the societies that are kindred or live in a similar geographical environment have a resembling function graph (1), as we can observe in the Middle East (Media, the Seleucids, and the Ottomans) or in Central Asia (Khwarezm and Tamerlane's empire).
CONCLUSION
Thus, in the present study, basing on the data base Central Political Military Network (Empires) we have performed the division of polities according to the objective data on the size of their territories. By the type of the rank distribution function graph we have discriminated different types of curves. We have traced the following definite trend: large polities with complex internal structure are characterized by curves while the right lines are more characteristic of ‘marcher’ polities. Such a division not only provides an opportunity to group polities according to the peculiarities of their internal structure, but also offers a challenge and gives an opportunity to obtain information of a new quality.
NOTE
* This study was supported by mega-grant of Russian Federation Government for the distinguished scientists, No. 14.W03.31.0016 ‘Dynamics of peoples and empires in Inner Asia’.
REFERENCES
Auerbach, F. 1913. The Law of Population Concentration. The Law of Population Concentration. Petermann's Geogr Releases 59: 74–76.
Chase-Dunn, C. 2014. Continuities and transformations in the evolution of world-systems. Journal of Globalization Studies 5 (1): 11–31.
Chase-Dunn, C., Alvarez, A., Inoue, H., Niemeyer, R., Carlson, A., Fierro, B., and Lawrence, K. 2006. Upward Sweeps of City and Empire Growth since the Bronze Age. A Paper Presented at the Annual Meetings of the American Sociological Association, Montreal, Friday, August 11. IROWS Working Paper No. 22. URL: http://www.irows.ucr. edu/papers/irows22/irows22.htm.
Chase-Dunn, C., and Hall, T. D. 1997. Rise and Demise: Comparing World-Systems. Boulder, CO: Westview.
Chase-Dunn, Ch., Hall, T., Niemeyer, R. et al. 2010. Middlemen and Marcher States in Central Asia and East/West Empire Synchrony. Social Evolution & History 9 (2): 52–79.
Cioffi-Revilla, C. 2005. A Canonical Theory of Origins and Development of Social Complexity. Journal of Mathematical Sociology 29 (2): 133–153.
Clauset, A., Shalizi, C. R., and Newman, M. E. J. 2007. Power-Law Distributions in Empirical Data. URL: https://arxiv.org/abs/0706.1062.
Gibbon, E. 1776–1789. The History of the Decline and Fall of the Roman Empire (Vol. 1, 1776; Vols. 2, 3, 1781; Vols. 4, 5, 6, 1788–1789). London: Strahan & Cadell.
Goldstone, J. 2016. Population Ageing and Global Economic Growth. Journal of Globalization Studies 7 (2): 11–31.
Grinin, L., and Korotayev, A. 2014. Origins of Globalization in the Framework of the Afroeurasian World-System History. Journal of Globalization Studies 5 (1): 32–64.
Grinin, L., and Korotayev, A. 2015. Great Divergence and Great Convergence: A Global Perspective. New York etc.: Springer.
Grinin, L., and Korotayev, A. 2016. Global Population Ageing, the Sixth Kondratieff Wave, and the Global Financial System. Journal of Globalization Studies 7 (2): 11–31.
Gumilev, L. N. 1989. Ethnogenesis and Biosphere of the Earth. Leningrad: University of Leningrad. Original in Russian (Гумилев Л. Н. Этногенез и биосфера Земли. Л.: Издательство ЛГУ).
Korotayev, A. 2005. A Compact Macromodel of World System Evolution. Journal of World-Systems Research 11 (1): 79–93.
Korotayev, A., Malkov, A., and Khaltourina, D. 2006. Introduction to Social Macrodynamics: Secular Cycles and Millennial Trends. Moscow: URSS.
Mandelbrot, B. B. 1977. The Fractal Geometry of Nature. New York: Freeman.
Marchetti, C., and Ausubel, J. H. 2012. Quantitative Dynamics of Human Empires. International Journal of Anthropology 27 (1–2): 1–62.
Maslov, V. P. 2005. On a General Theorem of Set Theory Leading to the Gibbs, Bose-Einstein, and Pareto Distributions as well as to the Zipf-Mandelbrot Law for the Stock Market. Mathematical Notes 78 (5): 807–813.
Taagepera, R. 1978a. Size and Duration of Empires: Systematics of Size. Social Science Research 7: 108–127.
Taagepera, R. 1978b. Size and Duration of Empires: Growth-Decline Curves, 3000 to 600 B.C. Social Science Research 7: 180–196.
Taagepera, R. 1979. Size and Duration of Empires: Growth-Decline Cur-ves, 600 B.C. to 600 A.D. Social Science History 3 (3–4): 115–138.
Toynbee, A. J. 1934–1961. A Study of History (Vols. 1–3, 1934; Vols 4–6, 1939; Vols. 7–10, 1954; Vol. 11, 1959; Vol. 12, 1961). Oxford: Oxford University Press.
Turchin, P. 2003. Historical Dynamics: Why States Rise and Fall. Princeton: Princeton University Press.
Turchin, P. 2008. Arise ‘Cliodynamics’. Nature 454 (7200): 34–35.
Turchin, P. 2009. A Theory for Formation of Large Empires. Journal of Global History 4: 191–217.
Turchin, P., and Nefedov, S. A. 2009. Secular Cycles. Princeton: Princeton University Press.
Zipf, G. K. 1949. Human Behavior and the Principle of Least Effort. Cambridge, MA: Addison-Wesley.