Russia's Comparative Economic Development in the Long Run


Journal: Social Evolution & History. Volume 3, Number 1 / March 2004
ABSTRACT
Calculations made by the author reveal that during the 18th – beginning of the 19th century Russia's level of development was not ‘between the West and (the advanced countries of) the East’, but turned to be lower than both of them. Despite some speed-up in GDP growth during the last decades of Imperial Russia, its developmental model was unsteady, lopsided, with relatively low and declining contribution of productivity growth. Although Soviet model of growth was marked by achievements in education, healthcare and science, Soviet per capita GDP (corrected for huge increase in the share of gross investment and military spending) related to the level of advanced countries, decreased from 28–30% in 1913 to 16–18% in 1990.
Despite considerable social, demographic and economic sacrifices of the transitional period Russia is already approaching pre-reform levels of per capita GDP. Liberalization significantly increased factors' flexibility, enhanced some cost-effective processes. However, if the relative level of Russia's index of institutional quality, dissemination of information technologies (IT) and huge outflows of human and financial resources are factored in, Russia's overall comparative performance turns to be no better than for the lower middle income countries. More vigorous pro-reformpolicies, including intensive institution-building, human capital and IT upgrading, can and should be realized to cope with internal problems and challenges of the new century.
INTRODUCTION
Three centuries have passed since the beginning of Peter's the Great reforms aimed at rapid modernization and westernization of Russia. How come, that, in contrast to the advanced and not a tiny part of developing, mostly Asian, economies (China, India, South Korea, Taiwan etc.), Russia under pre-communist, communist, and post-communist regimes, despite many attempts, considerable efforts, hecatomb of sacrifices and some palpable achievements in science and culture, – and that is a real puzzle, – was (and is) actually failing to generate productivity (and knowledge) based Modern (intensive) Economic Growth and to carry out at least substantial part of a genuine catch-up development with the West? In what follows we will focus our remarks on this puzzle and a few myths, concerning Russian long-term economic evolution1.
WAS THERE MODERN ECONOMIC GROWTH IN THE IMPERIAL RUSSIA?
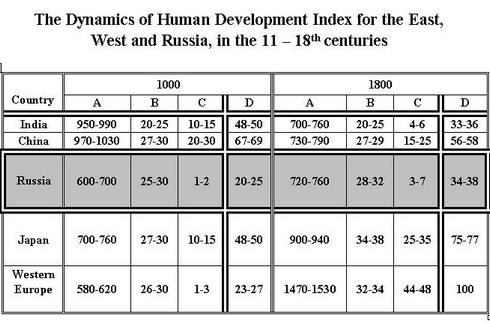
Some tentative estimates and calculations (see Table 1)2 show that at the start of the second millennium Russia was comparatively poor, although it did not lag (much) behind Western Europe. At the same time per capita income levels and the levels of urbanization in China, Middle East and India had been one and a half or two times greater, and the levels of literacy rates had been 5 to 10 times higher than in Russia and Western Europe (without Spain). Very rough figures demonstrate that literacy rates in Western Europe and Russia had not surpassed 2 to 3 percent, but they probably ranged from 10 to 15 percent in India and the Middle East and from 20 to 30 percent in China.
The main factors that had held up Russia's development were not only and not so much harsh climate3, huge distances and poor communications4, but unfavorable institutions. The social system that emerged during nearly three centuries of Mongol yoke5 and had been operating in Russia from the 13th to the 20th century – was not feudal as it sometimes claimed. It had been despotic, coercive, arbitrary regime. The state had eventually subdued the society and annihilated the remnants of freedom and liberties in North-Western and South-Western Russia. These factors hindered the building up and upgrading of physical and human capital, accounted for very low cultural level and resulted in a very low level of comparative productivity.
Some Russian and Western scholars are still captivated by Peter's the Great reforms and by the impulse he allegedly had given to the Russian economy and society.During a quarter of a century he had been trying, as is always in Russia – by paying horrific price, to ‘hack the window into Europe’. However, Peter the Great actually succeeded only in opening it slightly. Meanwhile, he threw open the door to ‘Asia’ by reinforcing serfdom, arbitrariness and despotism. These features proved to have a massive impact on Russia's subsequent development.
By the beginning of the 18th century the crop yields in Russia (3 centners per hectare) had been on average two times less than that in Western Europe and approximately 4 times less than in China, India and Egypt. The urbanization level had not surpassed 5 percent, while in the large countries of the East/South and West it ranged from 10 to 15 percent. The literacy rates in Russia did not exceed 2 to 5% of its adult population. This indicator was substantially, two-three times lower than in China and 4–6 times less than in Western Europe. As for GDP per capita in Russia it was, according to my retrospective calculations, 1.5 to 2 times less than that in Western Europe, and 1.5 times less than in India and China (Bairoch 1985: 233, 279, 288, 461–462, 513; Chao 1986: 58–59; Blanchard 1989: 282; Preobrajenski 1993: 51, 255, 310; Meliantsev 1996: 71–72, 84, 89).
So by the start of Russian modernizations (the first quarter of the 18th century), Russia's level of development was not between the West and (advanced countries of) the East, as it is often claimed, but much lower than both of them. Tentative calculation of Human Development Index (HDI)6, made on the data presented above, demonstrates that Russia's socio-economic and cultural level had been 2–2.5 times less than that in Western Europe and 1.5–1.7 less than in more or less advanced countries of the East.
Despite some widespread judgments, based on popular films, novels and popular histories of Russian monarchs, Russia's development (and per capita GDP growth) in the 18th century was comparatively unimpressive. There had been some advancement of the small modernizing sector – predominantly manufactures (on average in the 18th century annual growth rate of output in that sector reached 3.0–3.5%). But its share in Russian GDP (in 1770–1790s) did not surpass 3 to 5%. However, the average rate of output growth in agriculture, traditional segments of industry and services was very unstable and on the order of 1.0–1.2% a year. That is why during the 18th century per capita GDP growth rate had been substantially less than 0.3–0.4% a year. This figure was derived by I. Blanchard (Blanchard: 347, 354). On my calculations, it was no more than 0.1% per annum7. So, despite some attempts at modernization undertaken in Russia ‘from above’, Russia went on lagging behind the West (economically and culturally). In the 18th century annual growth rates of per capita GDP ranged there from 0.15% in France and Germany to 0.25% in Netherlands and Great Britain(Meliantsev 1996: 93).
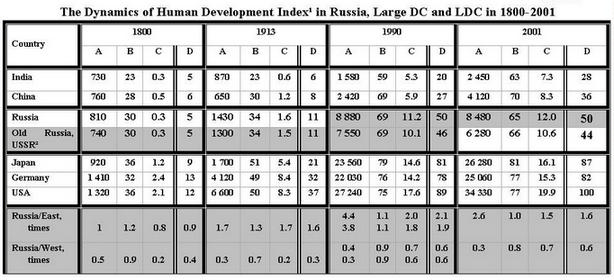
By 1800, GDP per capita in the Russian Empire was on average two times less and per capita industrial production – nearly two and a half times less than in Western Europe (see Table 2; Bairoch 1982: 294; Maddison 2001: 264). In spite of some efforts that had been undertaken by the Russian Imperial government to create the Academy of sciences, University and schools mostly for the children of noblemen, the average literacy rate of the population had been abysmally low – 2 to 6% among women and 4 to 8% among men (Mironov 1991: 135). It means that Russia lagged substantially not only behind European countries (by the start of the 19th century 40–50%). Russia's level of the average quality of human capital was lower than that of Japan (25–35% of its population were literate) and China (15–25%). The HDI demonstrates that at that time Russia's general level of development was between India and China (some 80% of the Chinese ‘standard’) and was respectively 1.8 times and 2.5 times less than in Japan and in the West8.
Having realized the scales of its backwardness (after Russia had suffered a devastating defeat in the Crimean war in 1853–1856), the tsarist regime decided to restart modernization, by carrying out peasant and other long-needed reforms, promoting capital formation, import-substituting industrialization in order to reinforce its economic, social and military basis. In spite of the apparent weakness of national entrepreneurship, the share of Gross Domestic Investment (GDI) in Russian GDP rose from 9–11% in 1885–1887 to 14–16% in 1911–1913 (calculations and estimates made on: Gregory 1982: 127; Pollard 1990: 76–77; Bovikin 1988: 66–67). It should be pointed out that the Russian average (GDI/GDP) for 1885–1913 (12–14%) was, however, 1.5 times lower than in Germany, the USA and Japan.
One can not also ignore the rise in the share of total (private and government) expenditures on education, health (and R&D) in Russian GDP: from 0.6–0.7% in 1885 to 0.9–1.0% in 1900 and 1.5–1.7% in 1910–1913. However, this indicator was substantially smaller than in more advanced countries: in 1910–1913 in the USA this indicator reached 2.5–2.7% GDP, in Japan 2.8–3.2%, in Germany 3.1–3.4% GDP (calculations based on: Gregory 1982: 56–57, 133–134; Meliantsev 1996: 118).
In 1885–1913 the share of Human Intangible Capital in Total (Physical plus Human) Capital in Russia increased from 12–15% to 20–25% and became higher than in large less developed countries of the South (5–9%). However, in 1913 Russia's indicator was not much greater than that of the Western countries at the start of their industrialization (approximately in 1800). By 1913 this indicator in advanced countries (including Japan) was already equal to one third of their Total Capital (Meliantsev 1996a: Table 2).
In Russia the share of population engaged in various forms of education augmented from 0.15–0.20% by the end of the 18th century to 0.6–0.7% in 1855, 2.0–2.2% in 1890 and 4.7–4.9% in 1913. Nevertheless, by the beginning of the First World War this indicator for Russia was apparently 3.0–3.5 times lower than in the developed countries (in France 14%, in Germany 19%, in the USA 22%, in Japan 16%). Adult literacy rate was also progressing in Russia: from meager 13–15% in 1850s it increased to 21–23% in 1897 and 35–40% in 1915. It should be stressed, first, that these figures are for the European part of Russia. In the Russian Central Asian periphery this indicator did not surpass 1–3%. Second, the figures for the European part of Russia could not be considered to be impressive: Western Europe on average had already achieved this educational standard by the end of the 18th century (Seurot 1989: 30; Kahan 1989: 27, 169–171; Falkus 1972: 11).
My computations suggest that in the Old Russia there was acceleration in the average annual growth rates of per capita GDP from approximately 0.1% in 1720–1800 and possibly 0.0–0.05% in 1800–1860 to 0.10–0.15% in 1860–1870, 0.7–0.8% in 1870–1885 and 1.4–1.6% in 1885–1913. However, economic development in Old Russia was very lopsided. Traditional sectors did not match growth in rapidly modernizing sectors. The coefficient of instability in the growth of GDP (in 1885–1913 it was equal to 220–240%) was one and a half or two times higher than in the USA, Germany and Japan (calculations made on Preobrajenski 1993: 308, 310, 313; Solovieva 1990: 33, 67, 101, 107; Blackwell: 423–425; Kahan 1989: 11, 128; Gatrell 1986: 143; Gregory 1982: 55–59, 133–134).
During the last three decades of tsarist industrialization Russia underwent some structural transformations. The share of labor force engaged in agriculture declined from 3/4 in 1897 to about 2/3 in 1913–1914. However, by the beginning of the First World War Russia had actually attained only the proportion (of labor force engaged in agriculture), already achieved in Western Europe by the start of the 19th century. Russia's level of urbanization by 1913 (on estimates, 14–18%), was 1.5 to 2 times higher than in India and China. However, Russia's level was closer to these underdeveloped countries than to the West – 40–42% (Bairoch 1985: 288; Bovikin 1988: 118).
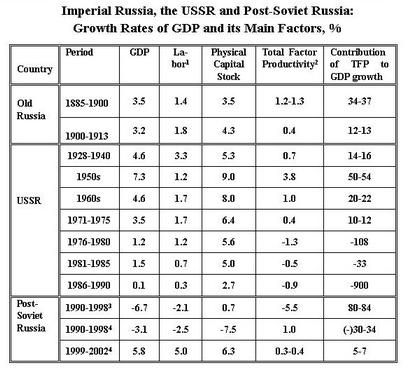
Comparatively rapid economic growth during the last decades of the Imperial Russia was based not only on the increase of total factor inputs (Physical Capital Stock, Labor): in 1885–1913 they accounted for some 3/4 of the GDP growth. Nearly one quarter of the GDP increase was due to productivity growth (see Table 3). However, the trend was not even. The average annual growth of TFP decreased from 1.2–1.3% in 1885–1900 to 0.3–0.5% in 1900–1913 and its contribution to the growth of GDP fell from 34–37% to 12–13%9. To assess adequately Russia's productivity achievement, it is important to stress that by the end of the 19th – beginning of the 20th centuries in the West and Japan the contribution of increase in productivity to GDP growth was on average two times higher. So, Russia's record of TFP growth and its contribution to GDP increase were actually closer to semi-peripheral and some peripheral countries.
By 1913, despite some progress achieved by Russia in its economic modernization, it failed to start catching up with the West. The gap in per capita GDP became three-fourfold. Russian HDI was only 1/3 of that in the West. But what is most striking are rapidly increasing absolute gaps in the main indicators of human development. In 1800–1913 the absolute difference in life expectancy at birth between the West and Russia increased from 4 (34–30) years to 16 (50–34) years. And the absolute gap in years of educational attainment rose from 1.9 (2.2–0.3) years to 5.8 (7.3–1.5) years10.
Summing-up, it should be pointed out that, first, Russia at the end of the 19th – beginning of the 20th century was in the process of embarking on the path of Modern Economic Growth. Russia's per capita GDP growth rates became considerably higher, although they remained very unstable. Second, the world was also changing, and expanding international competition compelled many advanced states to enhance conventional and human capital formation and enlarge productivity growth. Third, in order not to go on falling behind the West, Russia ought to have made a lot – in carrying out much ‘deeper’, comprehensive market-oriented reforms, in creating vital, sound institutions and activating civil society. However, up to the First World War its developmental model remained very unbalanced. There was great and rising divide between modern ‘westernized’ and traditional sectors and substantial income inequality (1% of the population possessed 16 to 20% of national income)11. The managerial, entrepreneurial and general cultural level of the Russian population was on average abysmally low. The war activated destructive forces in Russian society, which was not prepared for such an ordeal.
WHAT WERE THE REAL DIMENSIONS OF SOVIET ECONOMIC GROWTH?
Soviet experience is one of the most contradictory, dramatic and in essence tragic sagas in the world history. An extremely heavy legacy of nearly ¾ a century of the ‘command’ system, which capitalized on enthusiasm and expectations of the cheated people and set up quasi-military and one of the most coercive social mechanisms, has had and is still having a deep depressive effect on the process of transition in post-Soviet Russia and in the former Soviet republics.
Despite voluminous literature, devoted to recalculations of Soviet economic growth (see Kudrov 1998), the last decade has witnessed new attempts (M. Harrison, UK; R. Allen, USA–Canada, and others) to reassess the economic record of the USSR. Some of them included upward corrections. Many scholars are once again reworking index numbers. They take into account previously closed archival sources, especially on the dynamics of military industrial complex12. The average annual growth rate of Soviet GDP for 1928–1940 was ‘raised’ by A. Maddison to 5.1%, by M. Harrison to 5.9% and by R. Allen to 6.3%13.
My tentative estimate for this period is the average of my three rough calculations. They are based on the weighted sum of annual growth rates of production in main sectors of the economy (agriculture 0.3%, light industry 3 to 4%, heavy industry 12 to 13%, services 3.5 to 4.0%)14. The resultant figure is about 4.6%. It is substantially higher than some of the earlier unofficial estimates (by C. Clark, A. Bergson), lower than the data of M. Harrison and R. Allen, and close to A. Maddison's estimate15. I linked my index of Soviet GDP growth for the 1930s to the indices of A. Maddison, which are corroborated by the data of S. Ruoholo and K. Kholodilin (see Maddison 1998: 313; Ruoholo 2000: 33, 36; Kholodilin 1997: 75).
This recalculation did not reveal the ‘hidden’ dynamics of the Soviet economic system. Due to enormous sacrifices, initiated by the command system, which was ruthlessly ‘devouring’ its human, natural and capital resources and set up uncompetitive economic mechanism, average annual growth rates of per capita GDP hardly increased more than by one and a half times: from 1.5% per year in tsarist Russia in 1885–1913 to some 2.2–2.4% in 1913–1990. Soviet ‘record’ of economic growth was really far from the best. The USSR was surpassedby Japan and Taiwan (3.3–3.5%), South Korea, Italy, Norway, Portugal, Turkey, Iran, Venezuela, Brazil, Sweden and Greece (2.4–2.9%; calculated on Maddison 1995: 194–206). It is useful to remember that their economic growth, in contrast to the Soviet growth, was full of much value as it was primarily determined by the outplay of market forces.
The economic growth of the USSR was to a very great extent propelled by the rise in investment ratio. Although precise comparative statistics of the absolute and relative dimensions of capital formation in the USSR remain to be not very accurate, approximate calculations seem to demonstrate that the share of Gross Investment in GDP rose rather steeply – from 12–14 % in 1909–1913 to 14–18 % in 1928, 25–33% in 1930s and 33–37% in 1970–1980s. As for defense expenditures, they increased from 4–5% of GDP in 1913 to about (or even more than) 15–20% in 1980s (calculated from Gregory 1982: 56–57, 185–186; Maddison 1989: 66; Gould 1972: 143; Ofer 1987: 1788; Bergson 1989: 171; Easterly, W. and Fischer, St. 1995: 348). The combined share of gross investment and military expenditure in the GDP apparently tripled in 1913–1980s – from 17–19% to 50–60%. By this share the USSR probably surpassed the Western countries two times.
If to net out these tremendous (and largely excessive) expenditures, one might find out that per capita private consumption in the USSR could have increased by 1.4–1.6% per annum or tripled during 77 years. This is, without any exaggerations, a rather unimpressive performance. ‘Under-consumption’ brought about many acute deficits in the Soviet command economy and was among the key factors that caused deterioration in productivity, quality standards and moral decay.
It should be emphasized that the Soviet government on the whole did a lot to upgrade educational and health levels (not only in Russia, but in the former Soviet republics as well). It resulted in doubling of life expectancy at birth in the USSR (from 34 years in 1913 to 69 years in 1990). The average years of educational attainment of the adult population increased nearly 6–7 times – from 1.5–1.6 to 10–11 years. However, the USSR and Russia did not catch up with the West and Japan, as their record of educational attainment at that time was already substantially greater (14 to 17 years, adjusted for quality; see Table 2). Moreover, the quality of services in health and education and of practical knowledge in the USSR left much to be desired. By the beginning of the 1990s in Germany and the USA skilled and highly competitive manpower made up some 70 to 80%, in the USSR (and Soviet Russia) it did not surpass 15 to 17% (Rakitov: 15).
Despite substantial rise in physical and human capital formation that occurred during the soviet period, the structure of total capital stock (TCS) in Russia/USSRin 1913–1990 has barely changed. The share of human capital in TCS increased only slightly – from 22–24% to 25–27% and the physical capital remained the crucial element (3/4) of the Soviet economic structure. Despite certain success achieved in enhancing human capital, enormous resources were deployed in order to enlarge physical capital, military might of the Soviet empire, which to a substantial extent were financed by oil revenues. As a result, by the structure of its TCS, the USSR in the 1980s was much closer to developing than to developed countries, which (and primarily the USA) were apparently speeding up the transition from mature industrial to knowledge based economy (Meliantsev 1996a: Table 2).
In the last two or three decades of the Soviet regime, despite enormous efforts, colossal (economic, ecological and human) costs, economic growth was definitely fading out (see Table 3). TFP growth was rapidly decreasing. It has already become meager in the first part of the 1970s and then turned to be negative. Excluding the years of war and postwar recovery, the average TFP growth for the Soviet period (0.7–0.9%) did not surpass on the whole the record of the late tsarist Russia (1885–1913). The contribution of productivity to GDP growth (on average 1/5) was almost three times less than in advanced countries and substantially (1.5 to 2 times) less than in some large developing countries (in India and China in 1980–1990s).
Having caught up with the advanced countries in some segments of technical and military production and having obtained rather good results in educational and health indicators (as a result, in 1913–1990 Russian/Soviet HDI related to that of developed countries doubled – from 29–31% to 59–61%), the USSR failed to make progress in catching-up with the developed countries by GDP per capita. The relative gap with the advanced countries remained the same – approximately 29–31% (see Table 2). However, if to net out military and investment expenditures from conventional GDP, the Soviet adjusted GDP per capita related to that of the developed countries has decreased from 28–30% in 1913 to 16–18% in 1990.
Thus, Soviet catch up development process with the advanced countries was extremely contradictory and in many vital spheres it was a failure. The Soviet model was in many respects more unbalanced and cost-ineffective than the paradigm of the tsarist industrialization. Devoid of real market mechanism, it lacked flexibility and adaptability. After a rather long period of decay the system collapsed, leaving behind heavy economic, social, cultural and institutional legacy.
TRANSITIONAL DECADE (1992–2002): TAKING STOCK OF ECONOMIC PERFORMANCE16
In the 1990s increasingly unworkable and persistently ‘unreformable’ Soviet system was subjected to radical, although largely haphazard and painful transformation. As a result, by the beginning of 2001 the private sector accounted for nearly 3/5 of the total Russian capital stock, 3/4 of the total number of Russian registered enterprises and 70% of the measured GDP17. However, poor protection of property rights, legal uncertainties, arbitrary regulations, very poor functioning of the rule of law as well as the destruction of traditional commercial links with countries in Eastern Europe and former republics of the FSU and loss of other external markets were among the main factors that caused a painful shock and a huge contraction in GDP and investments (see O'Driscoll et al. 2001: 21, 315–316; Aslund 1999: 19–20; Ellman; Lucas; Popov 2001).
According to official data, in 1991–1998 real measured GDP curtailed by 42–43%. This was aggravated by collapse in the volume of gross investment (in 1991–1998 – by 83–86%); rapid rise in external debt (from $60 billion in 1990 to $183.6 billion, or 62% of Russian GNP in 1998), substantial outflow of capital, rapid des-industrialization in production, employment and export structures, considerable deterioration of the physical capital stock (average age of the industrial equipment rose from 10.8 in 1990 to 17.9 years in 1999)18.
As for deterioration in the social sphere, it should be pointed out, first of all, the phenomenon of depopulation, brought about by long-term demographic processes that had already been under way in Russia before the start of the reforms, as well as by the effects of deep economic and social crisis of the 1990s; decline in life expectancy at birth (from 69.6 years in 1989 to 65 years by 2000); substantial increase of the share of Russian population, living in poverty – from 5 to 10% in 1987–1991 to approximately 28–30% in 1999–2000. Gini index (measuring the distribution of money income) has risen from 0.260 in 1991 to 0.390–0.400 in 1998–200019.
However, some amendments should be made to this, rather dismal picture of Russia's transition. Having reassessed Russia's recent economic performance (1991–2002), using Törnqvist-Divisia index numbers' formula as well as Augmented Solow Production Function, I have come to the following conclusions:
1) Despite considerable social, demographic and economic sacrifices, Russia is already approaching pre-reform levels of per capita GDP;
2) Output fall was substantially less than is generally believed;
3) Liberalization significantly increased factors' flexibility, enhanced cost-effective processes. Calculations suggest that on the whole in 1991–1998 Total Factor Productivity might not have diminished: the decline in Total Factor Inputs (TFI) was, perhaps, greater than in GDP (see Tables 2 and 3).
After the default of 1998, followed (up to 2003) by devaluation of ruble, increase in external competitiveness, enhancement of the import-substituting processes and rise in oil prices, Russia's GDP started to grow. So, external factors were very important for economic rebound. However, calculations based on data in purchasing power parities (PPP) demonstrate, that the increase of the internal demand, activated, among other factors, by tax cuts, more vigorous and consistent government policy, resumption in investment growth accounted for no less than 75% of Russia's GDP growth in 1999–2002. But in general the quality of economic growth is rather poor (low-tech, almost no high-tech) and its underpinnings are still very shaky. This growth is hardly accompanied by any substantial increase in TFP (see Table 3).
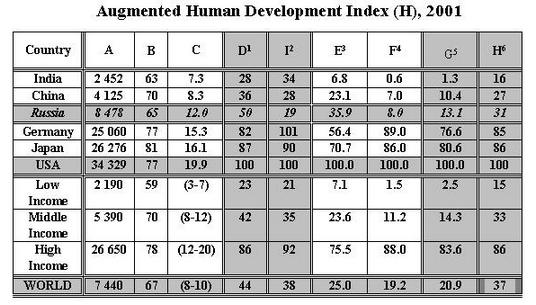
To assess more accurately Russia's contemporary level of development, I have used not only Ordinary HDI (OHDI, Table 2), but also constructed Augmented HDI (AHDI, Table 4), which includes two additional ingredients, reflecting the crucial factors of modern socio-economic and technical potential. The fourth element of the AHDI is the index of institutions quality, being produced by recalculating and normalizing (the USA = 100) the data presented by D. Kaufmann, A. Kraay, and M. Mastruzzi. It encompasses the extent of government effectiveness, political instability, rule of law, graft and other indicators.
If according to OHDI, Russia in 2001 was in the middle of world spectrum (50% of the US level, and its place was a little bit higher than for middle income countries, 42%, weighted average for the world was 44%), index of institutions quality (IIQ), reveals a different picture. Russia's index (19%) is substantially worse than in India (34%) and China (28%), nearly two times less than the average for middle income countries and the world average and even less than the average for low income countries (21%)20. As for developed countries, their IIQ turned out to be higher than OHDI.
The quality of institutions is, perhaps, one of the major determinants of development, affecting the behavior of the flows of different types of capital and the efficiency of their use. Institutions, especially informal institutions, which are rooted in the country's culture, evolve slowly but matter hugely (see Ritzen and Woolcock 2000: 23, 31–32; Thomas et al. 2000: ch. 6, 7; Shleifer and Treisman 2000: ch. 9; Easterly 2001: ch. 11, 12; Bulding Institutions 2001).
The information revolution has substantially modified our life. I have calculated two indices, characterizing the dissemination of traditional means of communication (E) – radios, television sets, telephone mainlines, and of relatively new means of communication (F) – mobile telephones, Internet users, computers. In 2001 the first index (E) in Russia (36%) was one and a half times higher than the average for the middle income countries (24%), although it was 2 times less than in advanced countries (75–76% of the USA). But index ‘F’ (dissemination of the new means of communication etc.) in Russia (8% of the USA) practically matched the index of overpopulated China (7%), it was lower than the average for middle income countries (11%) and 2 to 3 times lower than the world average.
Information technologies are, of course, developing in Russia, but their level is substantially lower than in the advanced countries: the share of high tech in GNP is 6 to 12% in developed countries and only 0.6% of Russia's measured GNP. Due to the collapse in the investment process during most of the 1990s, new technologies are now being introduced only in 5% of the machine-building industry. And absolutely new ‘work outs’ total no more than 1/5 of these costs. Russia's share in the world high-tech/scientific production is only 0.3%. It is significantly less than Russia's share in world population – 2.4% and in the World Gross Product (WGP) – 2.6–2.8% (in 1989 the share of the USSR and East European countries in WGP reached 12–14%), in world total investment and world trade – 1.2–1.4% (in 1989 the corresponding share of the USSR was equal to 3–3.5%)21.
The Augmented HDI(AHDI, see Table 4) reveals that Russia's position on the world scale (31% of the U.S. index) is substantially ‘smaller’ than that shown by Ordinary HDI (50%). It is important to stress that, due to significantly lower indices of Institutional quality (lower than the average for low income countries) and of Dissemination of communications (lower than the average for middle income countries), Russia's AHDI turned out to be now closer to lower middle income countries.
CONCLUSION
Russia's current and long-term modernization problems stem not only (and not so much) from its relatively inconvenient geographical position, as it is often claimed – harsh climate, huge distances, poor communications and unfavorable geopolitical factors (see Lynch 2002). They are mainly caused by permanent government delay or reluctance to carry out timely restructuring of outdated institutions as well as by the fact that Russia has been perpetually under-governed, although it was often over-regulated at the same time22. Russian governments used to be strong for quelling dissidents and too weak or/and too greedy to provide good public goods – benevolent order, reliable infrastructure, as well as predictability and consistency in policies.
Without effective rule of law and very small accountability of the Russian state to Russian society – this feature is predominant in Russian history – rent-seeking and perpetual uncertainty will keep on hampering capital formation, innovations and cause degradation, massive outflow of financial and human capital.
After the 20th century Russian hecatomb of nearly 100 million people, Russians actually started to die out. They are now having increasingly unhealthy and shrinking population, with real (quality adjusted) levels of educational attainment that are partly overrated by post-Soviet statistics. Calculations suggest that during the last decade gross outflow of human capital (in the 1990s about 3 million of people – to Western Europe, North America and Israel) has been, possibly, even greater (on my estimate, it is roughly equal to 5–7% of Russian GDP per annum), than of financial capital(2–4% of GDP annually). However, taking into account that repayments of foreign debt amount to about 1.5–2.0% of the measured GDP, total outflow of financial capital is also great.It makes the country extremely vulnerable and dependent on exports of natural resources (oil, gas, metals). This factor in itself favors proliferation of rent-seeking and corruption23, although some efforts are being made to curtail their dimensions.
What seems imperative now in Russia as well as in most of advanced, transitional and developing countries, in the context of contemporary chaotic globalization and turbulent unfolding of ITR, is the bringing more actively a market-oriented developmental state back in: to realize considerable upgrading of legal and financial institutions (capable of ensuring some palpable stability, rule of law, predictability and flexibility in the economy, as well as consistency in the public policy)24; substantial improvement of human capital, and rapid dissemination in IT, as it is being done in developed and newly industrialized countries, in order to rebuild the oil-dependent economy into knowledge-based, highly competitive society.
NOTES
1 This paper is to some extent based on the authors' publications: Vostok i Zapad [East and West in the Second Millennium], 1996; Rossiia, kroupniie strany Vostoka i Zapada [Russia, Large Countries of the East and West], 1996a; Informatsionnaya revoliuzia [Information Revolution], 2000.
2 See also Maddison 2001: 264. Our estimates are backed up by calculations, based on the extrapolation of Russian per capita GDP from 1800 and 1700 using as proxies the A. V. Dulov's data on per capita energy consumption in Russia from the 15th to 17th and the 19th centuries, as well as the figures of the decrease in urbanization levels from approximately 6% in the 11th –12th centuries to 4–5% in the second half of the 17th century (see: Gatrell 1999: 90–91; Poliakov et al. 2000: 403).
3 Nearly 95% of Russian territories are located in latitudes to the North of the USA. Russia is also very far from the warm Gulf Stream. Because of the limitation of time for agrarian works (May-September, in Western Europe – March-November), Russia could be called a country of the risky agriculture. It hampered carrying out of experiments, innovations, drastically hindered the increase in livestock (the principal component of physical capital in pre-modern and traditional societies) and therefore severely impeded improvements of soils. (Milov 1998: 554–572; for discussion see Lynch 2002).
4 Up to the end of the 18th century there was no access to unfreezing seas. Russia was also deprived of ‘Roman legacy’ – including more or less functioning network of roads.
5 In the period from 800 to 1237 A.D. nomadic attacks on Russia took place one time in four years. But later, in 1240–1462 A.D. Russia experienced 200 raids and attacks – nearly every year. (Animitsa et al. 1995: 45).
6 For formula see Table 1.
7 Calculation is a weighted average of per capita growth rates of the earlier mentioned sectors of the Russian Economy. (Preobrajenski 1993: 18–21, 25, 51, 283, 313; Yatsunski 1973: 83, 283–285; Blackwell 1968: 421–422; Kahan, 1985: 8, 46, 49, 114, 364). Sectors' shares in GDP are based on the estimates made by B. F. I. German and L. V. Tengoborsky (see Vainstein 1969: 33; Ptuha 1955: 362–363).
8 Calculated on the data given in the text and in the table 2.
9 After the Russian peasant revolution and Stolypin's reforms there was a recovery and a speed-up in growth of GDP (from 2.2% annually in 1900–1909 to 5.2% in 1909–1913) and of Total Factor Productivity (from (–) 0.6% to 2.2%), although this period of post-crisis acceleration was very short. (Calculations made on Gregory 1982: 56–57, 214, 269, 279, 309).
10 Calculated on the data and sources to Table 2. It is remarkable, that Japan did not surpass substantially Russia by per capita GDP, although this country was rapidly enhancing its human capacities. Longevity was at par with the West. Educational attainment (in years) was 3.5 times greater than in Russia and was equal to 70–75% of the western ‘standard’.
11 For the sake of comparison, it can be pointed out that in the USA in 1913–1919 1% of households possessed 13 to 14% of national income (calculations and estimates made on Vainstein 1969: 68–59; Gatrell 1986: 38; Kuznets 1966: 211).
12 According to some new estimates, the defense production in total Soviet industry grew from 2–3% in 1930 to 22–23% in 1940 and average annual growth rate of armaments' production (machine guns, rifles, artillery systems, warships, tanks, combat aircrafts) during that period ranged from 23 to 40% (see Davies et al. 1994: 298, 300).
13 See Maddison 1995: 154; Harrison 1992: 28–29; Allen 1998: 1081. R. Allen's estimates are the highest among mentioned above, because, as he pointed out, he had taken into account the effect of the rapid growth in durables, underestimated in previous calculations. Still he argues that much research should be done on the performance of ‘big unknown’ – military complex.
14 The weights are sectoral shares of production of 1937 (derived from P. Gregory and G. Ofer). The first system is based on the prices of 1928; the others represent different estimates of the current 1937 proportions in GDP distribution among sectors. The shares (weights) of agriculture, industry and services in GDP amount respectively in the first case to 0.49, 0.28 and 0.23; in the second case: 0.31, 0.45 and 0.24; in the third case: 0.29, 0.34 and 0.37. I assumed that in 1937 light industry was equal to 1/3 of the industrial production (see Gregory 1982: 185–186; Ofer: 1792; Davies et al. 1994: 205).
15 Despite some progress, achieved in reassessing Soviet economic growth of the 1930s, it is obvious, that this issue deserves more investigation.
16 This section is based on our paper ‘Russia (1991–2001): A Reassessment of Macroeconomic Performance in Comparative Perspective’ (Available at: http://casnov1.cas.muohio.edu/havighurstcenter/papers/meliantsev.doc).
17 Rossiiskii statistichesskii ezegodnik 2000: 269; Russia in Figures 2001: 157.
18 ‘Rossiiskii statisticheskii ezegodnik’ 2000: 16, 270, 316; Russia in Figures 2001: 32, 177; Russian Federation: Selected Issues, 2000: 29.
19 ‘Rossiiskii statisticheskii ezegodnik’ 2000: 53, 155; Russia in Figures 2001: 72, 99, 108.
20 Russia occupies 79th rank out of 91 ranks in corruption perception index, what corroborates the above mentioned feature of Russia's relative development.
21 Calculated from World Development Indicators, World Development Report, 2000–2003; Izvestia, 04/17/2001; NG-Nauka. 05/23/2001.
22 See Gatrell 1999. French poet Paul Valery said that ‘if the state is strong, it will crush us; if it is weak, we will perish’ (see Tanzi 1997: 4).
23 The data, collected by D. Kaufmann, A. Kraay, and M. Mastruzzi, suggests that some ingredients of composite index of institutional quality in Russia may have deteriorated in 1997/98 – 2000/01 (see Kaufmann et al. 2003: 98–115).
24 The crucial element about successful capitalism can be summarized as follows: only 45/161 countries enjoy high protection of property rights, while 116/161 countries – weak protection of property rights. So, no wonder that 70% of the world population is poor (Eiras, Ana: 2001. Don't Blame Capitalism, Argentina. Available at: http://www.heritage.org/views/2001/ed122801.html).
Table 1
Notes
1 Human Development Index (D) is calculated here according to a very simple formula. Dij – is the average non-weighted of three indices: Aij – is per capita GDP in PPP (international dollars 2001); Bij – life expectancy at birth; Cij – literacy rate of the adult population, – respectively for the country ‘i’ and the time ‘j’.
2 All these figures are related to the average level of Western Europe (as one of the most developed regions of the world by the end of the 18th century). Respectively the denominators are Ax, Bx and Cx.
D ij = {(Aij/Ax)*(Bij/Bx)*(Cij/Cx)}1/3
3 Source: Meliantsev, V. ‘Three Centuries of Russia's Endeavors to Surpass the East and to Catch Up with the West: Trends, Factors, and Consequences’ – available at . P. 39.
Table 2
Notes
1 Human Development Index (D) is calculated here according to a formula:
D ij = {(Aij/Ax)*(Bij/Bx)*(Cij/Cx)}1/3
Dij – is the average non-weighted of three indices: Aij – is per capita GDP in PPP (international dollars 2001); Bij – life expectancy at birth; Cij – educational attainment of the adult population, adjusted for quality, – respectively for the country ‘i’ and the time ‘j’. All the indices are related to the level of the USA in 2001. The denominators are respectively Ax, Bx and Cx.
2 These are the corresponding figures for the Russian Empire/USSR/former USSR.
Sources: Maddison, A., 2001, The World Economy. A Millennial Perspective, Paris, OECD. P. 264; Meliantsev, V., 1996, Vostok i Zapad vo vtorom tysiacheletii (East and West in the Second Millennium: Levels, Rates and Factors of Long-Term Comparative Economic Development). Moscow, Moscow State University Press, P. 145, 202; Meliantsev, V., 1996a, ‘Rossiia, kroupniie strany Vostoka i Zapada: konturi dolgovremennogo ekonomichesskogo razvitiia’ (Russia, Large Countries of the East and West: Contours of Economic Development in the very Long-Run), in Russia and the Surrounding World: Contours of Development. Moscow State University. The publishing Center of the Institute of Asian and African Studies, Table 1; World Bank. World Development Indicators, 2001–2003. Washington, D.C.; World Bank. World Development Report, 2001–2003.
Table 3
Notes
1 The dynamics of work hours was factored in for 1950–2002.
2 The elasticities of GDP with respect to labor and physical capital, derived from various studies, could have been as follows: 0.6 and 0.4 in 1885–1913; in 1928–1940 as well as in 1950–1990 they were 0.7 and 0.3 respectively and in 1990–2002 0.65 and 0.35.
3 Our calculation based on official data.
4 GDP is calculated using Tornqvist-Divisia chain index. The dynamics of Gross Capital Stock was corrected for obsolescence and capacity utilization. The dynamics of Labor was corrected for quality (based on the index of educational attainment for the adult population).
Sources: most of the figures for the USSR are not from official publications as they are, as it is known, flawed. Our calculations for Russia and the USSR are based on the various calculations and estimates, made by P. Gregory, A. Kahan, A. Maddison, G. Ofer, R. Allen, M. Harrison, K. Kholodilin; Statistical Yearbook of Russia, 1995, 2002–2002; Russia in figures, 2000–2002; RECEP. Russian Economic Trends, vol. 9, N 4, 2000; vol. 11, N 4, 2002. IMF. Russian Federation: Selected Issues. IMF. Staff Country Report N 00/150. Washington, D.C. November, 2000. P. 5, 29; World Bank. Global Economic Prospects, 2003. Washington, 2002; V. Meliantsev. Rossia, Kroupnii Strani Vostoka i Zapada: Konturi dolgovrewmennogo economicheskogo razvitia.
Table 4
Notes
1 Ordinary Human Development Index (D) is calculated here according to a formula: Dij = {(Aij/Ax)*(Bij/Bx)*(Cij/Cx)}1/3, Dij – is the geometric non-weighted average of three indices: Aij – is per capita GDP in PPP (international dollars 2001); B – life expectancy at birth, years; C – educational attainment of the adult population (in years), adjusted for quality, – respectively for the country ‘i’ and the time ‘j’. All these figures are related to the level of the USA in 2001. Respectively the denominators are Ax, Bx,Cx.
2 Iij – is Index of Institutional Quality, calculated as an arithmetic average of 6 component indicators from the data of D. Kaufmann, A. Kraay, and M.Mastruzzi (voice and accountability; political stability; government effectiveness; regulatory quality; rule of law; control of corruption).
3 Eij – is the average non-weighted relative index of dissemination of traditional means of communication (radios, television sets, telephone mainlines).
4 Eij – is the average non-weighted relative index of dissemination of comparatively new means of communication (mobile telephones), Internet, computers.
5 Gij = (Eij/Ex)1/3 *(Fij/Fx)2/3.
6 Hij = {(Aij/Ax)*(Bij/Bx)*(Cij/Cx)*(Iij/Ix)*(Gij/Gx) }1/5
Sources: Calculated on the data from table 1; Kaufmann, D., Kraay, A., Mastruzzi, M., 2003, Governance Matters III: Governance Indicators for 1996–2002. Washington, D.C. P. 98–115. (); World Bank. World Development Indicators, 2000–2003. Washington, D.C.; UNDP. Human Development Report, 2000–2003. N.Y.
REFERENCES
Allen, R.
1998. The Standard of Living in the Soviet Union, 1928–1940. Journal of Economic History, 58 (4): 1063–1089.
Animitsa, E. G., and Tertyshni, A. T.
1995. Ekonomitsheskii reformi v Rossii [Economic Reforms in Russia]. Ekaterinburgh: Izdatelstvo Uralskogo Gosudarstvennogo Universiteta.
Aslund, A.
1999. Why Has Russia's Economic Transformation Been So Arduous? Paper presented at the Annual World Bank conference on Development Economics, Washington, D.C., April 28–30. ().
Bairoch, P.
1982. International Industrialization Levels from 1750 to 1980. Journal of European Economic History 2: 269–333.
1985. De Jéricho à Mexico. Villes et Economies dans l`Histoire. Paris: Press Universitaires de la France.
Bergson, A.
1989. Planning and Performance in Socialist Economies. Boston: Unwin Hyman.
Besançon, A.
1988. The Russian Case, Europe and the Rise of Capitalism. Oxford: Oxford University Press.
Blackwell, W.
1968. The Beginnings of Russian Industrialization, 1800–1860. Princeton: Princeton University Press.
Blanchard, I.
1989. Russia's ‘Age of Silver’. Precious-metal Production and Economic Growth in the Eighteenth Century. New York: Routledge.
Bovikin, V.
1988. Rossiia nakanune velikih svershenii [Russia Before the Great Events]. Moscow: Nauka.
Building Institutions for Markets.
2001. World Development Report, 2002. Washington, D.C.: World Bank.
Chao, K.
1986. Man and Land in Chinese History. Stanford: Stanford University Press.
Clark, C.
1957. The Conditions of Economic Progress. London: Macmillan.
Davies, R., Harrison, M., and Wheatcroft, S. (eds.)
1994. The Economic Transformation of the Soviet Union, 1913–1945. Cambridge: Cambridge University Press.
De Broeck, M., and Koen, V.
2000. The Great Contractions in Russia, the Baltics and the Other Countries of the Former Soviet Union. IMF Working Paper 32: 1–38 ().
Dolinskaya, I.
2001. Explaining Russia's Output Collapse: Aggregate Sources and Regional Evidence. IMF Working Paper 16: 1–33. ().
Easterly, W., and Fischer, St.
1995. The Soviet Economic Decline. World Bank Economic Review 9: 341–371.
Easterly, W.
2001. The Elusive Quest for Growth. Cambridge, MA: The MIT Press.
Eidelman, M.
1992. Peresmotr dinamicheskih riadov osnovnih macroekonomicheskih pokazatelei [Reassessment of the Main Macroeconomic Indices]. Voprosi Statistiki 4: 19–26.
Ellman, M.
2000. The Russian Economy under El'tsin. Europe-Asia Studies 52: 1417–1432.
Falkus, M.
1972. The Industrialization of Russia, 1700–1914. London: Macmillan.
Fedotov, G. P.
1989. Rossiia i svoboda [Russia and Freedom]. Znamia 12: 198–214.
Gatrell, P.
1986. The Tsarist Economy, 1850–1917. New York: St. Martin's Press.
1999. Poor Russia: Environment and Government in the Long-Run Economic History of Russia. In Hosking, G., and Service, R. (eds.), Reinterpreting Russia (pp. 89–106). London: Oxford University Press.
Goskomstat
2002.Rossiiskii statistichesskii ezegodnik 2000–2002 [Statistical Yearbook of Russia]. Moscow: Goskomstat.
2003. Russia in Figures, 2001–2002. Moscow: Goskomstat.
Gould, J.
1972. Economic Growth in History. London: Methuen.
Gregory, P. R.
1982. Russian National Income, 1885–1913. Cambridge, Mass.: Cambridge University Press.
1997. Searching for Consistency in Historical Data. Alternate Estimates of Russia's Industrial Production, 1887–1913. The Journal of Economic History 57 (1): 196–202.
Harrison, M.
1992. Russian and Soviet GDP on the Eve of Two World Wars: 1913 and 1940. CREES Discussion Paper. Birmingham: University of Birmingham.
1993. Soviet Economic Growth since 1928. Europe-Asia Studies 1: 141–167.
Hosking, G., and Service, R. (eds.).
1999. Reinterpreting Russia. London: Oxford University Press.
IMF
2000. Staff Country Report N 00/150. Washington, D.C.
Kahan, A.
1985. The Plow, the Hammer, and the Knout: An Economic History of 18th century Russia. Chicago: University of Chicago Press.
1989. Russian Economic History. The Nineteenth Century. Chicago: University of Chicago Press.
Kaufmann, D., Kraay, A., and Zoido-Lobaton, P.
2002. Governance Matters II: Updated Indicators for 2000/01. Washington, D.C. (.).
Kaufmann, D., Kraay, A., Mastruzzi, M.
2003. Governance Matters III: Governance Indicators for 1996–2002. Washington, D.C. ()
Kholodilin, K.
1997. Ekonomichesskaya dinamika SSSR v 1950–1990 godah: opit ischislenniya edinogo ekonomichesskogo pokazatelia [The Economic Dynamics of the USSR: an Experience of Building Single Economic Indicator]. Voprosi Statistiki 4: 64–75.
Kudrov, V.
1998. Soviet Economic Performance in Retrospect: A Critical Re-examination. Groningen: Groningen Growth and Development Centre.
Kuznets, S.
1966. Modern Economic Growth. New Haven: Yale University Press.
Lucas, E.
2001. Putin's choice: Is Russia under President Putin heading for Regeneration, Stagnation or Decay. A Survey of Russia. The Economist (July) 21: 1–18.
Lynch, A.
2002. Roots of Russia's Economic Dilemmas: Liberal Economics and Illiberal Geography. Europe-Asia Studies 54: 32–44.
Maddison, A.
1989. L`économie mondiale au 20è siècle. Paris: OECD.
1995. Monitoring the World Economy 1820–1992. Paris: OECD Development Centre.
1998. Measuring the Performance of a Communist Command Economy: An Assessment of the CIA Estimates for the U.S.S.R. Review of Income and Wealth, Series 44: 307–323.
2001. The World Economy. A Millennial Perspective. Paris: OECD.
Meliantsev, V.
1996. Vostok i Zapad vo vtorom tysiacheletii [East and West in the Second Millennium: Levels, Rates and Factors of Long-Term Comparative Economic Development]. Moscow: Moscow State University Press.
1996a. Rossiia, kroupniie strany Vostoka i Zapada: konturi dolgovremennogo ekonomichesskogo razvitiia[Russia, Large Countries of the East and West: Contours of Economic Development in the very Long-Run]. In Fridman, L. A. (ed.), Russia and the Surrounding World: Contours of Development (pp. 116–146).Moscow State University: The publishing Center of the Institute of Asian and African Studies.
2000. Informazionnaya revoliutsia, globalizatsia i paradoxi sovremennogo economicheskogo rosta v razvitih i razvivaiuchichsia stranah [Information Revolution, Globalization and Paradoxes of Modern Economic Growth in the Developed and Developing Countries]. Moscow State University: The publishing Center of the Institute of Asian and African Studies.
2002. Russia (1991–2001): A Reassessment of Macroeconomic Performance in Comparative Perspective. Available at: ()
Milov, L. V.
1998. Velikorusskii Pahar i osobennosti rossiiskogo istoricheskogo processa [Great Russian Ploughman and Peculiarities of Russian Historical Process]. Moscow: Rosspen.
Mironov B. N.
1991. Istoriya v cifrah [History in figures]. Leningrad: Nauka.
O'Driscoll, G., Holmes, K., and Kirkpatrick, M.
2001. Index of Economic Freedom. The Heritage Foundation. Washington, D.C. (Available at .)
Ofer, G.
1987. Soviet Economic Growth: 1928–1985. The Journal of Economic Literature 4:1767–1833.
Poliakov, Y. A., Vodarski, A. E., and Kabuzan, V. M.
2000. Naselenie Rossii v XX v. Istoricheskie ocherki [Russian Populatiuon in the 20th century. Historical essays]. Vol. 1. Moscow: Nauka.
Pollard, S.
1990. Typology of Industrialization Processes in the Nineteenth Century. New York: Harwood Academic publishers.
Popov, V.
2001. Russia: Inconsistent Shock Therapy with Weakening Institutions. In Cornia, G., and Popov, V.(eds.), Transitions and institutions. Ch. 2 (pp.29–54). New York: WIDER.
Preobrajenski, A. A. et al. (eds.)
1993. Istoria krestianstva Rossii s drevneishih vremen do 1917 [The History of the Russian Peasantry from the Old Times to 1917]. Vol. 3. Moscow: Nauka.
Ptuha, M. V.
1955. Ocherki po istorii statistiki v SSSR. [Essays on the History of Stratistics in Russia]. Moscow: Nauka.
Rakitov, A.I.
1992.Tsivilizatsiya, kultura, technologiya i rinok [Civilization, Culture, Technology and Market]. Voprosi Philosophii 5: 3–15.
Ritzen, J., and Woolcock, M.
2000. Social Cohesion, Public Policy, and Economic Growth: Implications for Countries in Transition. Address prepared for the Annual Bank Conference on Development Economics (Europe). Paris, June, 2000. ( )
Ruoholo, S.
2000. Sovetskii ekonomitchesskii rost v retrospecrtive: otsenki metodologii raschetov [Soviet Economic Growth in Retrospective: an Assessment of the Methodology of Calculations]. Voprosi Statistiki 1: 28–42.
Russian Federation: Selected Issues.
2001. Russia's Reforms: Lurching Ahead. The Economist November, 29th.
Seurot, Fr.
1989. Le système économique de l’URSS. Paris.
Shleifer, A., and Treisman, D.
2000. Without a Map: Political Tactics and Economic Reform in Russia. Cambridge, MA: MIT Press.
Solovieva, A. M.
1990. Promishlennaya revolutsiya v Rossii v 19 v. [Industrial Revolution in Russia in the 19th century]. Moscow: Nauka.
Tanzi, V.
1997. The Changing Role of the State in the Economy: A Historical Perspective. IMF Working Paper 114: 1–28.Washington, D.C. ().
Thomas, V. et al.
2000. The Quality of Growth. Washington, D.C.: Oxford University Press.
2001. Transition. The First Ten Years. Washington, D.C.: The World Bank, Oxford University Press.
UNDP
2002. Human Development Report, 2001–2002. New York: Oxford University Press.
Vainstein, A. L.
1969. Narodni dohod Rossii i SSSR [National Income of Russia and the USSR]. Moscow: Nauka.
UNDP
2003. World Development Indicators, 1999–2002. Washington, D.C.: World Bank.
Yatsunski, V.
1973. Socialno-economicheskaya istoriya Rossii 18–19 vv. [Social and Economic History of Russia in the 18th and 19th centuries]. Moscow: Nauka.