Advances in Development Reverse Global Inequality Trends

Journal: Journal of Globalization Studies. Volume 4, Number 1 / May 2013
In recent decades countries have gone through unprecedented growth in human development. In 1980 there were 2 countries with a human development index near to or higher than 0.90, now there are 22. It is a well-established fact that growth in human development is positively related with economic growth. Largely as a result of this correspondence, Ranis posited a positive feedback loop between countries with high economic growth and human development (a ‘virtuous cycle’) and countries with stagnant or negative economic growth and human development (a ‘vicious’ cycle). Using longitudinal statistical analysis we show that there is an ‘old model’ of the relationship between human development and economic growth that supports the existence of these cycles and a ‘new model’ that refutes them. This is good news since the vicious-virtuous cycles imply that the rich get richer and the poor get poorer whereas the ‘new model’ shows a conditional and eventual absolute convergence between rich and poor countries in terms of human development. We show that this change is due to two factors: the rise in middle and high developed countries and the high rates of economic growth and human development among somewhat poor and mid-level countries. Our findings correspond to those published in Nature by Myrskyla, Kohler and Billari (2009) demonstrating that for countries at the high end of the human development index (HDI), between 0.85 and 0.95, there occurs a reversal of the previously well-established negative, development-fertility relationship. Our research, supportive of Myrskyla et. al's findings, demonstrates a more complex relationship between HDI and economic growth rates than previously thought and that socio-cultural factors independent of economic or human development should be taken into account to construct a fuller model of rates of change in economic and human development.
Keywords: global inequality, human development, economic growth, convergence.
The relationships between human development and economic growth have already been a subject of substantial research (Sen 1985, 2000; Streeten 1994; Ramirez, Ranis, and Stewart 1998; Boozer et al. 2003; Ranis 2004; Afzal et al. 2009; Özcan and Bjørnskov 2011; Conceição, Mukherjee, and Nayyar 2011; Cox, Arkoubi, and Estrada 2006; Poveda 2011; Tridico 2007). The main findings of this research may be summarized as following:
Economic growth is positively development; it is one of its major determinants (Ramirez, Ranis, and Stewart 1998: 3–8; Boozer et al. 2003; Ranis 2004, etc.).
Indeed, logarithm of per capita gross national income correlates almost perfectly with the Human Development Index (HDI) values (see Fig. 1).
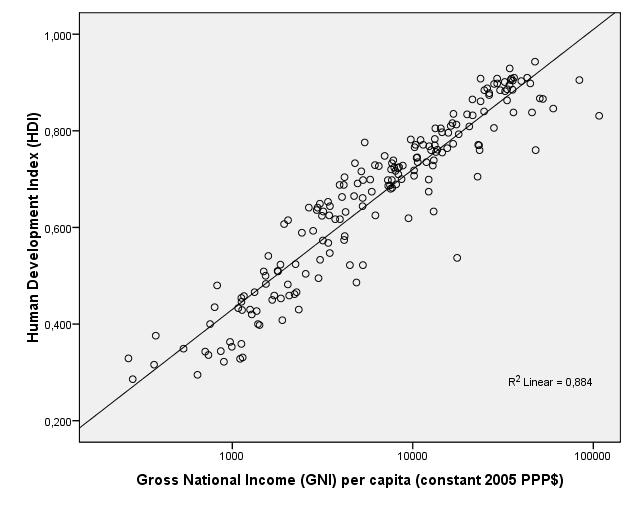
Fig. 1. Correlation between decimal logarithm of per capita national income (in 2005 PPP $) and the Human Development Index for 2011
Note: r = 0.940, p << 0.0001, R2 = 0.884. Data source: Klugman 2011: 127–130.
Of course, there is a substantial degree of autocorrelation here, as per capita GNI is one of four components that are used for the HDI calculation according to the current methodology (Klugman 2011: 167–173).
However, the economic prosperity (measured through per capita GNI) also demonstrates very strong correlations with all the other HDI components – life expectancy at birth, mean years of schooling, and expected years of schooling (see Figs 2–4).
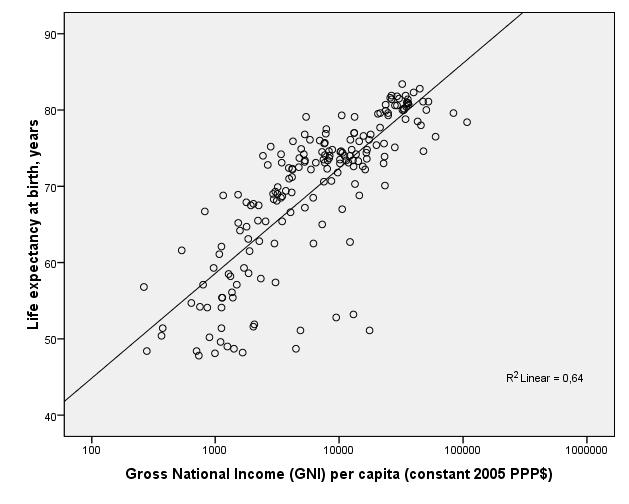
Fig. 2. Correlation between decimal logarithm of per capita national income (in 2005 PPP $) and life expectancy at birth for 2011
Note: r = 0.800, p << 0.0001, R2 = 0.640. Data source: Klugman 2011: 127–130.
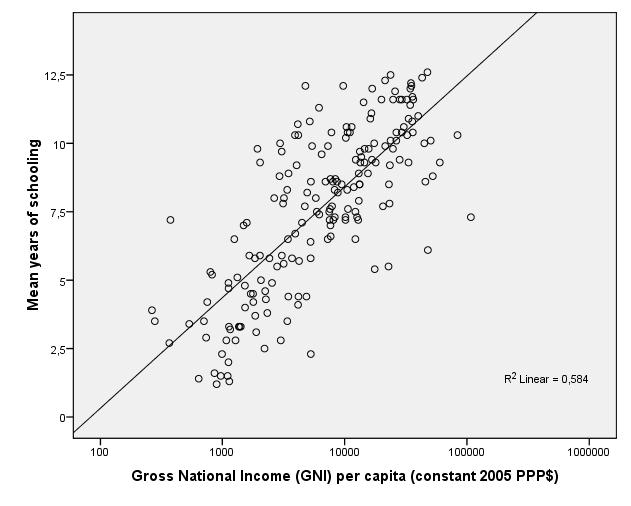
Fig. 3. Correlation between decimal logarithm of per capita national income (in 2005 PPP $) and mean years of schooling for 2011
Note: r = 0.764, p << .0001, R2 = 0.584. Data source: Klugman 2011: 127–130.
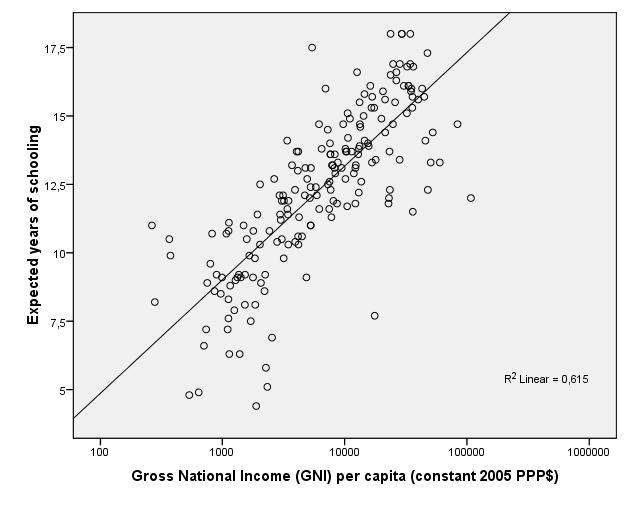
Fig. 4. Correlation between decimal logarithm of per capita national income (in 2005 PPP $) and expected years of schooling for 2011
Note: r = 0.784, p << 0.0001, R2 = 0.615. Data source: Klugman 2011: 127–130.
It also demonstrates an even stronger correlation with ‘nonincome HDI’ (computed on the basis of human development subindices excluding per capita GNI; hence, in this case all the autocorrelation present in the first correlation above [Fig. 1] is eliminated, see Fig. 5).
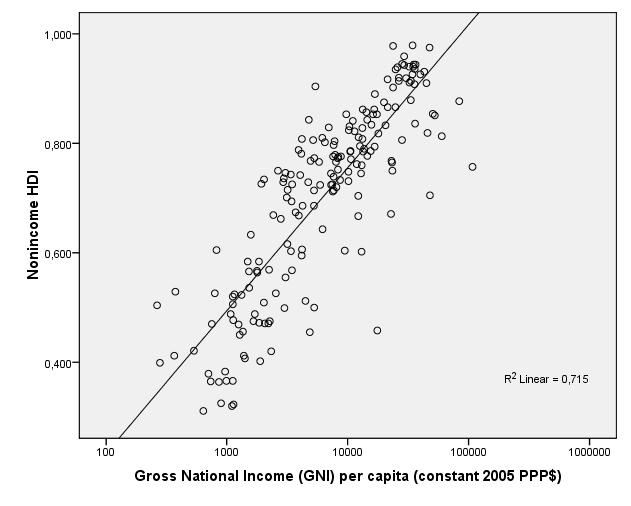
Fig. 5. Correlation between decimal logarithm of per capita national income (in 2005 PPP $) and the ‘nonincome’ Human Development Index for 2011
Note: r = 0.846, p << 0.0001, R2 = 0.615. Data source: Klugman 2011: 127–130.
In general, there is a strong consensus that economic growth tends to affect human development positively. ‘Income growth clearly strikes one as the main contributor to directly increasing the capabilities of individuals and consequently the human development of a nation since it encapsulates the economy's command over resources’ (Ranis 2004: 3; see also Sen 2000). For example, while the citizens of the Indian state of Kerala have life expectancies and literacy rates comparable to those of many developed countries, the fact that they cannot enjoy many of the benefits of citizens of such countries (such as better housing, transportation, or entertainment) demonstrates the importance of GDP as an instrument for achieving a wide range of capabilities. Many researchers have observed the importance of higher income ‘facilitating achieving crucial human development objectives’ as well as having ‘an indirect effect on human development’ (Ranis 2004: 3; see also, e.g., Afzal, Butt, and Rehman 2009; Dash and Sahoo 2010; Dao 2011;Alderman et al. 1996; Moore 2006, etc.).
On the other hand, it has been shown that human development also has a positive effect on economic growth. Indeed, as people become healthier, better nourished and educated they contribute more to economic growth. Higher levels of HD are not only an end in themselves but also indirectly effect economic growth by enhancing people's creative and productive capacities (see Ramirez, Ranis, and Stewart 1998: 9; Ranis, Stewart, and Samman 2006; Korotayev, Malkov, and Khaltourina 2006; Cox, Arkloubi, and Estrada 2006; Korotayev 2009; Afzal et al. 2009; Özcan and Bjørnskov 2011; Poveda 2011; and Tridico 2007 for evidence supporting the positive influence of human development on economic growth).1
The above discussion suggests that we should expect a positive correlation between Human Development Index values and economic growth rates. If we take a closer look at the relationship between HDI and economic growth rates longitudinally, by decades and five-year periods, we see that the predicted positive correlation holds up for the 1980s (see Fig. 6).
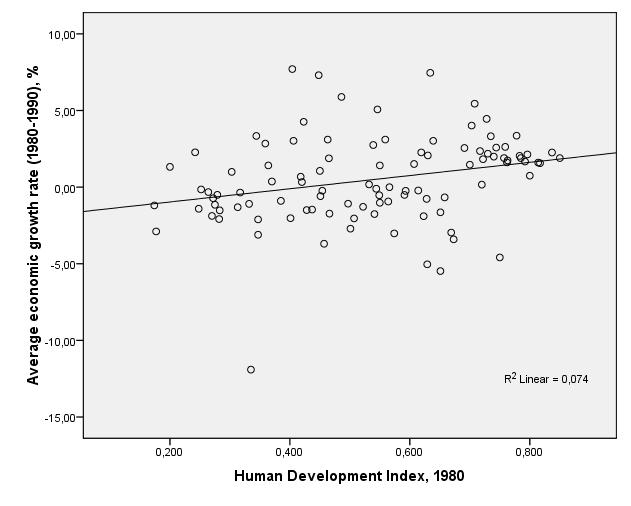
Fig. 6. Correlation between Human Development Index and Average Growth Rate (1980–1990)
Note: r = 0.271, p = 0.006.
Data sources: Klugman 2011; World Bank 2013. The economic growth rate here and elsewhere was calculated as the average annual growth rate of per capita GDP (counted in 2005 international purchasing power parity [PPP] dollars) for respective periods.
This correlation becomes substantially weaker for the 1990s, but it still remains significant (see Fig. 7).
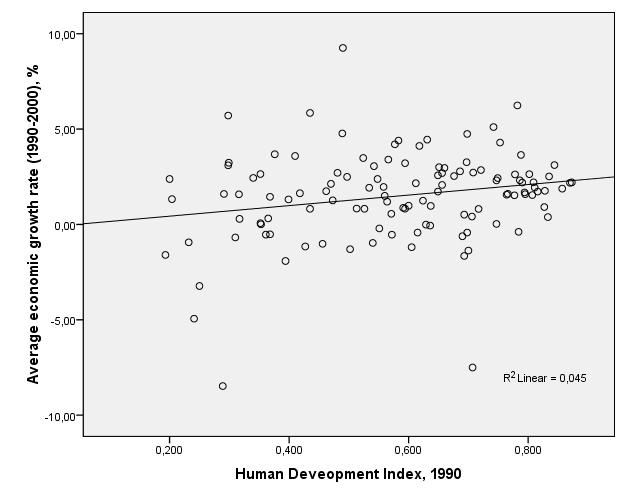
Fig. 7. Correlation between Human Development Index and Average Growth Rate (1990–2000)
Note: r = .21, p = .021 Data sources: Klugman 2011; World Bank 2013.
However, for the 2000–2005 period this correlation becomes negative (though insignificant) (see Fig. 8).
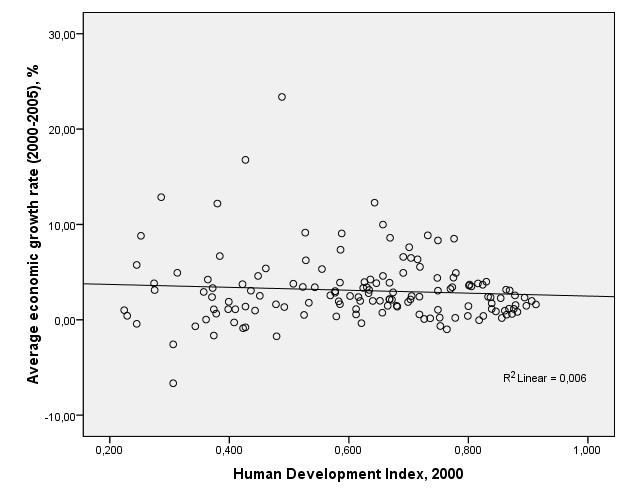
Fig. 8. Correlation between Human Development Index and Average Growth Rate (2000–2005)
Note: r = –0.079, p = 0.349. Data sources: Klugman 2011; World Bank 2013.
For the 2005–2010 period the correlation is not only negative, but also highly significant (see Fig. 9).
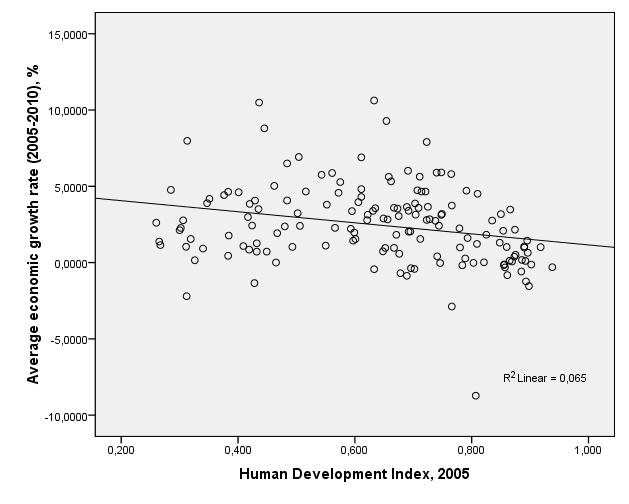
Fig. 9. Correlation between Human Development Index and Average Growth Rate (2005–2010)
Note: r = –0.255, p = 0.002. Data sources: Klugman 2011; World Bank 2013.
Thus, since 1980 (the first year for which UNDP presents HDI values according to its new computing system) we observe a rather pronounced downward trend in the correlations between the HDI and economic growth rates – indicated by the shift from a significant positive correlation in the 1980s to a significant negative correlation in the late 2000s (see Fig. 10).
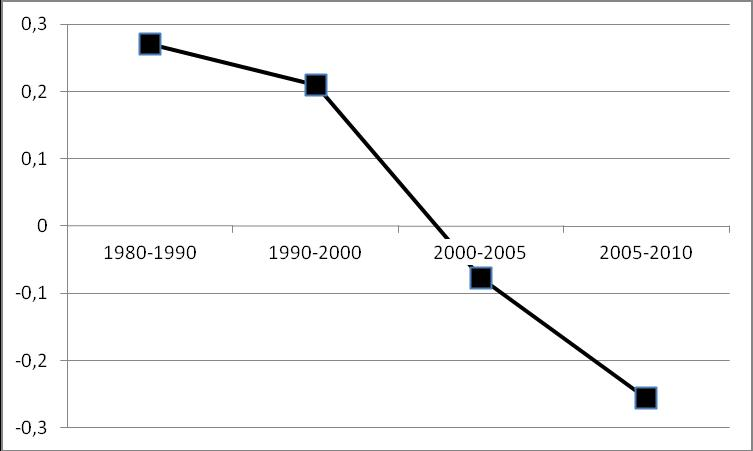
Fig. 10. Dynamics of the correlation between the Human Development Index Values and Economic Growth Rates, 1980–2010
Note that the relationship between HDI and economic growth for 2005–2010 is actually curvilinear (see Fig. 14). In general, a problem with the above graphs is that they presume a uniform relationship between HDI and economic growth across countries regardless of HDI level. In fact, for 2005 we still observe a positive (albeit rather weak) relationship between HDI and economic growth for low- and middle-HDI countries in the 0.250–0.675 range (see Fig. 11).
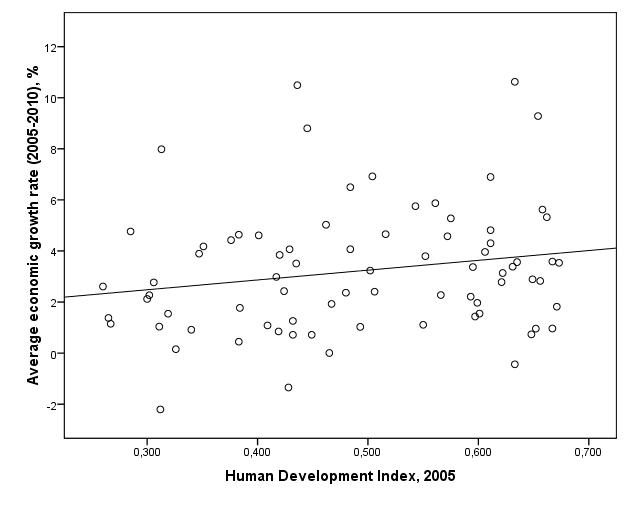
Fig. 11. Correlation between Human Development Index and Average Growth Rate in the 0.250–0.675 range (2005–2010)
Note: r = 0.194, p = 0.045 (1-tailed). Data sources: Klugman 2011; World Bank 2013.
On the other hand, for the right-hand part of the diagram (that is for middle and high-HDI countries in the 0.6–0.95 range) we observe a much higher and rather significant negative correlation (see Fig. 12).
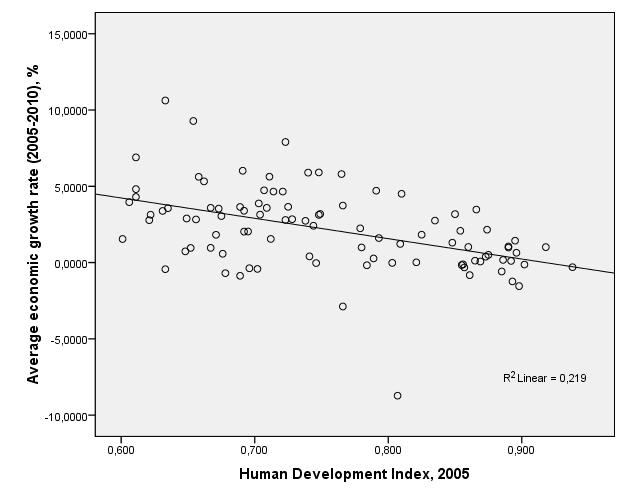
Fig. 12. Correlation between Human Development Index and Average Growth Rate in the 0.60–0.95 range for 2005–2010
Note: r = –0.468, p = 0.000001. Data sources: Klugman 2011; World Bank 2013.
Note that the overall pattern turns out to be rather similar to the correlation between HDI and Total Fertility Rates (TFR) discovered by by Myrskyla, Kohler and Billari (2009).
In August 2009, Mikko Myrskyla, Hans-Peter Kohler and Francesco C. Billari published in Nature their striking finding of a curvilinear relationship between fertility rates and the Human Development Index (HDI). Their findings demonstrated that for countries at the tail end (between 0.85 and –0.95) where countries with the highest HDI are clustered there was a reversal of the previously negative, development-fertility relationship, Instead, for these countries, their findings indicate that ‘further development’ can lead to increasing fertility rate (Myrskyla, Kohler, and Billari 2009: 741) (see Fig. 13).
Their findings might not be an isolated phenomenon as demonstrated by our investigations into the relationship between the Human Development Index and economic growth rates. Our findings show that the relationship between HDI and Economic growth rates changes depending on the level of HDI a nation has attained. Our research, supportive of Myrskyla et al.'s findings, demonstrates a more complex relationship between HDI and economic growth rates than previously thought and that socio-cultural factors independent of economic or human development should also be taken into account to construct a fuller model of rates of change in economic and human deve-lopment.
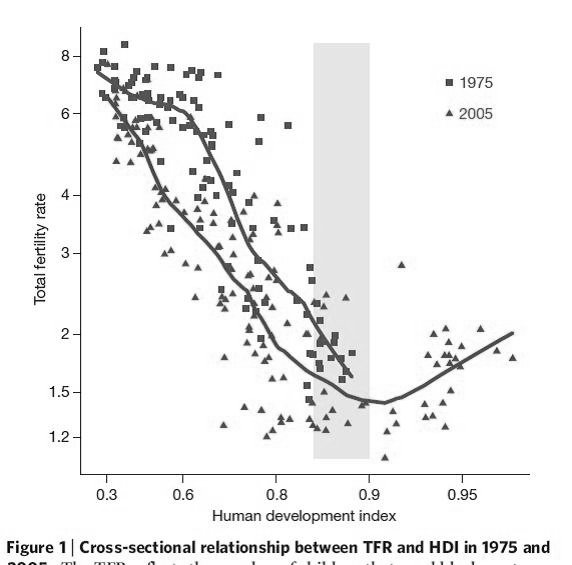
Fig. 13. Cross-sectional relationship between TFR and HDI in 1975 and 2005
Source: Myrskyla, Kohler, and Billari 2009: 741.
That is, in 1975 we observed a linear relationship between HDI and a respective variable for the whole HDI range, and now we discover that for 2005 there is, in fact, a curvilinear relationship whereby the old correlation persists among countries with low and low-middle HDI but not among countries with high-middle and high HDIs, which display a correlation directly opposite to the old one. There is, of course, a strikingly apparent reason for the recent finding of a curvilinear relationship between HDI and TFR as the ‘old’ (negative) relationship exists in the HDI range 0.3–0.9,2 while the ‘new’ (positive) relationship is found in a totally new range (one which no countries had reached in 1975). On the other hand, as regards the HDI – economic growth relationship, we find the ‘old’ (positive) relationship in HDI 0.15–0.6 ranges in both cases; however, with respect to the range beyond 0.6 Fig. 14 suggests that it is strongly negative for 2005–2010 and strongly positive for the 1980s.
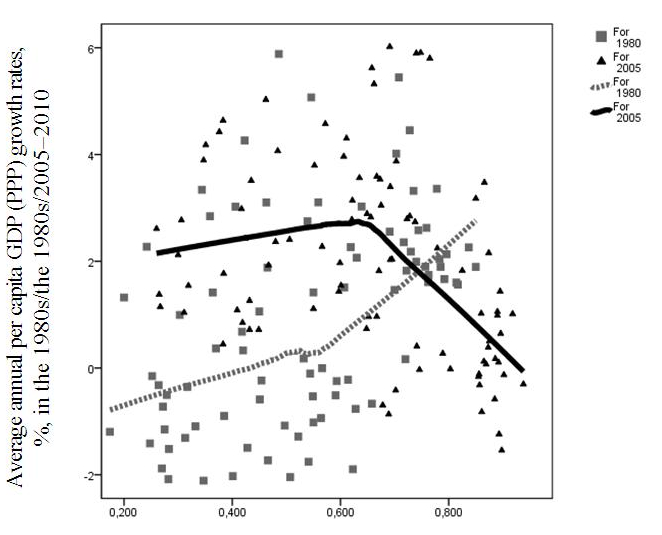
Fig. 14. Comparing HDI values and annual per capita growth rates for the 1980s and 2005–2010, a scatterplot with fitted LOWESS lines
However, a closer inspection of the dataset reflected in Fig. 14 indicates that the negative correlation between HDI levels and economic growth rates among the countries with the top HDI scores (over 0.7) can be also detected for the 1980s3 (see Fig. 15).
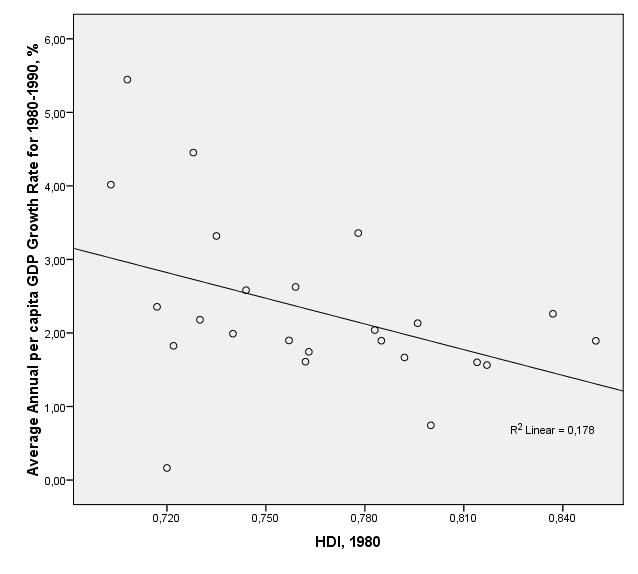
Fig. 15. Correlation between Human Development Index and Average Growth Rate in the > 0.70 range for the 1980s and HDI
Note: r = –.422, p = .04 (omitting an outlier [Argentine] that experienced a severe crisis in the 1980s due to some idiosyncratic causes).
Data sources: Klugman 2011; World Bank 2013.
However, the difference between the two cases still remains. In the case of the relationships between the HDI and TFR, the emergence of a correlation in a new direction is accounted for by the emergence of a considerable number of countries with HDI values > 0.9 by 2005. In the case of the relationship between the HDI and economic growth rates, the emergence of a salient negative correlation among the high-HDI countries is connected both with the growth of the number of countries with HDI scores4 higher than 0.7 and with the expansion of the negative correlation zone to the 0.6– 0.7 range. As a result, with regards to the HDI – TFR relationship, in 2005, the general (world-wide) negative correlation became substantially weaker than it was in 1975 but it still remained negative. With respect to the second case the overall positive correlation of 1980–1990 turns into an overall negative correlation by 2005–2010.
* * *
It might not be quite clear, but the change of the correlation between the HDI values and economic growth rates is actually good news as the positive correlation implies the growth of inequality between countries with regards to their human development levels (i.e., reflecting Ranis et al.'s vicious cycle) while the negative correlation implies a process of reducing inequality in HDI between countries.
The previous research surveyed earlier demonstrates that economic growth has a strong positive effect on the HDI. This implies that in countries with higher HDIs, HDI will grow at a faster rate than in countries with lower HDI which will lead to increasing the gap in human development between highly developed and less developed countries, that would lead in turn to growing divergence in the rates of economic growth, and so on. Of course, the perfectly positive relationship between HDI and economic growth rate would imply actual increasing returns and a positive feedback between those variables (‘virtuous cycle’). In fact, though such notions as ‘increasing returns’ and ‘positive feedback’ (‘virtuous cycle’) look intuitively very attractive, with respect to global development the respective phenomena actually imply just the growth of global inequality in human development, in general, and in per capita incomes, in particular. This was already noticed by Paul M. Romer (1985) who wrote that the model of increasing returns offered ‘an alternative view of long-run prospects for growth’ that was contrary to the assumptions of convergence theory: ‘per capita output can grow without bound, possibly at a rate that is monotonically increasing over time. The rate of investment and the rate of return on capital may increase rather than decrease with increases in the capital stock. The level of per capita output in different countries need not converge; growth may be persistently slower in less developed countries and may even fail to take place at all’ (Romer 1985: 1003). Thus a consistently positive feedback loop of increasing return would imply divergence rather than convergence of countries with different incomes – and growing rather than diminishing global inequality. Note that this was just the case in the 1980s when Romer's article was written.
On the other hand, the negative correlation we found implies that countries with lower HDIs tend to have higher economic growth rates than high-HDI countries and (due to the remaining strong positive correlation between per capita incomes and HDI) their HDI would tend to grow faster than the high-HDI countries – hence, the level of HDI inequality should tend to decrease over time. Indeed, as we see in Fig. 16, the global HDI inequality levels (calculated as the value of standard deviation from the mean) have tended to increase when the correlation in question was positive (that is, in 1980–2000) and tended to decrease when this correlation became negative (see Fig. 16).
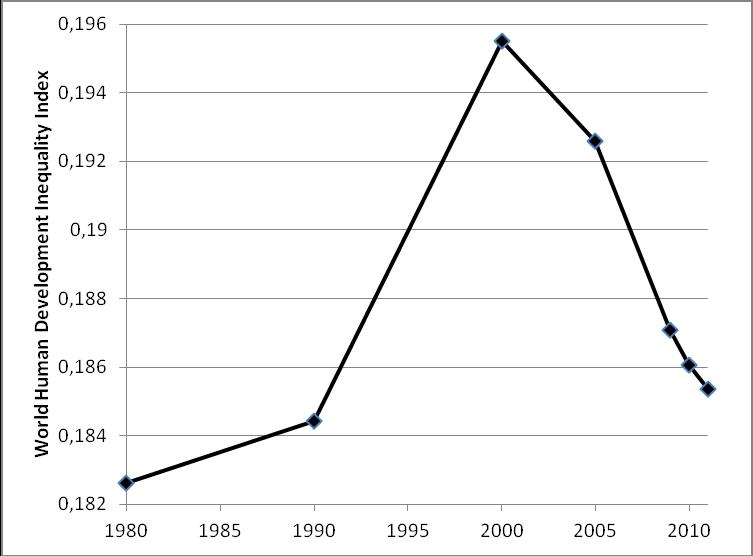
Fig. 16. World Human Development Inequality Index, 1980–2010
Data source: calculated on the basis of data published in Klugman 2011.
Above we presented a theoretical framework for explaining the grounds for expecting a positive correlation between HDI scores and economic growth rates; indeed we have argued that this has been a running theme of most articles that relate HDI and economic growth. So why then do we recently observe negative correlations? What theory may account for the recent negative correlation (between 2005–2010 especially) that we have demonstrated in this paper.
This new trend that we have described thus far can in part be accounted for by the phenomenon of convergence. The cornerstone for the theory of convergence was laid in an essay Economic Backwardness in Historical Perspective by Alexander Gerschenkron (1952), who developed the ‘theory of relative backwardness’ relying on data obtained from the history of European countries. The main tenet of his theory is as follows: ‘the opportunities inherent in industrialization may be said to vary directly with the backwardness of the country’ (Gerschenkron 1952: 6). Remarkably, Gerschenkron emphasized that the conditions inevitably required for a country to take advantage of its backwardness included ‘adequate endowments of usable resources’ and the absence of ‘great blocks to industrialization’ (Ibid.: 6). Thus, backward countries (provided that the outlined conditions are observed) were bound to grow faster than countries with developed economies, the former thus gradually converging with the latter. As Samuelson and Nordhaus put it,
poorer countries have important advantages that the first pioneers along the path of industrialization did not. Developing nations can now draw upon the capital, skills, and technology of more advanced countries Gerschenkron suggests that relative backwardness itself may aid development. Countries can buy modern textile machinery, efficient pumps, miracle seeds, chemical fertilizers, and medical supplies. Because they can lean on the technologies of advanced countries, today's developing countries can grow more rapidly… As low-income countries draw upon the more productive technologies of the leaders, we would expect to see convergence of countries toward the technological frontier. Convergence occurs when those countries or regions that have initially low incomes tend to grow more rapidly than ones with high incomes (Samuelson and Nordhaus 2005: 584).
The roots of the issue of unconditional convergence are also frequently traced to ‘A Contribution to the Theory of Economic Growth’ by Robert M. Solow (1956). This work is sometimes regarded as the pioneering one in laying the tenets for the hypothesis of unconditional convergence in the economic growth among the world countries (see, e.g., Abel and Bernanke 2005: 235).
As Mankiw notes,
the diminishing returns to capital [implied by the Solow model] have another important implication: Other things being equal, it is easier for a country to grow fast if it starts out relatively poor. This effect of initial conditions on subsequent growth is sometimes called the catch-up effect. In poor countries, workers lack even the most rudimentary tools and, as a result, have low productivity. Small amounts of capital investment would substantially raise these workers' productivity. By contrast, workers in rich countries have large amounts of capital with which to work, and this partly explains their high productivity. Yet with the amount of capital per worker already so high, additional capital investment has a relatively small effect on productivity. Studies of international data on economic growth confirm this catch-up effect: Controlling for other variables such as the percentage of GDP devoted to investments, poor countries tend to grow at faster rates than rich countries (Mankiw 2008: 258).
Abel and Bernanke note that according to the Solow model, if the economy is open, the absolute convergence gets support from some additional economic forces. Since poorer countries have less capital per worker and therefore a higher marginal product of capital than more affluent countries, investors from richer countries will be able to get greater profits by investing in poor countries. Therefore, foreign investment should provide a more rapid increase in capital stock in poor countries, even if the level of domestic savings in these countries is low (Abel and Bernanke 2005: 234).
It is easy to see that both the ‘Gershenkron’ factor and the ‘Solow’ factor for the faster growth of the peripheral (and especially semi-peripheral) economies are mutually complementary, as capital diffusion tends to be accompanied by technological diffusion (furthermore, capital diffusion is one of the main creators of channels for technological diffusion).
On the other hand, Solow's model implies that output levels per capita should be higher the higher the savings rate in the country or the lower the population growth rate.
Of course, as low income countries tend to have lower HDI and (according to the convergence theory) higher economic growth, the mechanisms above would also produce convergence of HDI scores through the positive influence of the economic development on the HDI growth. Note that in the 1980s and 1990s the convergence theory became the subject of intensive critique as many authors pointed out, rightly, that the global post-World War II pattern was one of general divergence rather than convergence (Romer 1985; Barro 1991; Desdoigts 1994; Lee, Pesaran, and Smith 1997, etc.). Indeed, this was generally the case through the 1950–2000 period (e.g., Malkov et al. 2010; Khaltourina and Korotayev 2010; Korotayev et al. 2010, 2011, 2012). The suggested failure of general (unconditional) convergence was attributed to different factors by various scholars, but human development factors figured prominently in their arguments. Barro (1991: 437) concluded that ‘the relatively weak growth performances of countries in sub-Saharan Africa and Latin America’ and their failure to catch up with the developed countries (i.e. the absence of absolute convergence) could be attributed to the lack of human capital development. Indeed, Barro demonstrated that in his data set of 98 countries during the period between 1960–1985, the growth rate of real per capita GDP was positively related to initial human capital. Cohen (1996: 351) stated that ‘the poor countries have failed to catch up with rich ones because the progress that they have achieved in educating their workers (which is evidenced in the convergence of domestic inputs) is not sufficient to compensate for their poor endowment in the knowledge on which the education of workers stands’. This research suggested the presence of conditional rather than unconditional convergence, which implies convergence among countries with similar basic characteristics, with human capital figuring prominently among those characteristics (e.g., Barro 1991; Mankiw, Romer, and Weil 1992; Cohen 1996). Note that by the 1980s we can already observe convergence among countries with high HDIs. Since that time, many more countries have moved to the HDI > 0.7 range. In general, with regards to human capital indicators, the gap between developing and developed decreased substantially between 1950 and 2000 (see Figs 17 and 18).
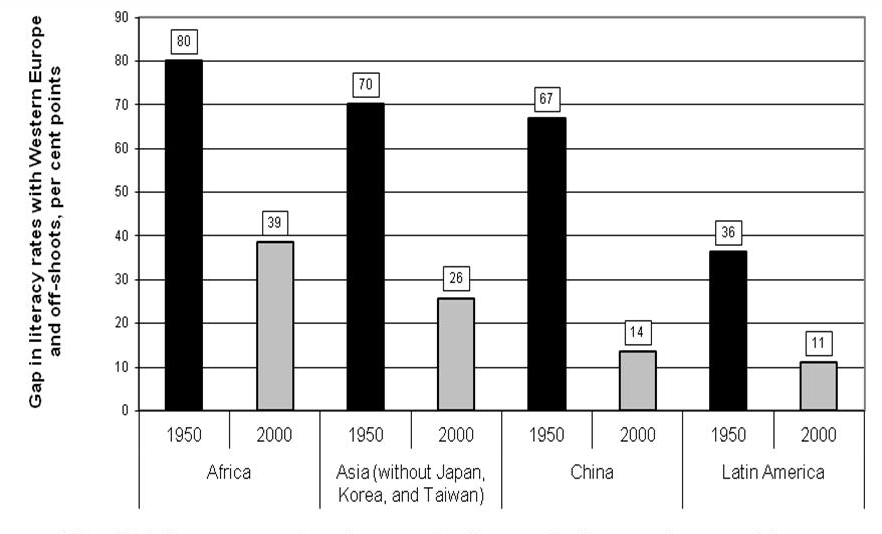
Fig. 17. The comparative decrease in the gap in literacy between Europe and developing areas of the world
Data source: Morrison and Murtin 2006.
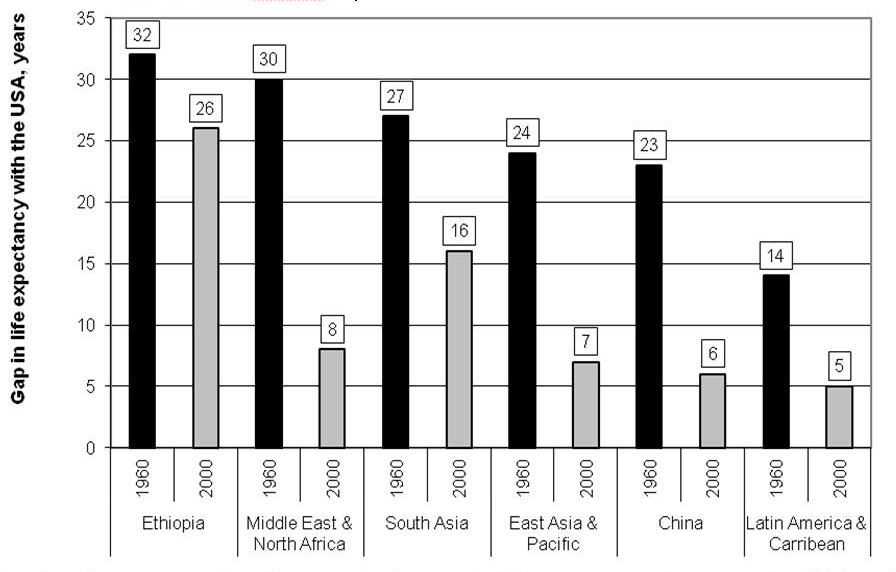
Fig. 18. The comparative decrease in the gap in life expectancy between the USA and developing areas of the world
Data source: World Bank 2013.
Thus the switch from the conditional to unconditional convergence pattern that we appear to be recently observing seems to be accounted for by the fact that by the late 1990s a very large number of countries began to satisfy (more or less) some major conditions of conditional convergence (see, e.g., Korotayev et al. 2010, 2011, 2012; Korotayev and Khaltourina 2009; Malkov, Korotayev, and Bogevolnov 2010; Khaltourina and Korotayev 2010; Malkov et al. 2010).
This, however, does not appear to account for the above-described growth of the convergence zone. Thus, in the 1980s, countries with 0.6 < HDI < 0.7 tended to grow slower than countries with an HDI > 0.7, whereas in recent years they grew faster (quite in accordance with convergence theory, but obviously there is still a high gap in human capital development level in comparison with advanced countries). One of the possible explanations can be connected to a sufficient degree of economic openness, which we noted is a condition of the conditional convergence model of economic growth (e.g., Ben-David 1993: 653; Sachs et al. 1995: 199 etc.). Indeed, Sachs et al. (1995) noticed a clear convergence pattern in 1970–1995 for countries with open economies. They maintain that ‘the absence of overall convergence in the world economy during the past few decades [before 1995] might well result from the closed trading regimes of most of the poorer countries’ (Sachs et al. 1995: 37). They present evidence indicating that the lack of convergence observed across the world in 1970–1995 can be ‘explained by the trade regime: open economies tend to converge, but closed economies do not. The lack of convergence in recent decades results from the fact that the poorer countries have been closed to the world’ (Ibid.: 3).5 Actually this finding seems to be quite congruent with classical convergence theories specified above. Indeed, according to those theories convergence is propelled by the movement of technologies and capitals from the more advanced higher-HDI countries to less advanced lower-HDI ones, where such a movement is much more likely among open economies. Note that by the early 21st century a very high number of developing and traditional economies had become much more open than before (among other things through the process that is usually denoted as globalization), which appears to be a major factor for the emergence of the general convergence pattern in the first decade of this century.
On the other hand, as Fig. 14 above (and Fig. 19 below) indicates, the highest economic growth rates in the recent decade tended to be observed in countries with middle levels of HDI. In low-HDI countries they were generally higher than in the high-HDI ones, but lower than in countries with middle HDI. This implies that the gap between middle-HDI countries (where most of the world population lives) and the high-HDI ones is decreasing (and this results in the overall convergence trend); but this gap is still growing between the middle- and low-HDI countries (and this makes the overall convergence trend much weaker than it would have been otherwise).
Note that those results are still rather congruent with recommendations produces by Ranis and his colleagues in their series of studies of the relationships between human development and economic growth (Ramirez, Ranis, and Stewart 1998: 3–8; Boozer et al. 2003; Ranis 2004):
If human development improvements are indeed a precondition for sustainable economic growth, government policy and public funding may be necessary to move a nation above the human development threshold level. Nations stuck in vicious cycles, or low-human development poverty traps may need targeted government investments to meet the fixed costs of human development improvements that will lead to later economic growth. These fixed cost investments may include schools, hospitals, and the necessary governance improvements to effectively implement investment projects. The crucial lesson that emerges is that the old-fashioned view of ‘grow first and worry about human development later’ is not supported by the evidence. Improving levels of education and health should have priority or at least move together with efforts to directly enhance growth (Ranis 2004: 10).
Addenda: But Was Not it all Just because of the Crisis?
One may, of course, argue that the positive correlation among middle- and high-HDI countries visible in Fig. 14 for 2005–2010 is entirely an artifact of the 2008–2009 crisis, and not a result of reversal of some deep inequality trends. Indeed, the advanced countries were struck by the crisis most painfully, whereas most developing countries fared much better during the crisis (see, e.g., Grinin and Korotayev 2010). However, Fig. 19 below indicates that a pattern visible in Fig. 14 for 2005–2010 could hardly be accounted for by crisis only, as an essentially similar pattern is also found for 2000–2005.
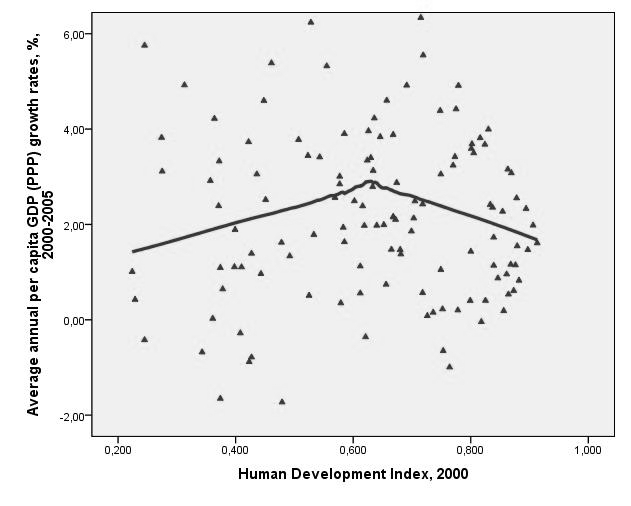
Fig. 19. Correlation between the HDI value in 2000 and average annual per capita GDP growth rates in 2000–2005, a scatterplot with a fitted LOWESS line
This indicates that our analysis of convergence between high and mid-level HDI countries and a second pattern of divergence in the economic growth rates between mid-level HDI countries and low level HDI countries is not a result of this economic crisis.
NOTES
[1] In fact, Ranis and his colleagues (Ramirez, Ranis, and Stewart 1998: 3–8; Boozer et al. 2003; Ranis 2004; Ranis, Stewart, and Samman 2006) demonstrate that the positive influence of human development on economic growth, on the one hand, and the positive influence of economic growth on human development, on the other hand, tend to form positive feedback loops that could result both in virtuous (more human development – faster economic growth – acceleration of human development – even faster economic growth) and vicious (decline of human development – decrease of per capita incomes – further decline of human development – a continuing decrease in per capita incomes – an accelerated decline of human development) cycles.
2 Note that the HDI scale employed by Myrskyla, Kohler and Billari is not quite identical with the one that we use. The point is that in 2010 UNDP changed the computing methodology for the calculation of the HDI, and, hence, the HDI scores published in Human Development Report 2011 (that we have used) are not quite identical with the ones used by Myrskyla, Kohler and Billari (Klugman 2011). Generally, the same countries tend to have significantly lower HDI scores in comparison with the older ones, hence, the difference between the ranges within which the trend reversal takes place in both cases is much smaller than the one that we apparently observe not taking this qualification into account.
3 Though the Locally Weighed Scatterplot Smoothing (LOWESS) technique employed in Fig. 14 was unable to capture this with those parameters that we used (Kernel: Epanechnikov; % of points to fit: 85).
4 We would like to remind the readers that we use HDI scores computed according to the new UNDP methodology introduced in 2010, whereas Myrskyla, Kohler and Billari used the old ones; whereas the same countries for the same years tend to have significantly lower HDI scores in comparison with the older ones.
5 Note that Sachs et al. quite remarkably state at this point: ‘This is now changing with the spread of trade liberalization programs, so that presumably the tendencies toward convergence will be markedly strengthened’ (Sachs et al. 1995: 3). As we see, this forecast has turned out to be quite correct.
References
Abel, A. B., and Bernanke, B. S.
2005.Macroeconomics. 5th ed. Boston, MA: Pearson/Addison Wesley.
Afzal, M., Butt, A. R., and ur Rehman, H.
2009.A Dynamic Analysis of the Relationship among Human Development, Exports and Human Development in Pakistan. The Pakistan Development Review 48(4): 885–920.
Alderman, H., Behrman, J., Khan, S., Ross, D. and Sabot, R.
1996. The Returns to Endogenous Human Capital in Pakistan's Rural Wage Market. Oxford Bulletin of Economics and Statistics 58(1): 29–55.
Barro, R. J.
1991. Economic Growth in a Cross Section of Countries. The Quarterly Journal of Economics 106(2): 407–443.
Ben-David, D.
1993. Equalizing Exchange: Trade Liberalization and Income Convergence. The Quarterly Journal of Economics 108(3): 653–679.
Boozer, M., Ranis, G., Stewart, F., and Suri, T.
2003. Paths to Success: The Relationship between Human Development and Economic Growth. Yale University Economic Growth Center Discussion Paper, 874. New Haven, CT: Yale University.
Cohen, D.
1996. Tests of the ‘Convergence Hypothesis’: Some Further Results. Journal of Economic Growth 1(3): 351–361.
Conceição, P., Mukherjee, S., and Nayyar, S.
2011. Impacts of the Economic Crisis on Human Development and the MDGs in Africa. African Development Review 23(4): 439–460.
Cox, B. J., Arkoubi, Kh. Al, and Estrada, S. D.
2006. National Human Resource Development. Advances in Developing Human Resources 8(1): 84–98.
Dao, M. Q.
2011. Changes in Human Development in Developing Countries: An Empirical Assessment. Perspectives on Global Development and Technology 10: 288–299.
Dash, R. K., and Sahoo, P.
2010. Economic Growth in India: The Role of Physical and Social Infrastructure. Journal of Economic Policy Reform 13(4): 373–385.
Desdoigts, A.
1994. Changes in the World Income Distributions: a Non-parametric Approach to Challenge the Neo-classical Convergence Argument. Berlin: Humboldt Universitaet Berlin.
Gerschenkron, A.
1952. Economic Backwardness in Historical Perspective. In Hoselitz, B. F. (ed.), The Progress of Underdeveloped Areas. Chicago, IL: University of Chicago Press.
Grinin, L. E., and Korotayev, A. V.
2010. Will the Global Crisis Lead to Global Transformations. 1. The Global Financial System: Pros and Cons. Journal of Globalization Studies 1(1): 70–89.
Khaltourina, D. A., and Korotayev, A. V.
2010. System Monitoring of Global and Regional Development. In Khaltourina, D. A., and Korotayev, A. V. (eds.), System Monitoring: Global and Regional Development (pp. 11–188). Moscow: Librokom/URSS. In Russian (Халтурина, Д. А., Коротаев, А. В. Системный мониторинг глобального и регионального развития. Системный мониторинг: Глобальное и региональное развитие / Ред. Д. А. Халтурина, А. В. Коротаев, c. 11–188. М.: Либроком/URSS).
Klugman, J. (ed.)
2011. Sustainability and Equity: A Better Future for All. Human Development Report 2011. Houndmills – New York: Palgrave Macmillan.
Korotayev, A. V.
2009. Compact Mathematical Models of the World System Development and Their Applicability to the Development of Local Solutions in Third World Countries. In Sheffield, J. (ed.), Systemic Development: Local Solutions in a Global Environment (pp. 103−116). Litchfield Park, AZ: ISCE Publishing.
Korotayev, A. V., and Khaltourina, D. A.
2009. Modern Trends of Global Development. Moscow: Librokom/URSS. In Russian(Коротаев, А. В., Халтурина, Д. А. Современные тенденции мирового развития. М.: Либроком/URSS).
Korotayev, A. V., Khaltourina, D. A., Malkov, A. S., Bogevolnov, J. V., Kobzeva, S. V., and Zinkina, J. V.
2010. Mathematical Modeling and Forecasting of World and Regional Development. 3rd ed. Moscow: LKI/URSS. In Russian (Коротаев, А. В., Халтурина, Д. А., Малков, А. С., Божевольнов, Ю. В., Кобзева, С. В., Зинькина, Ю. В. Законыистории. Математическое моделирование и прогнозирование мирового и регионального развития. 3-е изд. М.: ЛКИ/URSS).
Korotayev, A., Malkov, A., and Khaltourina, D.
2006. Introduction to Social Macrodynamics: Compact Macromodels of the World System Growth. Moscow: KomKniga/URSS.
Korotayev, A., Zinkina, J., Bogevolnov, J., and Malkov, A.
2011. Global Unconditional Convergence among Larger Economies after 1998? Journal of Globalization Studies 2(2): 25–62.
2012. Unconditional Convergence among Larger Economies after 1998? In Grinin, L., Ilyin, I., and Korotayev,A. (eds.), Globalistics and Globalization Studies (pp. 246–280). Moscow – Volgograd: Moscow University – Uchitel.
Lee, K., Pesaran, M., and Smith, R.
1997. Growth and Convergence in a Multi-Country Empirical Stochastic Solow Model. Journal of Applied Econometrics 12(4): 357–392.
Malkov, A. S., Bogevolnov, J. V., Khaltourina, D. A., and Korotayev, A. V.
2010. A System Analysis of the World Dynamics: Interaction of the World System Core and Periphery. In Akaev, A. A., Korotayev, A. V., and Malinetsky,G. G. (eds.), Forecasting and Modeling Crises and World Dynamics (pp. 234–248). Moscow: LKI/URSS. In Russian (Малков, А. С., Божевольнов, Ю. В., Халтурина, Д. А., Коротаев, А. В. К системному анализу мировой динамики: взаимодействие центра и периферии Мир-Системы. Прогноз и моделирование кризисов и мировой динамики / Ред. А. А. Акаев, А. В. Коротаев, Г. Г. Малинецкий, с. 234–248. М.: ЛКИ/URSS).
Malkov, A. S., Korotayev, A. V., and Bogevolnov, J. V.
2010. Mathematical Modeling of the Interaction of the World System Core and Periphery. In Akaev, A. A., Korotayev, A. V., and Malinetsky,G. G. (eds.), Forecasting and Modeling Crises and World Dynamics (pp. 277–286). Moscow: LKI/URSS. InRussian (Малков, А. С., Коротаев, А. В., Божевольнов, Ю. В. Математическое моделирование взаимодействия центра и периферии Мир-Системы. Прогноз и моделирование кризисов и мировой динамики / Отв. ред. А. А. Акаев, А. В. Коротаев, Г. Г. Малинецкий, c. 277–286. М.: Издательство ЛКИ/URSS).
Mankiw, N. G.
2008. Principles of Macroeconomics. 5th ed. Boston, MA: South-Western College Publishing.
Mankiw, N. G., Romer, D., and Weil, D. N.
1992. A Contribution to the Empirics of Economic Growth. The Quarterly Journal of Economics 107(2): 407–437.
Moore, W.
2006. A Graduate in Every Household: The Potential Impact of a Rise in the Number of University Graduates on Output in Barbados. Journal of Eastern Caribbean Studies 31(3): 27–38.
Morrison, Ch., and Murtin, F.
2006. The World Distribution of Human Capital, Life Expectancy and Income: a Multi-Dimensional Approach. Paris: OECD.
Myrskylä, M., Kohler, H.-P., and Billari, F. C.
2009. Advances in Development Reverse Fertility Declines. Nature 460: 741–743.
Özcvan, B., and Bjørnskov, Ch.
2011. Social Trust and Human Development. Socio-Economic Planning Sciences 40: 753–762.
Poveda, A. C.
2011. Economic Development and Growth in Colombia: An Empirical Analysis with Super-Efficiency DEA and Panel Data Models. Socio-Economic Planning Sciences 45: 154–164.
Ramirez, A., Ranis, G., and Stewart, F.
1998. Economic Growth and Human Development. Queen Elizabeth House Working Paper, 18. Oxford: Oxford University.
Ranis, G.
2004. Human Development and Economic Growth. Yale University Economic Growth Center Discussion Paper, 887. New Haven, CT: Yale University.
Ranis, G., Stewart, F., and Samman, E.
2006. Human Development: Beyond the Human Development Index. Journal of Human Development 7(2): 323–358.
Romer, P. M.
1986. Increasing Returns and Long-Run Growth. The Journal of Political Economy 94(5): 1002–1037.
Sachs, J. D., Warner, A., Aslund, A., and Fischer, S.
1995. Economic Reform and the Process of Global Integration. Brookings Papers on Economic Activity 1(25): 1–118.
Samuelson, P. A., and Nordhaus, W. D.
2005. Economics. 18th ed. Boston, MA: McGraw-Hill.
Sen, A.
1985. Well-Being, Agency and Freedom. The Journal of Philosophy 82(4): 169–221.
2000. A Decade of Human Development. Journal of Human Development 1(1): 17–23.
Solow, R. A.
1956. A Contribution to the Theory of Economic Growth. Quarterly Journal of Economics 70: 65–94.
Streeten, P.
1994. Human Development: Means and Ends. The American Economic Review 84(2): 232–237.
Tridico, P.
2007. Institutions, Human Development and Economic Growth in Transition Economies. The European Journal of Development Research 19(4): 569–593.
World Bank
2013. World Development Indicators Online. Washington, D.C.: World Bank. URL: http://web.worldbank.org/.