Globalization and the EU's Development Strategy, 1970–2007

Journal: Journal of Globalization Studies. Volume 4, Number 2 / November 2013
This study uses the KOF globalization index to investigate the development of globalization in recent decades. The index is decomposed into economic, social and political components. The analysis is based on a panel dataset consisting of 50 developed and developing countries observed during the period between 1970 and 2007. The index serves as a useful tool in comparing the globalization process among countries and how it has evolved over time. The focus here is on the EU's development strategy in the wake of the recent wave of globalization. The results show the evidence of large variations in the level and development of globalization and its underlying components across countries, regions and over time.
Keywords: development strategy, globalization, European Union.
1. Introduction
Globalization can be defined from various perspectives, not only with respect to economic activities, but also to political, technological, cultural interactions and with account of many key factors such as standardization, transportation, communication, trade, migration, etc. Here we focus on the economic aspect of globalization. Through the process, the (developed) economies become closer and more interrelated. As countries have been speeding up their openness in recent years, there have been increasing concerns related to globalization and its impacts on economic growth, poverty, inequality, regional differences, cultural dominance, environment, or economic integration. Countries have shown different development patterns and results which have become a source of inequality and poverty. In general there is agreement that globalization increases inequality but it reduces poverty while poverty's regional concentration increases. Such development has been observed in India and China.
Despite the increasing interest in the influence of globalization there are quite a few empirical studies examining such linkages. The limited empirical evidence is a result of lack of theoretical development, limited data and unsatisfactory measures of globalization. In addition to the mentioned limitations, currently there is no standard rule of measure and measurement method for globalization. The need for research in this area has attracted great attention. Several attempts have been made to quantitatively measure globalization. In recent years, several researchers have been developing methods of quantitative measurement of globalization. Different measures ranging from single measures like trade to multidimensional measures with different coverage of different aspects of globalization have been produced. The index can be used to compare international levels of globalization over time and across countries and regions to investigate international, interregional and intraregional comparisons of openness.
The main purpose of this study is to use the KOF globalization index to investigate international and interregional development of globalization in recent decades.1 The index is decomposed into economic, social, and political components. The analysis is based on a panel data consisting of 50 developed and developing countries observed during the period between 1970 and 2007. The results show the evidence of large variations in the level and development of globalization and its components across countries, regions and over time.
This paper is organized as follows. The literature is reviewed in Section 2, followed by a description of the used data and methods in Section 3. The development of the indices over time and regions are also illustrated and discussed. Sections 4, 5 and 6 discuss the summary statistics of the index values and the rankings of countries, the international and regional differences of globalization, and their temporal development. Finally, Section 7 summarizes the results and concludes this study.
2. The Review of Literature
The interest in and the amount of research on the relationships between globalization, economic growth, income inequality and poverty has been increasing in recent years. The growing interest is a result of the rapid development of international relations and the speed at which the recent wave of globalization is proceeding. The theoretical literature on each component is vast but the empirical evidence on the nature and causal relationship between the different interrelated factors of interest remains poor. Thus, there is an urgent need for further research and methodological development at different levels and on different aspects of globalization to shed light on these issues.
Recently, there have been a limited number of studies on different combinations of the links between key factors of interest and globalization. This review mentions only selected but representative ones. Aghion and Williamson (1998) study the links between globalization, growth and inequality, while Collier and Dollar (2001) add the poverty dimension as well. Manasse and Turrini (2001) examined the impacts of globalization on inequality through trade integration, while Miller (2001) argues that globalization leads to a significant increase in income inequality. Lindert and Williamson (2001) state that globalization has very different implications for inequality in a country. Talbot (2002) discusses the new and old styles of international inequality. The nineteenth century globalization was one of the most important reasons of increasing international inequality in the study of Bata and Bergesen (2002). Mussa (2003) examined issues related to the distribution of benefits from increasing globalization activity. In a collected volume by Nissanke and Thorbecke (2006), the impact of globalization on the world's poor by focusing on transmission mechanisms is presented.
Concerning measurement of globalization, Heshmati (2006a, 2006b) introduces two composite indices of globalization. The first is based on the Kearney/Foreign Policy (2002) magazine and the second is obtained from a principal component analysis. They indicate the level of globalization and show how globalization has developed over time for different countries. The indices are composed of four components: economic integration, personal contact, technology and political engagement, each generated from a number of indicators. The results show that a low rank in the globalization process is due to conflicts, economic and technology factors with limited possibility for the developing countries to affect it. The high ranked developed countries share similar patterns in the distribution of various components. The indices were also used in a regression analysis framework to study the causal relationships between income inequality, poverty and globalization. The results show evidence of a weak and negative relationship between globalization and income inequality and poverty. An important index of globalization based on similar methodology but comprehensive data is the KOF index presented below.
In previous studies the causal links between globalization, inequality, poverty and growth have been investigated in a two-step procedure. In the first step the globalization index is computed non-parametrically or parametrically, and in the second step the latter three are regressed on globalization to investigate the impact of globalization on the former ones. Heshmati and Lee (2010) introduced a new approach which is distinguished from the previous ones in that both of these steps are estimated parametrically and in a single step. The model is based on a multidimensional analysis of globalization, while some previous studies are often based on single and trade-related factors. In the new index, the contribution from each indicator, the shares of individual components and the aggregate composite index are configured by their relationship with economic development. For the matter of sensitivity analysis, two different methods, decomposed and composite models estimated iteratively, are used to compute the new globalization index and its variations. The indices are used to investigate their impacts on the economic growth and income inequality of the countries. The comprehensive and systematic regression analyses show that globalization is positively linked to economic growth, while it has a negative relationship with economic inequality in a restricted sense. The effects are confounded with unobserved regional effects. A high correlation between the proposed index and the previous globalization indices is observed.
3. The Data and Method
The database created by Kearney is the first unique data used for the computation of the globalization index. The data is a small panel data covering 62 countries observed during the period 1995 onwards which is updated on an annual basis. It was collected from various secondary data sources such as national sources and those obtained from international organizations. The index is composed of four main components. These are economic integration, personal contacts, technology, and political engagement selected to represent globalization.
The data used in this study is taken from the KOF Index of Globalization introduced in 2002 (Dreher 2006) and updated and described in Dreher et al. (2008). The 2009 index is based on an unbalanced panel data of 208 countries during the period from 1970 to 2007. The overall index covers the economic, social and political dimensions of globalization. There is high frequency of missing data for several developing countries. Globalization is defined as the process of creating networks of connections among actors through a variety of flows including people, information, ideas, capital and goods. The three dimensions of globalization are defined as:
- economic globalization, characterized as long distance flows of goods, capital and services as well as information and perceptions that accompany market exchanges;
- social globalization, expressed as the spread of ideas, information, images, and people;
- political globalization, characterized by a diffusion of government policies.
The economic globalization has two dimensions: actual economic flows, and the proxies for restrictions to trade and capital. The sub-index on actual economic flows includes data on trade, FDI and portfolio investment, while the second index refers to restrictions on trade and capital using hidden import barriers, mean tariff rates, taxes on international trade and an index of capital controls.
The social globalization is classified in three categories: personal contacts, data on information flows, and cultural proximity. Personal contacts include international telecom traffic, tourism and foreign population. Information flows include the number of internet users, the share of households with a television set, and international newspapers traded. Imported and exported books can ideally be used as proxy for cultural proximity. As additional proxy here the number of McDonald's restaurants located in a country is used.
To proxy the degree of political globalization the index uses the number of embassies and high commissions in a country and the number of international organizations of which the country is a member, the number of UN peace missions a country has participated in, and the number of treaties signed between two or more states since 1945.
In constructing the indices of globalization, each of the variables introduced above is transformed to an index on a scale of one to a hundred, where a hundred is the maximum value over the period 1970 to 2007 and one is the minimum value. Higher values denote a greater level of globalization. The values for calculating the sub-indices are determined parametrically using principal component analysis for the entire data. The analysis distinguishes the fluctuations of the variables used in each sub-group. The values are then determined in a way that maximizes the variation of the resulting principal component, so that the indices capture the variation as fully as possible. The same procedure is applied to the sub-indices in order to derive the overall index of globalization. Management of the data, transformation of indicators and treatment of missing values is further explained in Dreher et al. (2008). The components and the overall index are calculated employing the weighted individual data series instead.
4. Distribution of the Indices
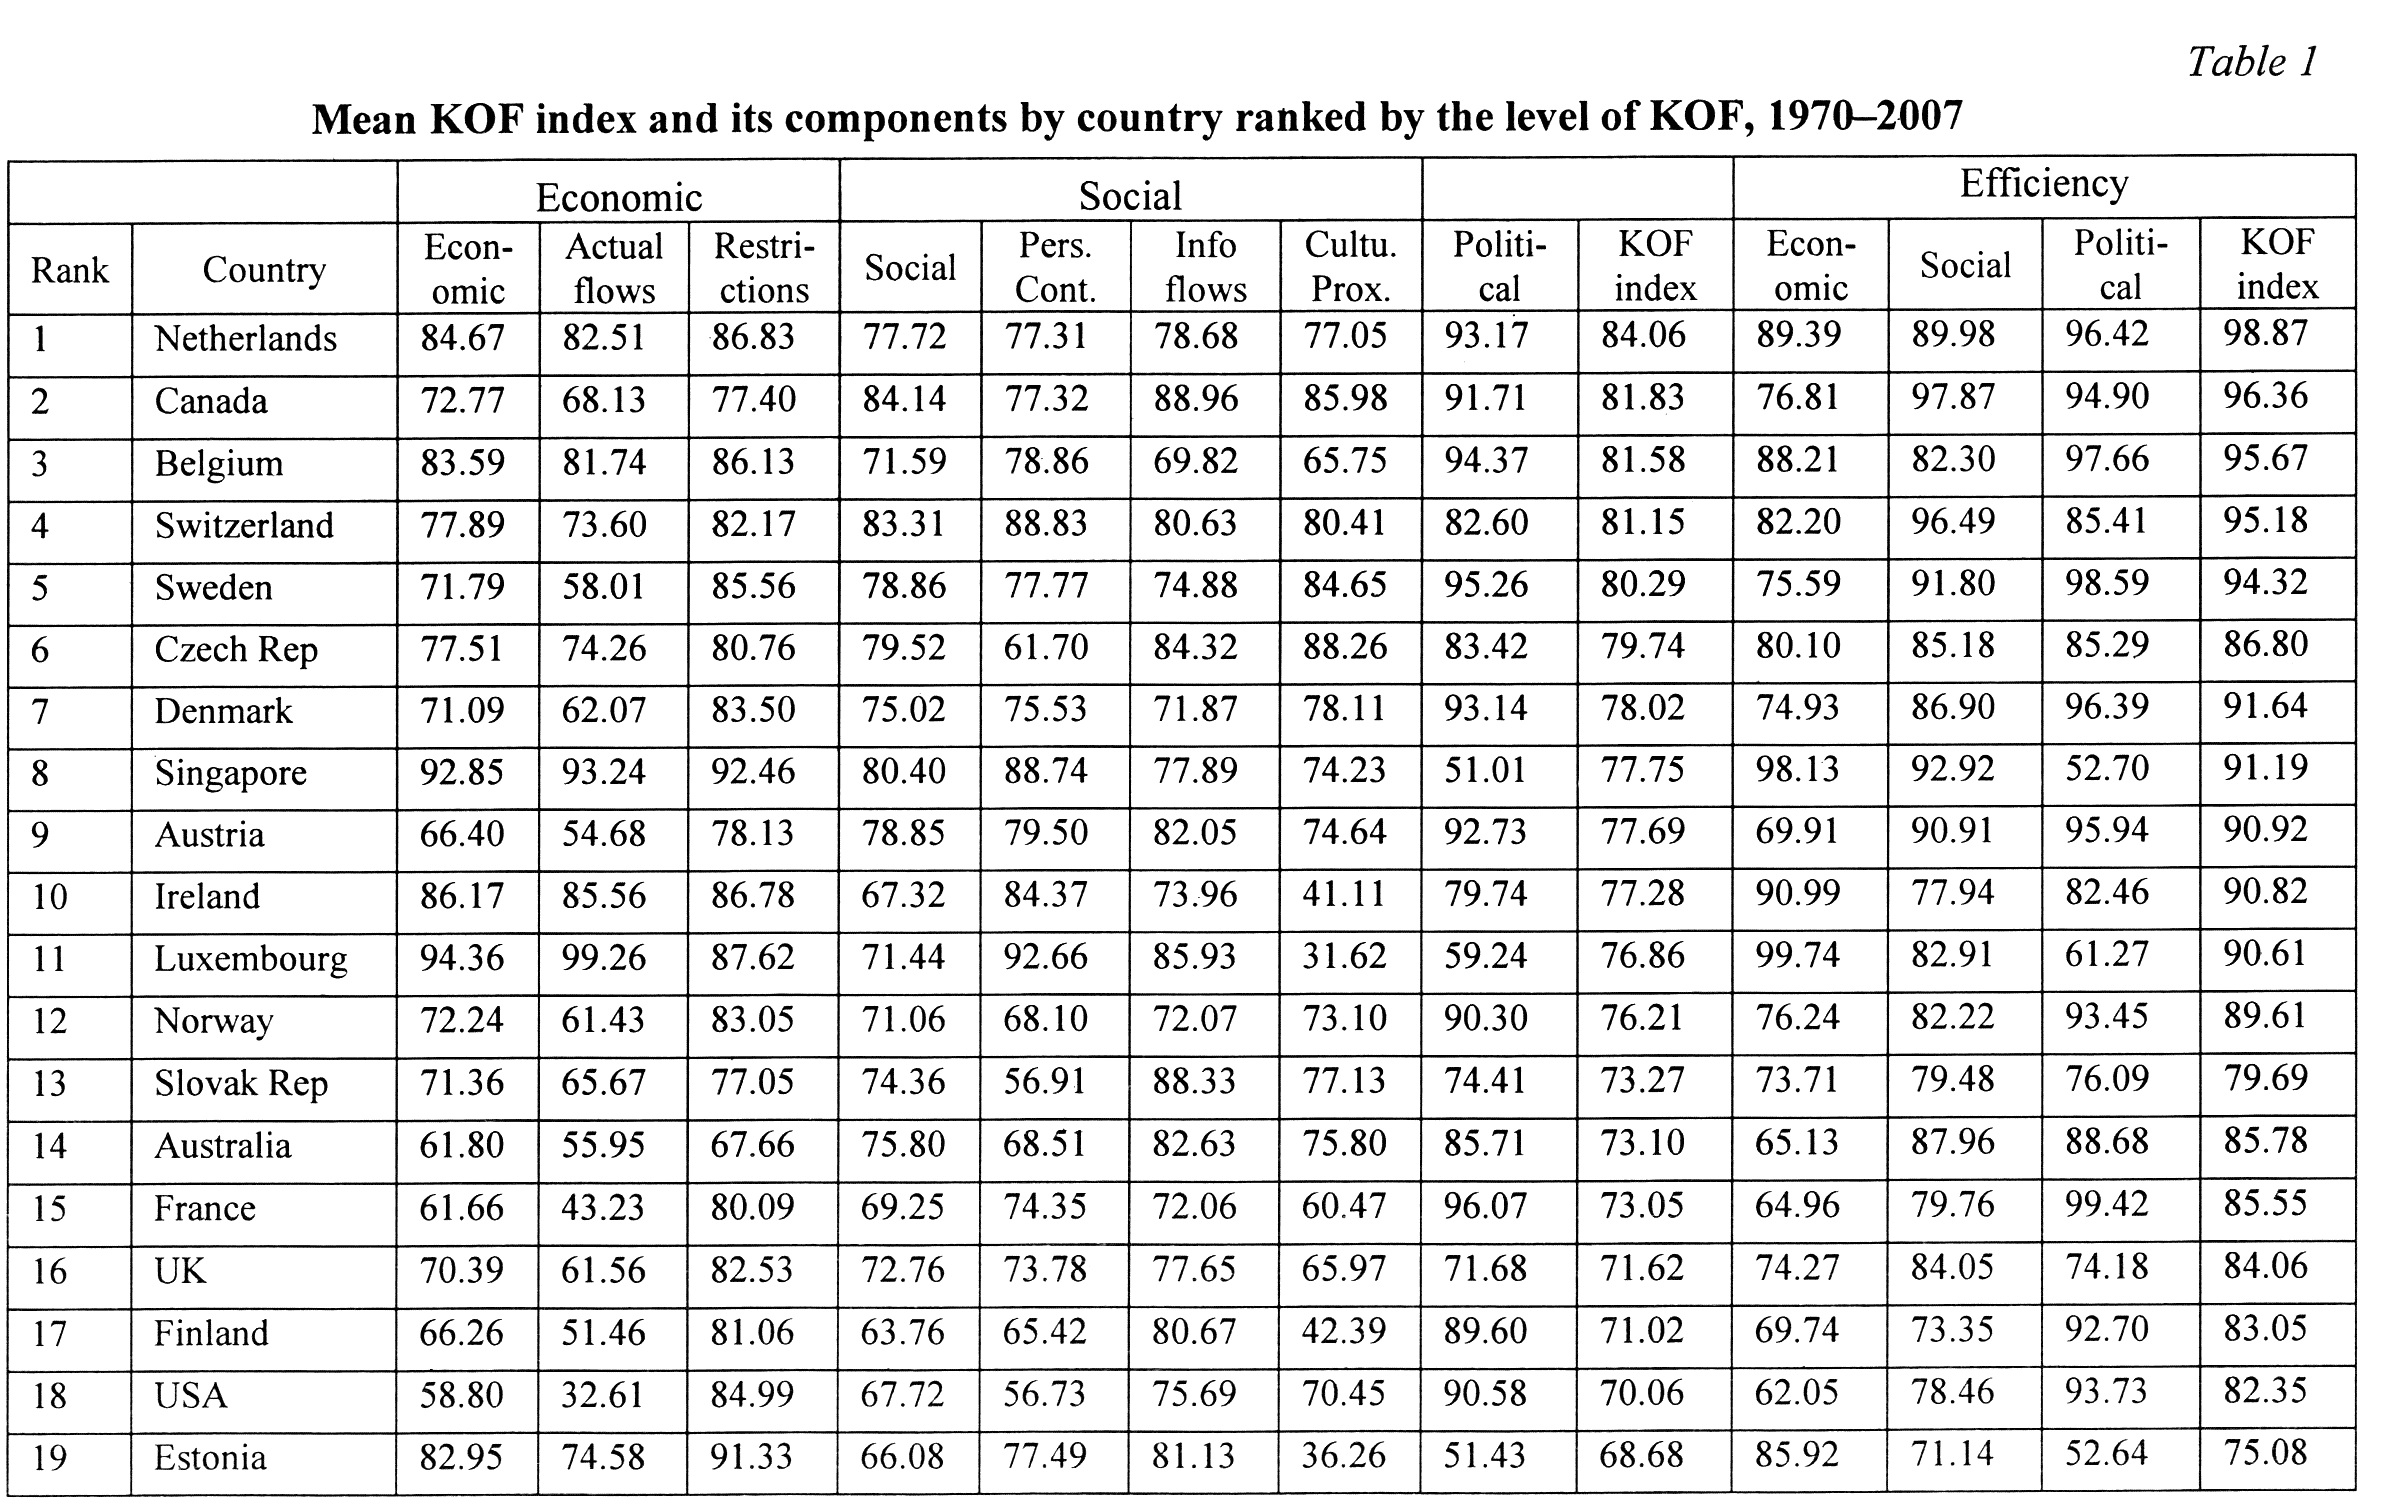
In order to focus on Europe and its main trade partners, despite the index being computed for all countries, we limit the sample and analysis to 50 countries. A full list of countries ranked by the overall KOF index is shown in Table 1 (see Appendix).2 The Table contains information about different sub-components, components and the overall index as well as the indices measured in efficiency term where countries are compared with the best country in a given year. The Netherlands, Canada, Belgium, Switzerland and Sweden are the five highest ranked countries, while Montenegro, India, China, Albania and Macedonia are among the five lowest ranked countries. The position is based on data covering the unbalanced period of the study, namely from 1970 to 2007. By individual components the positions of countries differ from those based on the overall KOF index.
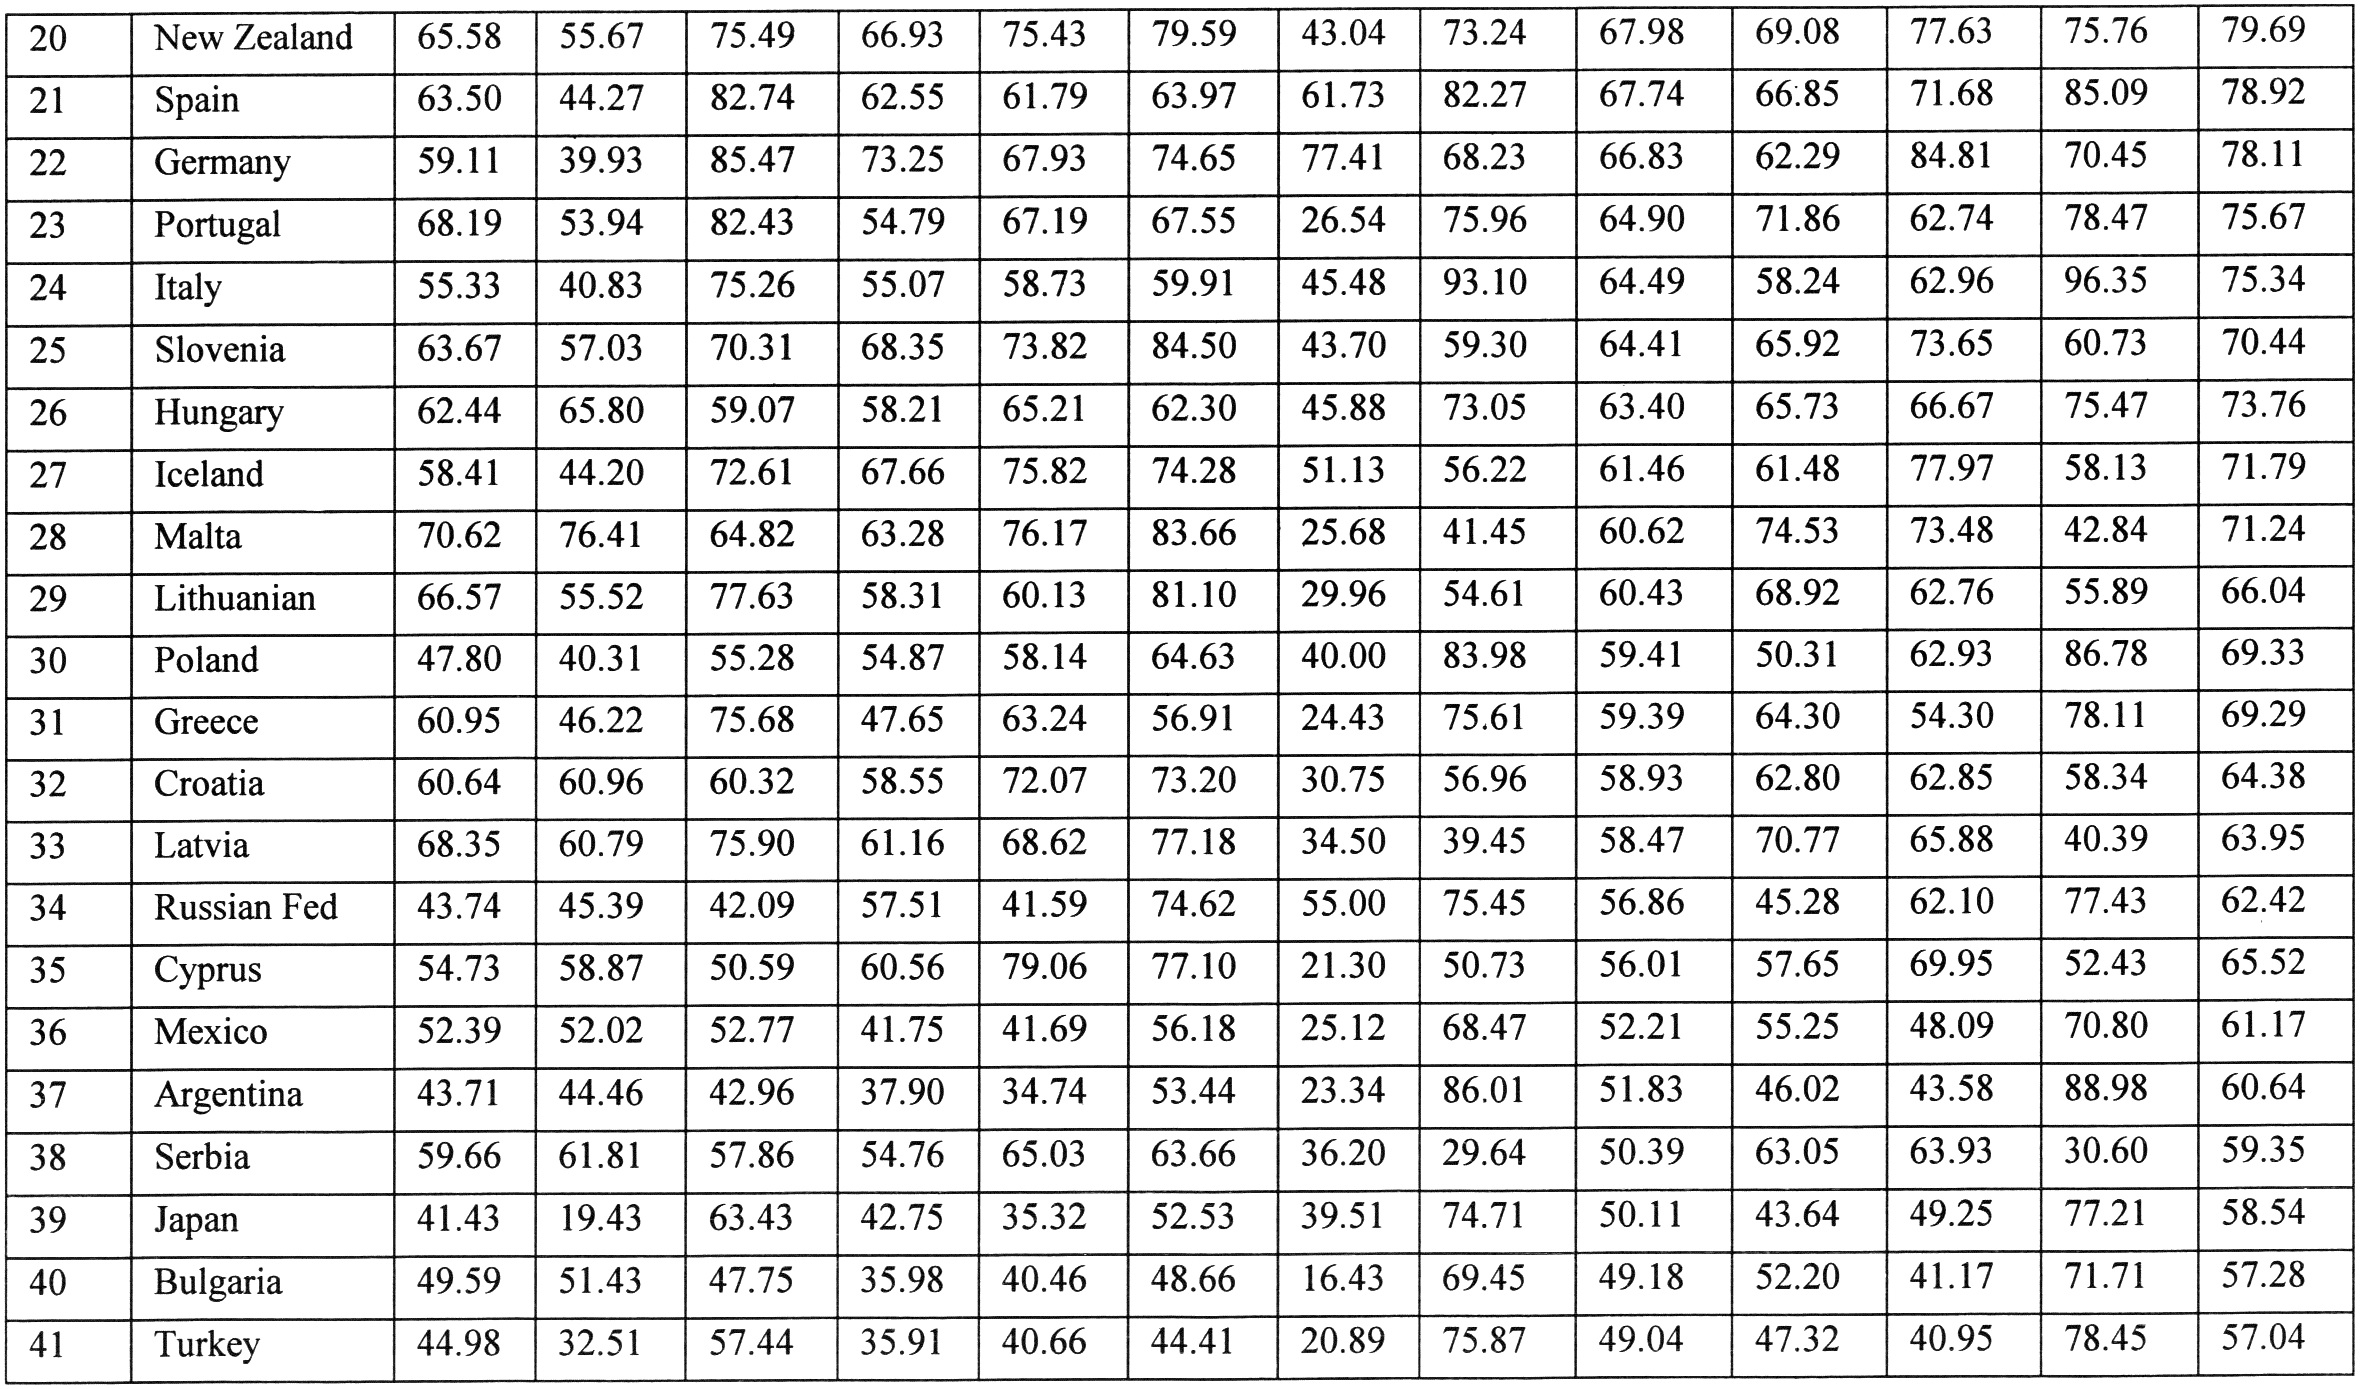
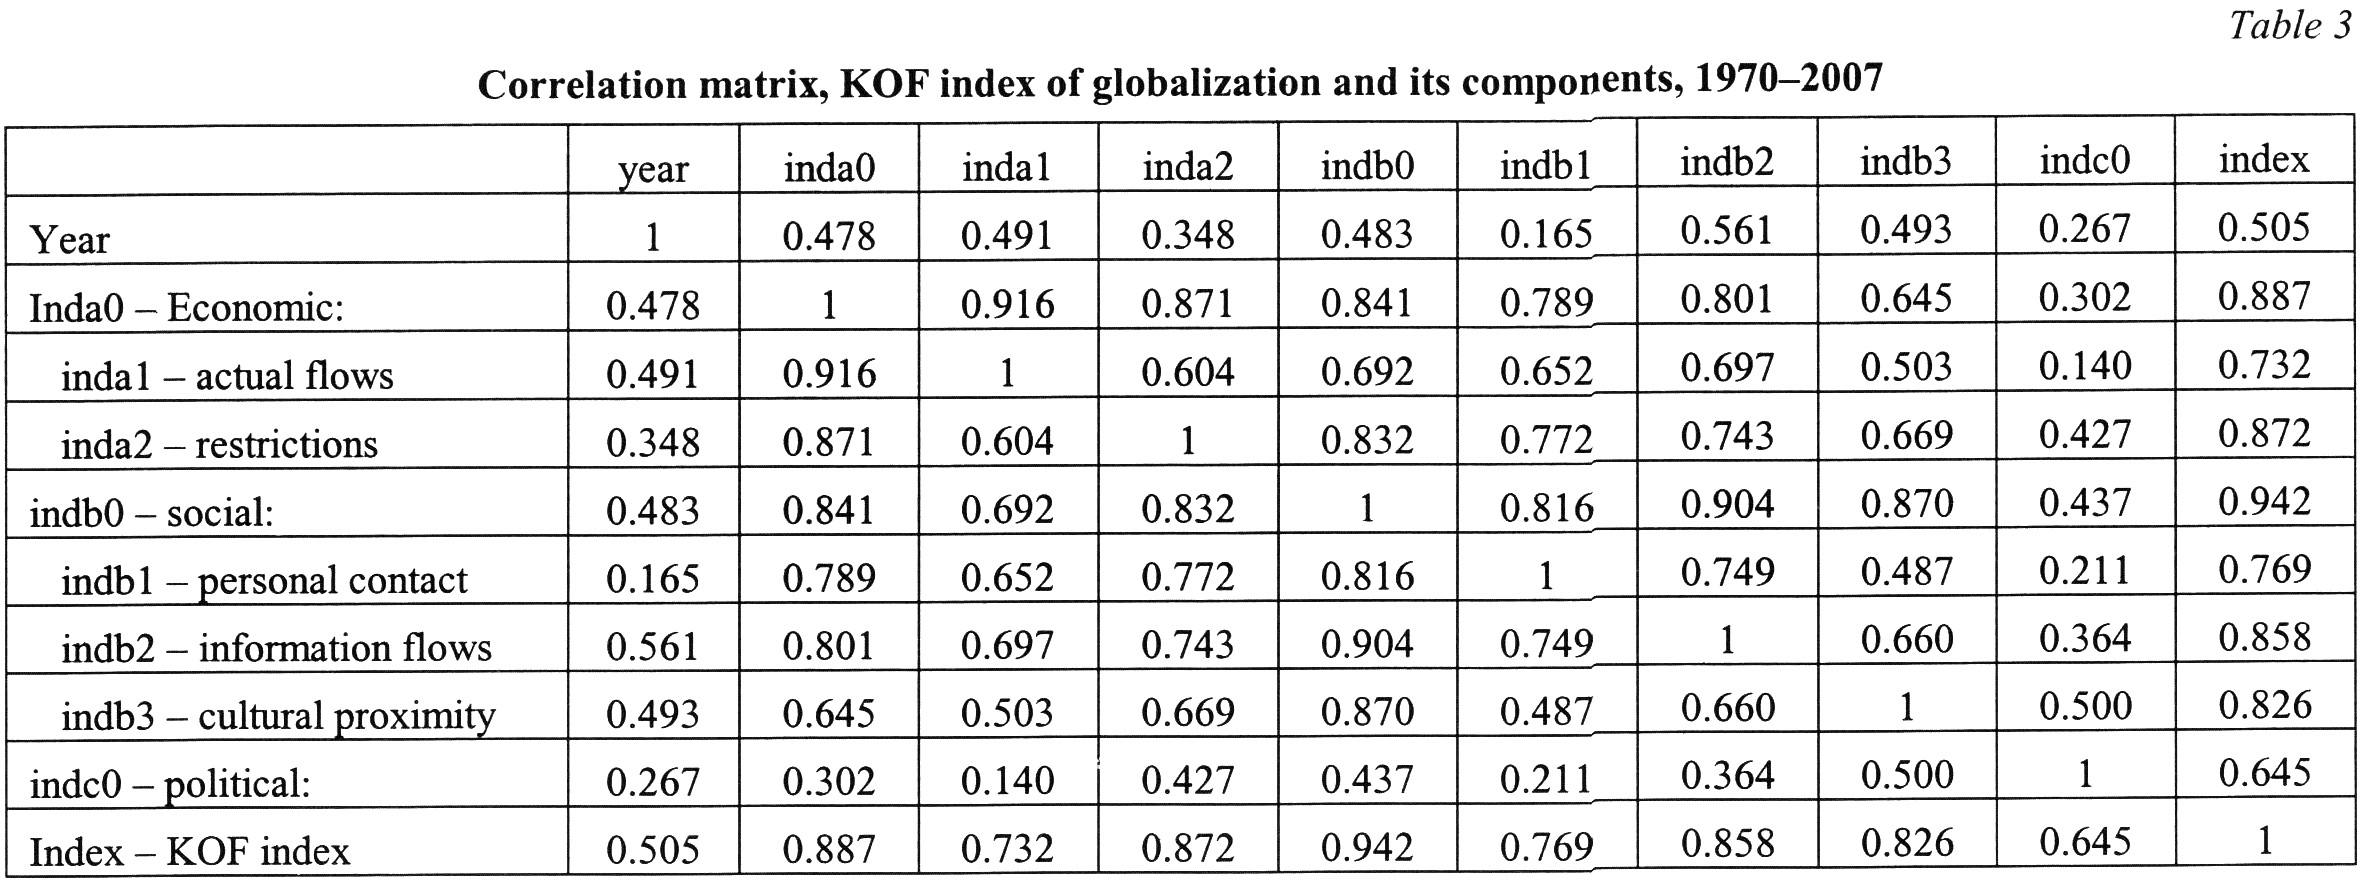
Table 2 (see Appendix) shows summary statistics of the main components of globalization and their sub-components and the overall KOF index described above, as well as the mean values by regions. We can see large variations in the index and its components values across different country groups. The largest dispersion is found in cultural proximity and actual flows components, while restrictions on trade and capital vary least. The social component is more dispersed than political and economic components. The mean and median values of the sample of 50 countries differ by less than 10 per cent, showing evidence of non-skewed distribution.
We find large variations in average index and its components across the groups of countries. EU15 and EFTA countries are ranked highest by the economic component, while the emerging countries are ranked lowest. The high level of economic globalization is attributed to proxies for restrictions to trade and capital. Surprisingly, the social globalization rank of the EU15 as the fourth region is mainly a result of low information flows and cultural proximity. From the political component point of view, EU15 is ranked after America, which is the highest, and the Western Balkans are placed lowest. The emerging country group has a relatively high political component. By the overall KOF index EU15 is ranked second and EU12 as the fifth, while the emerging economies as the seventh and the Western Balkan countries as the last. The ranking result in terms of efficiency remains unchanged. It measures the gap between countries and regions compared with the best in a given year serving as a reference.
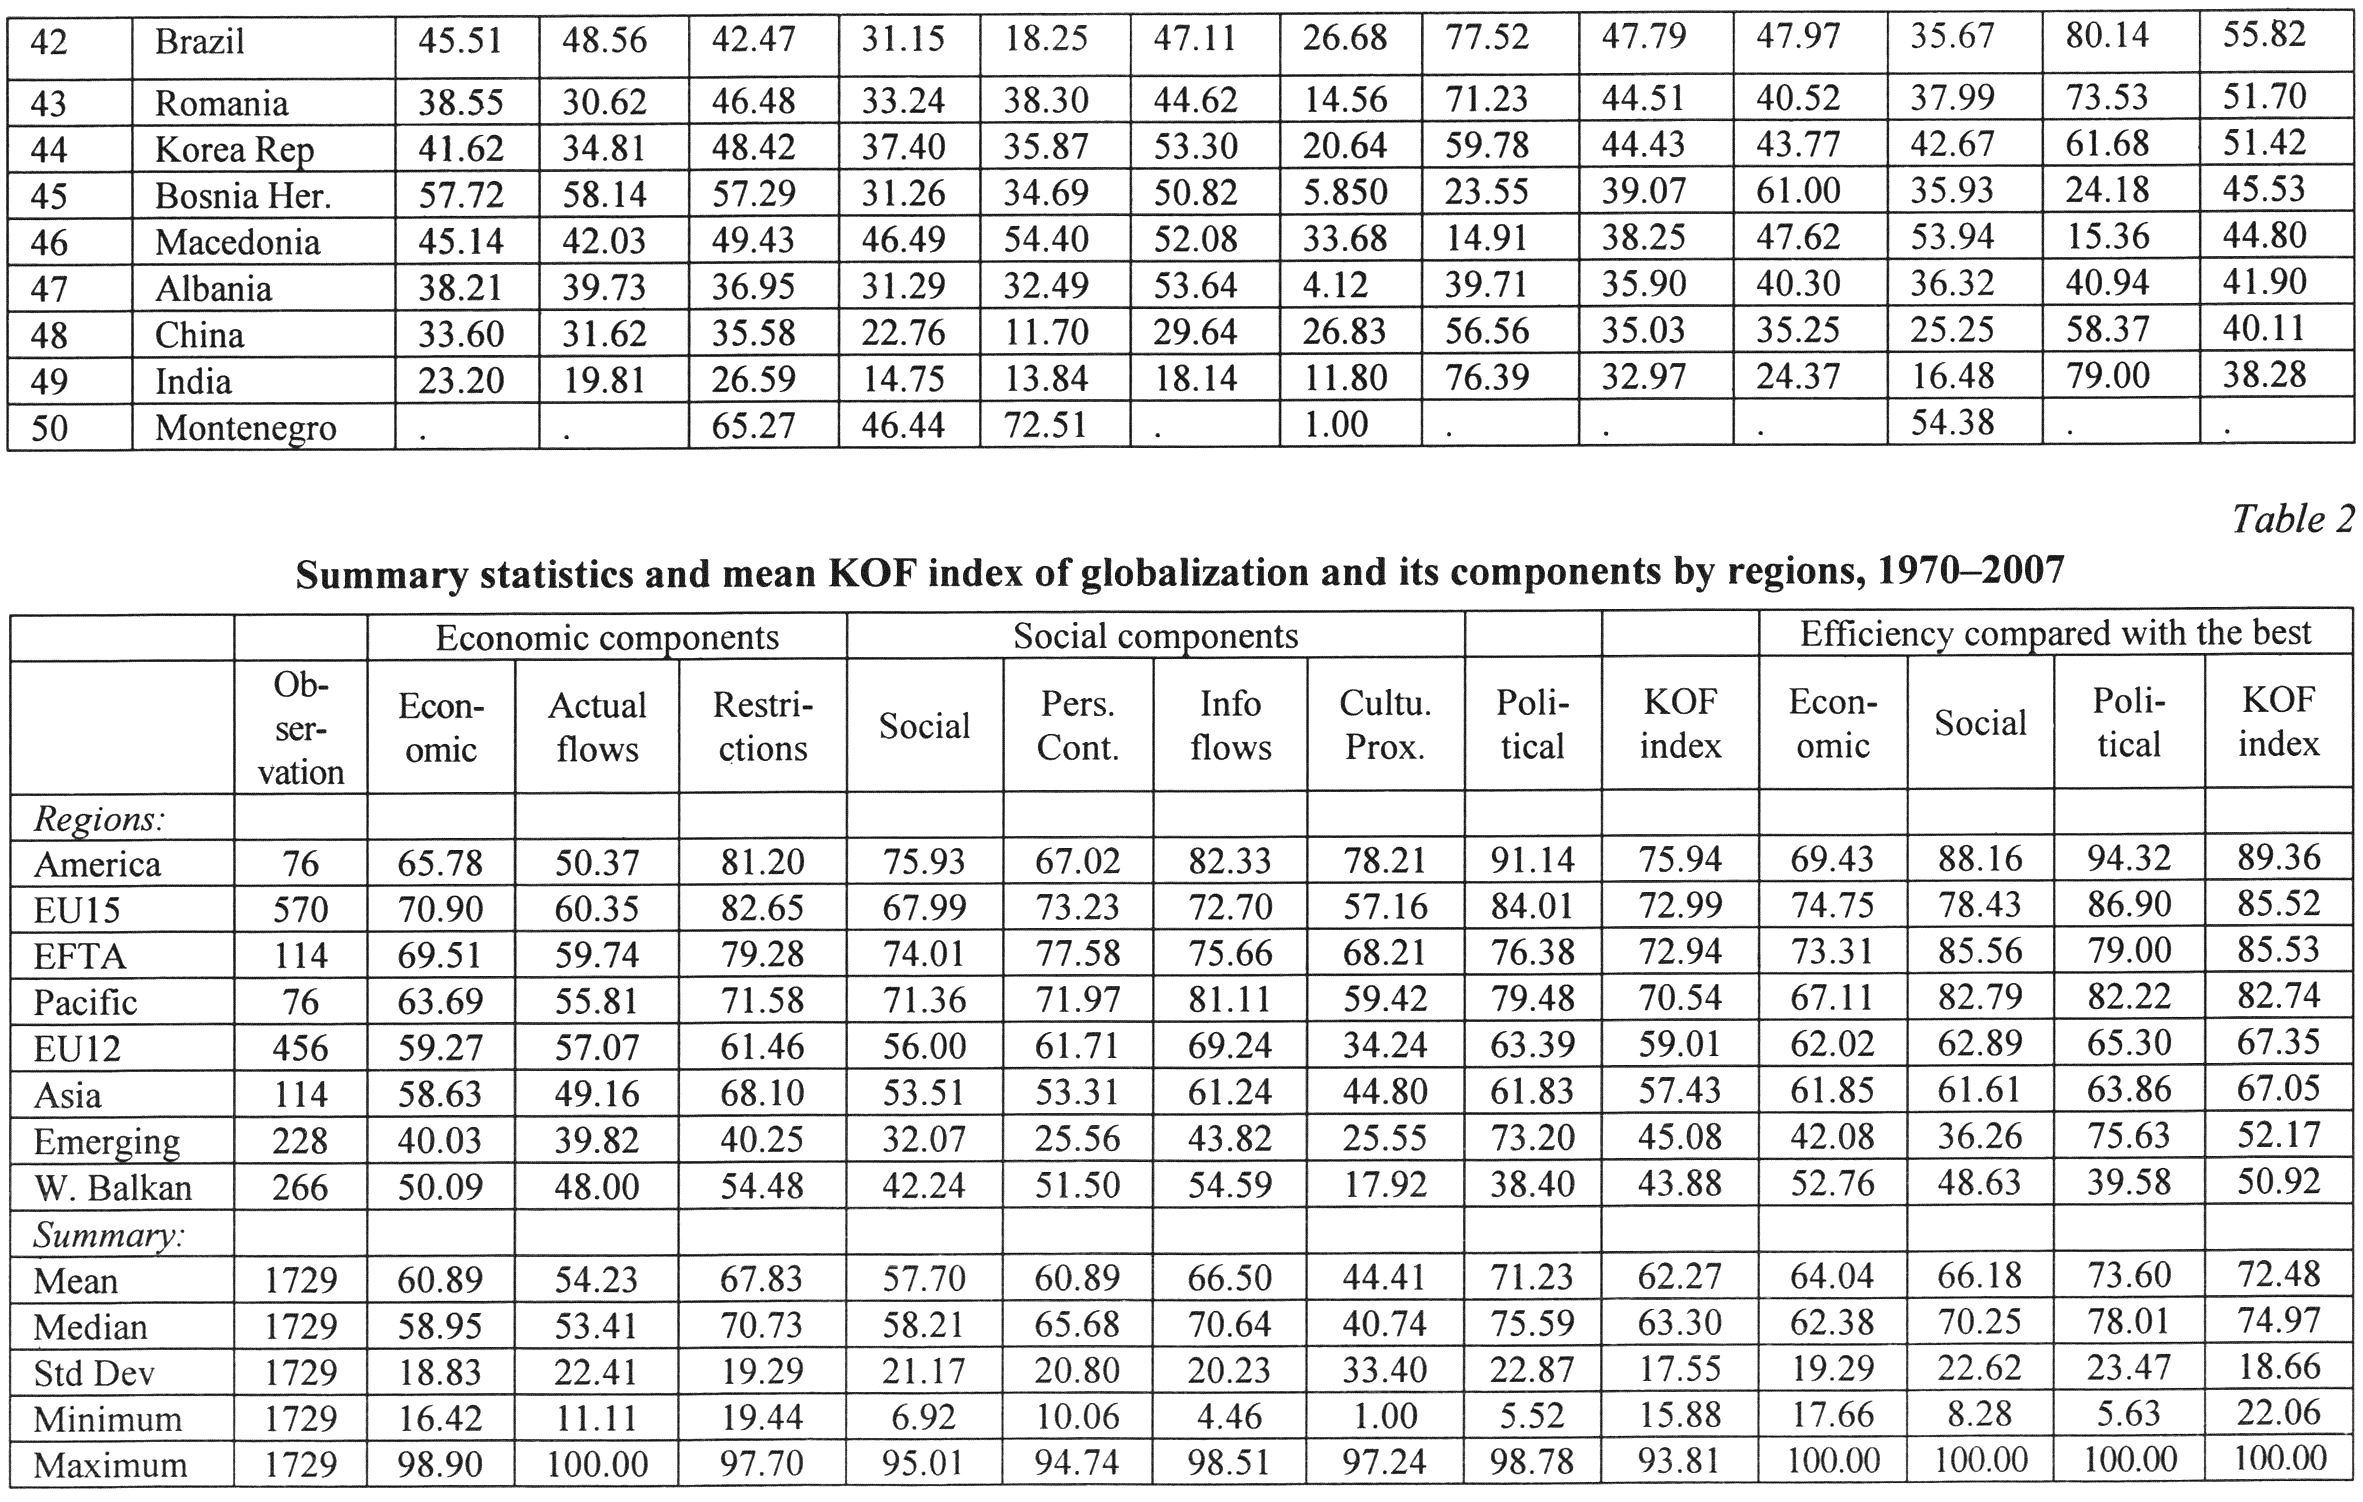
In Table 3 (see Appendix) we report the correlation coefficients among the index and its different sub-components and time trend. The correlation coefficients are statistically significantly different from zero and are positive. All index components show an increasing trend over time. The highest positive trend is attributed to actual flows (0.49) of the economic globalization, information flows (0.56) and cultural proximity (0.49) of social globalization. The political and personal contacts are growing less over time. The economic component is highly correlated with social (0.84) but not with the political (0.30) component. The social and political components are also not highly correlated (0.44) with each other.
5. International Variations
Table 1 (in the Appendix) shows the overall KOF index, its three main components and their sub-components for each country.3 In Fig. 1 an aggregation of the three components form an aggregate index. The countries in Fig. 1 are also ranked by the overall KOF index, but here the components are aggregated using the same value. Most studies report only the index level. However, the gap between two adjacent countries may differ greatly. The table provides ranks of the sample countries in two different ways. It arranges countries in descending order, first by rank of weighted KOF index, while the second rank is by the weighted efficiency index. Thus, here in addition we report the mean indices in efficiency form, which accounts for the metric gap compared with best ranked country in a given year. The Netherlands scores 98.87 out of possible 100 for 38 consecutive years. For instance, the gap between the Netherlands and Canada is about 2.5 units, while the gap between Belgium and Switzerland is less than half a unit. The difference in the position of countries in metric form is becoming larger as we move down the list of countries.
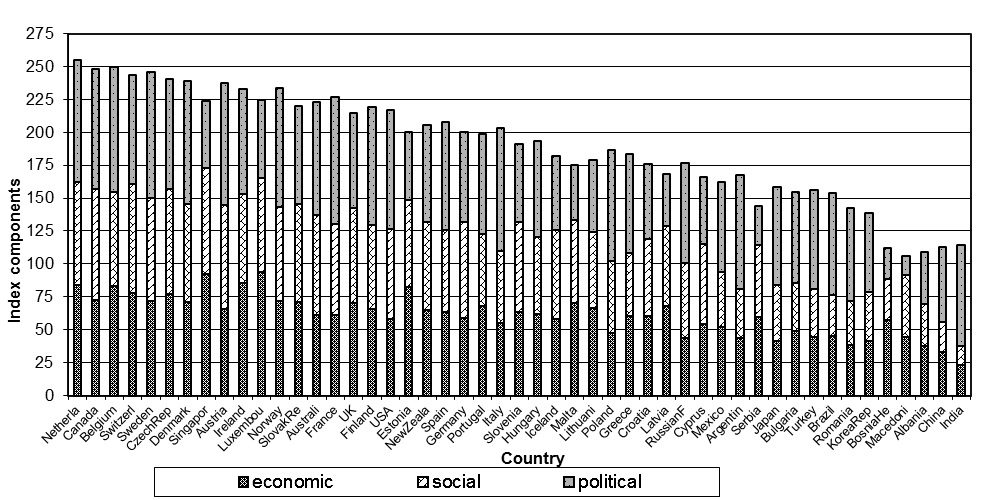
Fig. 1. KOF globalization index components, 1970–2007
The globalization rank of countries is changing depending on the different index components used as reference. The major differences in the rank are related to Canada, Sweden and Denmark which are ranked relatively low concerning economics, but strongly in social and political components. As expected, the USA, France, Italy, Argentine, Brazil, China, India and Russia are placed at a higher position as a result of their strong political component. Some countries like Switzerland, Singapore, Luxemburg and Estonia, despite their high rank, are gaining little influence from the political component. The low rank of countries shows low values, particularly in economic and social components, while high rank countries have similar levels of the various disaggregate components. There are several exceptions such as Argentina, Brazil and India, which have extremely high political component values, and these values to a large extent determine their relatively high ranks. In the case of China, despite its high political score, it is ranked only 48 due to its low index values.
6. Regional Variations
Table 2 (in the Appendix) presents the distribution of average level of globalization and its components by regional location of the sample countries. The regional grouping is different from the traditional ones, namely Europe, Asia, Latin America, Middle East and North Africa, Sub-Saharan Africa, and North America and Pacific. Composition of the country groups is shown in Table 2. In this paper from the perspectives of development and formation of unions, some of the countries are grouped differently, such as: EU15, EU12, BRIC (Brazil, Russia, India and China), emerging markets (Brazil, Russia, India, China, Argentine, Mexico and South Africa), EFTA (Norway, Iceland, Switzerland and Liechtenstein), and Western Balkan (Albania, Bosnia and Herzegovina, Croatia, Macedonia, Montenegro, Serbia, and Turkey).
The ranking of regions is displayed in Table 2 in descending order of the estimated aggregate KOF index. It is consistent with the ranking by level of efficiency in globalization by regions. Here North America, consisting of the USA and Canada, ranks highest among the regions followed by EU15 and the EFTA group. Pacific and EU12 are ranked as medium globalized, while the emerging and Western Balkan countries are ranked as the lowest regions. The high rank of North America is attributed to the strong influence of the Canadian social and US political components. The EU15 and EFTA groups' high rank is attributed to their high economic and social components, respectively. The EU12 and Asia, which have similar average values, do not have advantages in any specific areas. They are strong in the political component while the Western Balkans are better with respect to the economic component. Among the exceptions are the low actual flows of North America, the low personal contacts of emerging markets, the low cultural proximity of EU15 and the high political components of emerging markets. It should be noted that these mean regional values are obtained from mean values for several countries within the country group each observed for 38 years and thus, are relatively stable.
From the perspective of Europe, in addition to the general global development, the development among different groups within Europe (EU15 and EU12) and in its proximity (Western Balkans) and other regions, in particular EFTA, BRIC and emerging markets is of particular interest. The position of the European countries, Asia and North America and Pacific has been already discussed above. The emerging markets are catching up with the globalization level of EU12. For a majority of these countries the rank is positively affected by their political and economic components.
Following the fall of the Berlin Wall, there were high expectations that an integration of Eastern Europe would not only provide a better security situation for Europe but it would also provide a unique comparative advantage to the West in the form of outsourcing possibilities and cost competitiveness. However, this was not realized due to the emerging economies like China and India and their rapid economic and social development, massive capital stock accumulation, technological investment and capability, competiveness and high production capacity.
Previously we discussed the development of KOF globalization index and its components over time. The temporal pattern in Fig. 2 showed a generally positive but slow trend of their development. An aggregation of the countries led to smooth development in Europe and Asia which has undergone major changes in relation to the collapse of the Soviet Union and the Asian financial crisis. A disaggregation of the sample into different regions will allow the capturing of the effects of changes and heterogeneity in countries' responses to both internal and external shocks within region. For instance, Heshmati (2006a, 2006b) found evidence of increased economic globalization from 1995 to 1997, it decreased sharply in 1998 but it maintained the same level or slightly increased after 1998. The decline is a result of the East Asian financial crisis where the majority of the East Asian and South East Asian economies suffered heavily from its impacts. However, the emerging countries like China and India were not directly impacted by the crisis.
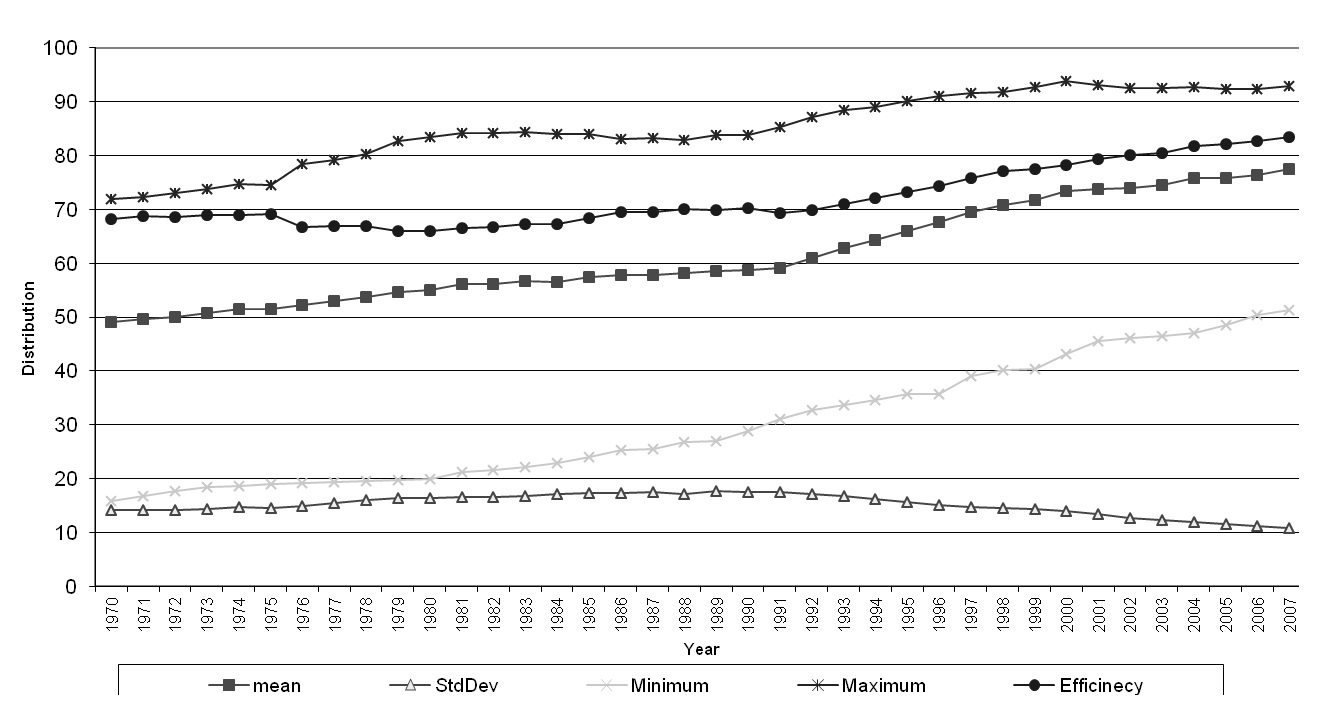
Fig. 2. Distribution of KOF index of globalization, 1970–2007
In the case of economic globalization, the regions show both heterogeneous levels and development over time. The gap between EU15 as the highest and the emerging markets as the lowest is about 30 units of the maximum scale 100. The emerging countries and EU12 are among the regions which were developing the fastest in 1970–2007. Dispersion among the regions in terms of social globalization is much larger until the end of the 1990s. EFTA and EU12 are among the two most progressive countries while emerging economies grow fastest. The political component of globalization shows the highest degree of heterogeneity among the regions. Most countries after the decline around 1989–1990 show a positive and fast converging development. The growth is pronounced in particular in the case of EU12 and Western Balkan countries. The Asian region shows a negative development around 2001–2004 which is the only indication of the possible emergence of the current global economic crisis. A similar tendency was observed prior to the Asian financial crisis. The development of the North America and EU15 regions is almost constant from 1991. The overall index has very similar patterns in terms of dispersion as that of economic globalization but with certain shifts among the regions' positions. Here the EU12, Western Balkans and emerging markets are among the rapidly globalizing regions after 1990.
6. Temporal Variations
In Table 2 the average value of the KOF index, its index components and their efficiency counterparts are reported for the period from 1970 to 2007. Fig. 3 also shows the temporal variation of the index and its components. Initially, restrictions contributed mainly to the economic components, but after 1995 the main contribution is from actual flows. We observe a positive trend for all the components. In the case of social component, a personal contact and information flows are the main determinants of the level of social development. The information flows grow much faster than personal contacts. The cultural proximity components had initially little effect on the social component but it developed rapidly during the entire period under study. The political component is the only component with several breaks in its trend. We cannot attribute the declines to any particular event. The trend advances rapidly around 1991 fueling the overall KOF index to continuously increase. The main contributor is political, followed by social and economic components.
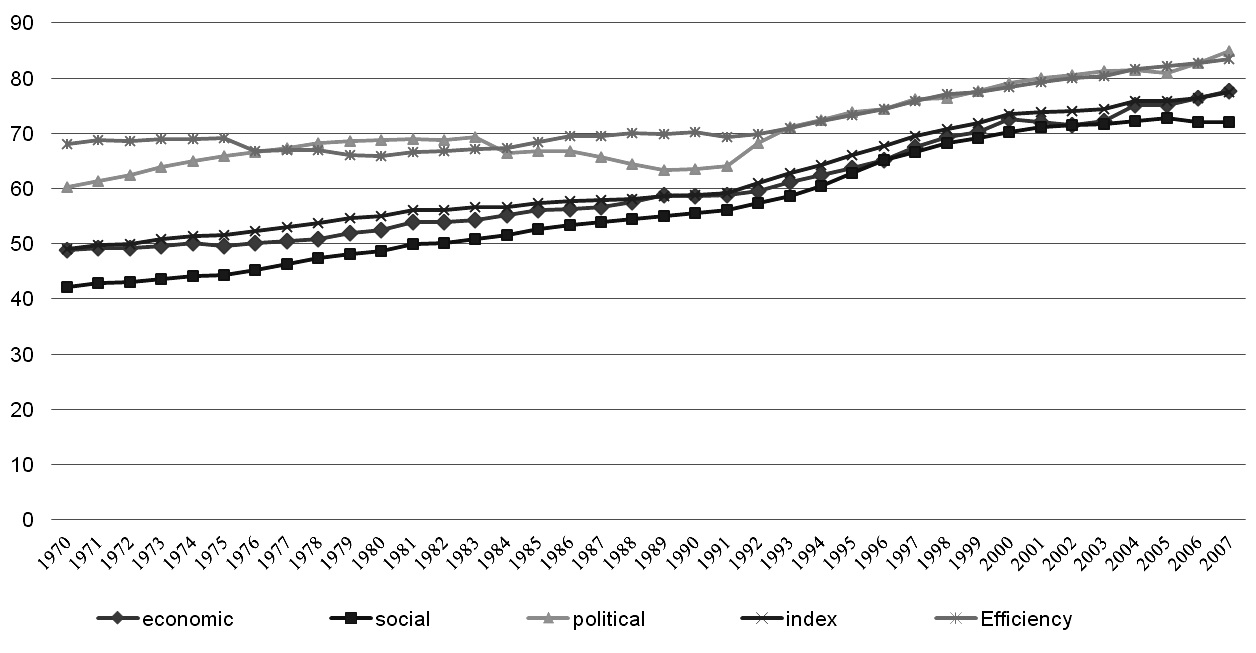
Fig. 3. Development of KOF globalization index and its components, 1970–2007
Concerning the efficiency indices, where the individual observations are compared to the best globalized country in a given year, this method is better than the standard KOF index as it provides better metric information than the simple ranking. The level of the index and its components are somewhat higher than the KOF indices but the positive trends in general and the breaks in the political component are observed in a similar way. The positive trend shows that despite yearly frontiers the mean level is increasing constantly, suggesting both a shift in the frontier and also a catching up of the sample countries to the frontier countries.
Changes in the overall KOF index and its three main components are shown in Fig. 4. The change in the economic component as a result of the positive trend is mostly positive. However, there are a few exceptions of negative change rates in 1975, 2001 and 2002. The annual changes are within the range of –0.80 (1975) and 4.40 (2004) per cent. It should be noted that the negative growth rates in the economic components are caused by the actual flow sub-component. The annual change in the social component is also positive with the exception of 2006 and 2007, which are caused by changes in the cultural proximity sub-component. The annual percentage change in the social component varies in the interval between –0.61 (2006) and 4.76 (1995) per cent. In the post-1990 period, the information flow together with its growth rate is changing rapidly, while personal contact is relatively stable over time with small changes. The political component is identified as being the most variable component. Its variation ranges in the interval from –4.80 (1984) to 7.95 (1991). In rescaling the indices to efficiency level the positive and negative values are reduced somewhat, but the trend remains the same.
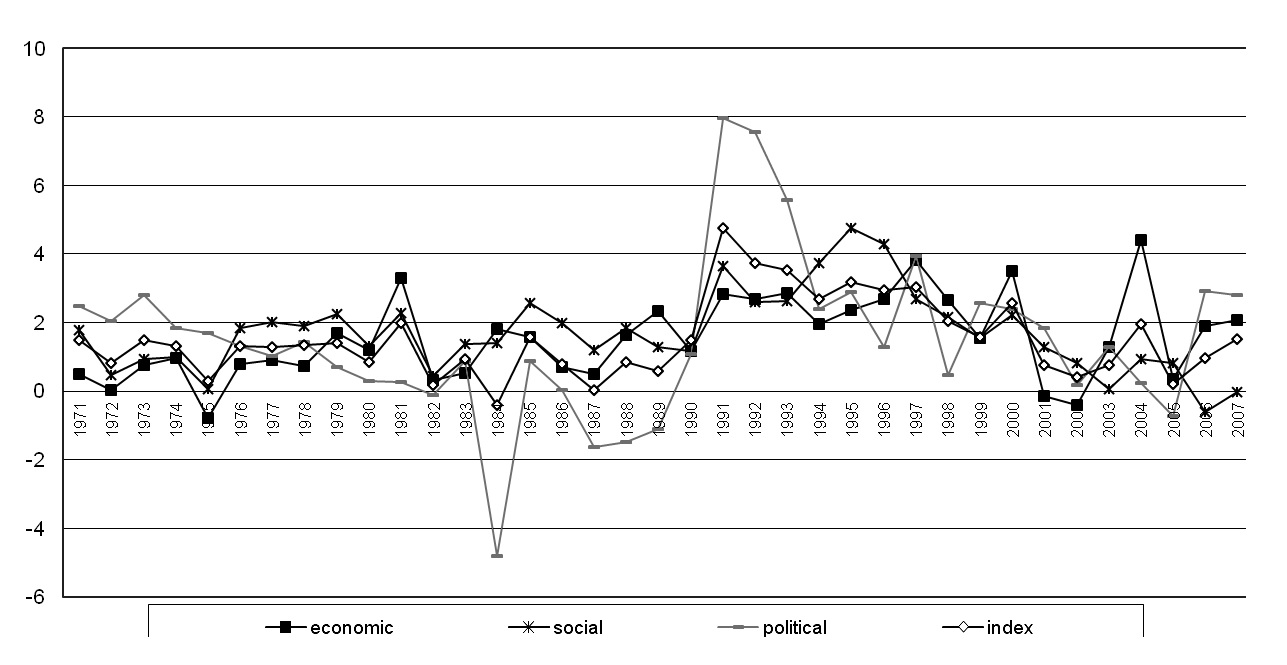
Fig. 4. Changes in KOF globalization index and its components, 1970–2007
The development of the KOF index and its components over time is reported in Table 2 and also in a limited form is shown in Fig. 5. The standard and efficiency mean values are very close and positively developing over time. The range and standard deviation is shrinking largely from 1991, suggesting convergence among countries with relatively high economic component values. In the case of the social component, the standard and efficiency values differ in particular during the period prior to 1976. The trend is positive and we observe evidence of convergence and reduced dispersion over time after 1995. The two measures of mean are very close in the case of the political component. We observe a stagnating or a negative trend in 1980–1990, but a faster development afterwards combined with larger dispersion. Convergence takes place first from 1991 onwards. The two mean values are clearly distinguished in the case of the overall index. The gap between the mean values and the range and dispersion are shrinking over time. Distribution of the overall index and its components suggest a positive relationship between level of development and convergence to a higher level of globalization.
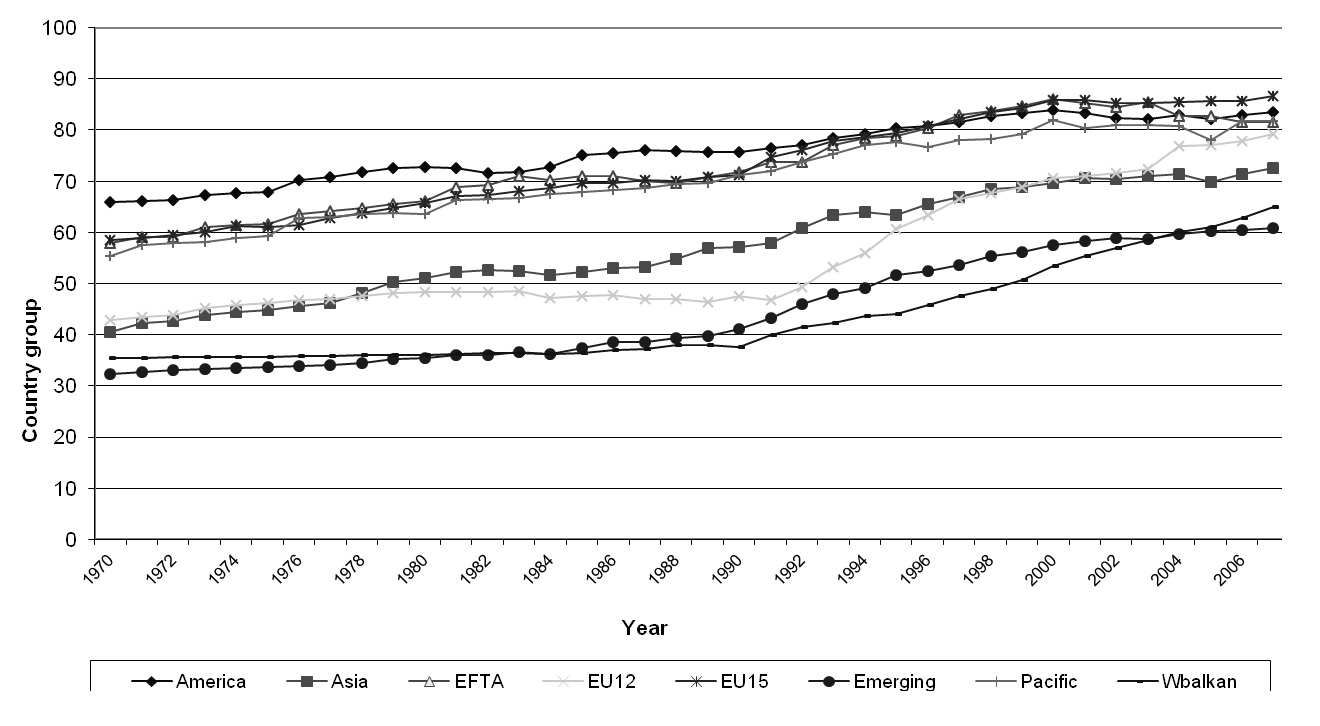
Fig. 5. Development of KOF globalization index across regions, 1970–2007
7. Summary and Conclusions
In this study, we have used the KOF globalization index composed of economic integration, social and political engagement. Each component is obtained from several indicators and assigned different values in the aggregation to form the overall index. The index and its components are computed for individual countries and time periods. This allows checking the development of the globalization level and its growth across countries and over time. The results show that globalization components also developed in different ways and progressed over time and across countries. In the simple correlation coefficient calculation among the different index components we observe a high association, suggesting there is a close relationship between globalization and its main components.
In similar studies but using different datasets the relationship between globalization, poverty, inequality and growth has been investigated through regression analysis. Comprehensive sensitivity analysis, based on different definitions and measurement methods, showed that globalization positively affects growth but has a negatively impact on inequality and poverty. The results are based on a small sample of countries with a slight overrepresentation of developed countries and over a short time period. The results also suggested that globalization explains only some aspects of inequality, poverty and growth. It is rather difficult to separate the regional effects and the effects of globalization on inequality and poverty.
Despite this, the KOF index provides a good picture of the globalization development over time and its heterogeneous character across countries. It is worth mentioning that there are several limitations in this study which need further research. One limitation is that, the estimated index is sensitive to the determinants of the globalization index and the method of estimation. This sensitivity has strong implications for the development and variations among countries and their ranking. Another limitation is that we lack data on sufficient quality and quantity to test the causal relationship between globalization and several other indicators of development and welfare. A third limitation is that the data include the Asian financial crisis but not the current global economic crisis. An extension of the data would enable us to compare the effects of the two crises, their similarities and countries and regions heterogeneous responses to the two crises. The last limitation is that in the estimation of the globalization index several factors are left out such as financial, environmental, and technological and welfare aspects. The estimation of the new globalization index specified by such determinants would allow a more accurate estimation of a composite index.
The sample countries cover a large share of global GDP and population. The sample and results are sufficient for making inferences about globalization and its development at the global, regional and international levels. The result shows evidence of high and constant level of globalization among highly developed regions and convergence over time in particular by the EU12, Western Balkan and Emerging country groups. Despite the use of a large number of indicators and sample of countries the index is, however, incapable of capturing the Asian financial crisis. Neither does it provide an indication of the emergence of the current global economic crisis.
It should be noted that, ideally one should estimate the resulting globalization components and indices by GDP and/or population of the sample countries to provide a better picture of the level and development of globalization over time, as well as the contributions of the emerging countries. Similar estimated averages should be considered for the regional comparisons. The population and GDP estimated index and components are a better base for computation of changes in globalization over time. No such values are accounted for in this study. However, in a long time series it is recommended in order to avoid biased temporal patterns of globalization and its changes.
NOTES
* This project was financed by Directorate General for Economic and Financial Affairs (DG ECFIN) as a part of its Visiting Fellow Program. I am grateful to the employees at the unit for Globalization and Development Policy for their kind hospitality during my stay as visiting fellow in DG ECFIN in February 2010. Comments and suggestions by Heikki Oksanen, Heliodoro Temprano, Willem Kooi and other seminar participants at DG ECFIN are gratefully acknowledged.
1 The KOF globalization index is published by the Swiss Federal Institute of Technology and updated on an annual basis, Zürich. URL: http://globalization.kof.ethz.ch/.
2 In order to conserve space not all results are presented here. These and any other results not presented are available from the author upon request.
3 The gap in rank of countries and their level of globalization index in Fig. 1 is due to simple aggregation of the three components. The rank is based on the weighted overall KOF index.
REFERENCES
Aghion, P., and Williamson, J. G.
1998. Growth, Inequality and Globalization: Theory, History and Policy. Cambridge: Cambridge University Press.
Bata, M., and Bergesen, A. J.
2002. Global Inequality: An Introduction to Special Issue on Global Economy. Journal of World-System Research 8: 2–6, 146–148.
Collier, P., and Dollar, D.
2001. Can the World Cut Poverty in Half? How Policy Reform and Effective Aid Can Meet International Development Goals. World Development 29(11): 1787–1802.
Dreher, A.
2006. Does Globalization Affect Growth? Evidence from a New Index of Globalization. Applied Economics 38: 1091–1110.
Dreher, A., Gaston, N., and Martens, P.
2008. Measuring Globalization – Gauging its Consequences. New York: Springer.
Heshmati, A.
2006a. Measurement of a Multidimensional Index of Globalization. Global Economy Journal 6(2): 1–30.
2006b. The Relationship between Income Inequality Poverty, and Globalization. In Nissanke, M., and Thorbecke, E. (eds.), The Impact of Globalization on the World's Poor (pp. 59–93). Houndmills – New York: Palgrave Macmillan.
Heshmati, A., and Lee, S. C.
2010. The Relationship between Globalization, Economic Growth and Income Inequality. Journal of Globalization Studies 1(2): 87–117.
Kearney, A.T. Inc. and the Carnegie Endowment for International Peace
2002. Globalization's Last Hurrah? Foreign Policy, January/February: 38–51.
Lindert, P. H., and Williamson, J. G.
2001. Does Globalization Make the World More Unequal? NBER Working Paper 8228. Cambridge, MA: National Bureau of Economic Research.
Manasse, P., and Turrini, A.
2001. Trade, Wages, and Superstars. Journal of International Economics 54: 97–117.
Miller, T. C.
2001. Impact of Globalization on US Wage Inequality: Implications for Policy. North American Journal of Economics and Finance 12(3): 219–242.
Mussa, M.
2003. Meeting the Challenges of Globalization. Journal of African Economies 12(1): 14–34.
Nissanke, M., and Thorbecke, E. (eds.)
2007. The Impact of Globalization on the World's Poor: Transmission Mechanisms. Studies in Development Economics and Policy. Houndmills – New York: Palgrave Mac-millan.
Talbot, B.
2002. Information, Finance, and the New International Inequality: The Case of Coffee. Journal of World-System Research 8(2): 213–250.