Historical Evolution of Global Scientific Collaboration: The Case of International Co-Authorship Network

Journal: Social Evolution & History. Volume 17, Number 2 / September 2018
DOI: https://doi.org//10.30884/seh/2018.02.10
The paper focuses on the patterns of evolution of the structure of global scientific collaboration over the most recent historical period. Among the multiple approaches to measuring such collaboration we choose to investigate the evolution of the international co-authorship network over a 25-year-long period (from 1991 to 2016). We build a series of networks of main international co-authorship partners using the data obtained from Scopus Elsevier database. Our analysis reveals two markedly different patterns of the network evolution. At the general level, it has been increasingly turning into a ‘hub-and-spoke’ network where one central hub, the USA, clearly dominates nearly the whole of the network. However, if the impact of the USA is not taken into account, we discover a second level of the network structure with remarkably different patterns – instead of one single hub, there exist a number of centers with their respective clusters, and this structure has not been gravitating towards becoming more concentrated. If anything, its evolution has taken quite the opposite path, with a number of new centers emerging recently with their respective clusters of countries.
I. INTRODUCTION
Global research community has experienced spectacular expansion over the past two decades; in per capita terms, the number of researchers involved in Research & Development (R&D) activities all over the world increased by nearly 1.5 times from 1996 (788 per 1 mln) to 2015 (1,151 per 1 mln) (World Bank 2018). Such rapid development makes this community a noteworthy object of scholarly interest, ‘because the world as a whole, and the research world of science and technology with it, is undergoing a major transformation, the exact dimensions of whose nature and future are not yet clear, and may not be for decades’ (Beaver 2001: 366). Indeed, numerous questions arise about the current state of global research community, the patterns of its evolution in recent history, and its future prospects. For example, what are the drivers behind this dramatic expansion? Is the expansion trend likely to continue in the future, and what are its possible limits? How ‘even’ has this expansion been in the cross-national perspective, and what countries have grown the most (and why is it so)? How global is the global research community – is it a truly worldwide network, or rather a bunch of tightly interconnected ‘core’ countries with a large ‘periphery’ left to develop largely on its own? How have the patterns of the community's ‘globality’ and ‘cohesion’ evolved over the recent decades?
Probably the most important manifestation of the degree of ‘cohesion’ and the extent of ‘globality’ of the global research community is international scientific collaboration. Its evolution can be traced back in history to the nineteenth century, and has been gaining significant momentum since the early 1970s (Luukkonen et al. 1993: 15). Several major factors contribute to the growing importance of international scientific collaboration. Essentially, they can be described as ‘a desire to increase knowledge, exchange skills and data, and enhance professional advancement’ (Ibid.: 16). Importantly, these desires are realized in an increasingly complex research environment, with more and more research subjects requiring such amounts and diversity of data, skills, and competence that could not possibly acquired and supported within a small closed group of researchers. Drawing on others' knowledge and experience in conducting one's own research has long been the cornerstone of scientific world, and its significance is on the rise. Indeed, scientific collaboration is listed as one of the essential features of ‘Big Science’ (Price 1986) and a logical consequence of the ‘professionalization of science’ (Beaver and Rosen 1978).
Meanwhile, the development of various means of transferring information has made a tremendous contribution to bringing down the national borders in the scientific world. Let us remember that in the late nineteenth century and up to the beginning of the World War I, the spread of telegraph – ‘the Victorian Internet’ (Standage 1998) – along with railroads and steamships largely facilitated the first ‘golden age’ of globalization, providing for the emergence of truly global networks of capital, bulk goods trade, and migration (Zinkina et al. 2019). The second ‘golden age’ of globalization was largely related to the Information Revolution, which, along with the Agricultural (Neolithic) and the Industrial Revolutions, is frequently regarded as one of the fundamental shifts in the organization of human society as a whole (for more details on the critical importance of the Information Revolution as a major watershed in the evolution of human society see, e.g., Grinin 2007; Grinin A., Grinin L. 2015; Grinin L., Grinin A. 2016; Grinin L., Grinin A., Korotayev A. 2017). The crucial innovations in information and communication technologies (ICT) facilitated a new upsurge of global integration and global connectivity in the last decades of the twentieth century and early twenty-first century; these were reflected in the expansion and intensification of various global networks, including the global network of scientific cooperation.
Indeed, the development of the ICT in the latest decades of the twentieth century and early twenty-first century made it possible to store and share previously unimaginable amounts of data and dramatically increased the visibility and accessibility of the world of researchers. Getting to know scholars specializing in a certain field, and sharing and discussing the results of research with international research community can be
a matter of a couple of hours nowadays. Thus, growing demand for collaboration from researchers, and growing supply of opportunities for such collaboration (largely facilitated by substantial progress in ICT sphere) have likely been the two critical driving forces behind the evolution of international scientific cooperation in the recent decades. In the following sections we will try to look beyond the quantitative expansion of such cooperation and to investigate the patterns of the evolution of its global network structure over time.
II. DATA AND METHODS
How can we measure the extent of international scientific collaboration? There are multiple ways to do it – by looking into the number and scale of international conferences, bilateral or multilateral research programs, joint patents, number of foreigners holding research positions in a given country's research and higher educational institutions, etc. In this paper, we choose to measure international cooperation in various fields of research through co-authorship of research papers indexed in the Elsevier Scopus database of peer-reviewed literature, currently the largest existing database of the kind (Elsevier 2018a). It includes over 23,700 peer-reviewed journals covering numerous branches of research from health sciences, physical sciences, social sciences, and life sciences. These journals originate from various regions of the world and are supplemented by more than 166,000 books and over 8.3 million conference papers. Along with some other types of publications, all these total to over 71 million records overall (and over 1.4 billion cited references) (Elsevier 2018b). We collected our data in January-April 2018, focusing on the period from 1991 to 2016. The year 1991 was specified as the lower limit of our time span because earlier data are more likely to be incomplete (the deeper in time, the more so) and to account only for a fraction of publications produced by major publishers. Time structure of collected data is presented in Table 1.
Table 1
Country-to-country scientific collaboration as reflected in paper co-authorship
|
Year |
Number of countries reported |
Number of countries mentioned |
Country-to-country data points |
|
1991 |
134 |
191 |
3,991 |
|
1992 |
135 |
197 |
4,564 |
|
1993 |
137 |
203 |
4,984 |
|
1994 |
137 |
198 |
5,244 |
|
1995 |
141 |
200 |
5,500 |
|
1996 |
141 |
205 |
6,620 |
|
1997 |
140 |
212 |
7,227 |
|
1998 |
141 |
207 |
7,249 |
|
1999 |
142 |
209 |
7,928 |
|
2000 |
140 |
211 |
7,715 |
|
2001 |
142 |
207 |
7,999 |
|
2002 |
141 |
210 |
8,377 |
|
2003 |
142 |
215 |
10,173 |
|
2004 |
142 |
217 |
10,748 |
|
2005 |
143 |
216 |
10,767 |
|
2006 |
144 |
217 |
12,208 |
|
2007 |
143 |
223 |
12,024 |
|
2008 |
142 |
216 |
12,958 |
|
2009 |
143 |
224 |
13,600 |
|
2010 |
142 |
219 |
14,643 |
|
2011 |
143 |
217 |
14,371 |
|
2012 |
143 |
220 |
15,384 |
|
2013 |
142 |
220 |
15,472 |
|
2014 |
143 |
224 |
17,758 |
|
2015 |
142 |
219 |
18,938 |
|
2016 |
142 |
219 |
20,117 |
Data source: compiled by authors to describe the dataset obtained from the Scopus database.
The first column shows the year to which the data presented in a given row belongs.
The second column shows the total number of unique ‘base’ countries in a given year. For each ‘base’ country we collected statistics on the number of its co-authorships with other countries. In each case we used Scopus report for a certain country for a given year that shows the number of cross-country co-authorships entered by this country in the given year.
The third column shows the total number of ‘referenced’ countries – that is the number of unique countries mentioned in a given year in all country reports as participants of cross-country co-authorships with ‘base’ countries.
The forth column shows how many bilateral country-to-country data points we collected for a given year. Each data point indicates the presence in Scopus database of at least one paper co-authored by researchers from a given pair of countries in the given year. For example, a data point for China and India in the year 2000 would mean that Scopus indexed at least one (or more) paper co-authored by Chinese and Indian scholars in this year.
We can see that international scientific cooperation has indeed experienced a tremendous increase during the past two decades. The total number of pairs of countries co-authoring scientific publications increased by more than five times between 1996 and 2016, from about 4,000 to more than 20,000. This gives us grounds to assume the existence of a truly global research community, whose participants are rather densely interconnected with each other. But we can be sure that this community does not look the same to all its participants. So, what does the structure of this community look like?
We view the database of bilateral country-to-country data points as a network of nodes (represented by countries) and links between them (represented by the presence of co-authorship between a given pair of countries). The methodology used to analyze this network is based on the theory of graphs. We build a graph where each country corresponds to a vertex, and the edge between two vertices of the graph corresponds to the number of publications co-authored by researchers from these two countries. However, accounting for all the existing international co-authorships would create a very dense graph with numerous edges, which would complicate further analysis of the structure of the network and understanding the dynamics of international cooperation. Therefore, we choose to visualize only the structure of main co-authorship partners – that is, we include only one edge for each country, and it would be the ‘thickest’ edge denoting the link with this country's most important partner in terms of international co-authorship. In other words, if a country A has co-authored papers with researchers from 27 countries, we do not put 27 edges on the graph, but only one – linking it to country B, with which country A shares the largest number of co-authored papers.
III. RESULTS
We present a visualization of the ‘main co-authorship partners’ graph in Figures 1–12. The area (size) of each vertex is proportionate to the total amount of publications affiliated with this country. The edge width is proportionate to the number of publication publications co-authored by this pair of countries (log-scale). Name of each vertex is the ISO alpha-3 country code (https://en.wikipedia.org/wiki/ISO_3166-1_alpha-3). Also we use regional color coding to represent countries from the same region with the same color and countries from the same continent (or the same part of the world) with similar colors. For example, all African countries in are presented in red colors; European in green; Northern, Southern and Central Americas (also Caribbean) in different tones of blue, etc. Major partner graph is a directed graph by its nature and the edge direction is also color-coded – the color of the edge corresponds to the color of vertex where this edge starts.
Let us start by viewing the structure of the ‘main co-authorship partners’ network in 1991 (see Fig. 1).
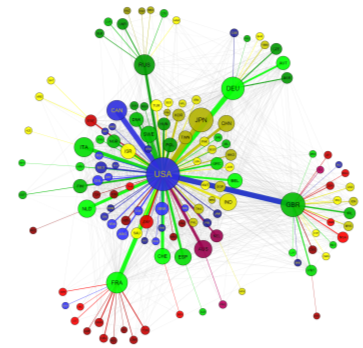
Fig. 1. Global network of main co-authorship partners, 1991
Figure 1 reveals the structure of the global network of main co-authorship partners to be of a rather distinct ‘hub-and-spoke’ type. There is a clear central hub, represented by the USA, which is the main co-authorship partner for the majority of countries in various regions of the world, including Europe, Asia, Latin America, and Africa. This means that for most countries, out of all internationally co-authored papers they published in Scopus-indexed journals in 1991, the largest share was co-authored with researchers from the USA. There are a number of second-level centers with their own clusters – for example, Germany happens to be the main co-authorship partner for Austria and a few other countries; Russia played this role for a number of post-Soviet countries (such as Belarus, Kazakhstan, and a number of others); a certain cluster was formed around France, mostly including the French-speaking African countries. The largest of the second-levels centers (and also the one with the most geographically diverse list of co-authorship partners) was Great Britain. However, the general predominance of the USA in international scientific cooperation (reflected in paper co-authorship) was obvious.
In order to disclose deeper structural layers of this network, let us try to remove the USA from the list of partners (in other words, only preserve it as a vertex with no incoming links in the network) and investigate the structure of the remaining relations (this means that for the countries having the USA as their main partner, we would switch to their second largest partner). This new network is visualized in Fig. 2.
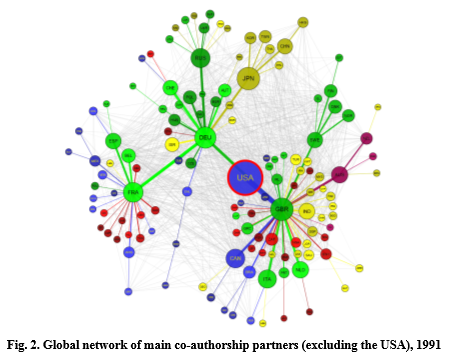
Fig. 2 reveals a significantly different network structure, as a number of distinct clusters replace the “hub-and-spoke” structure present in Fig. 1. We can see that United Kingdom plays the role of the Second Global Leader, being the second largest co-authorship partner for many European, Asian, and African countries. However, the UK does not ‘claim’ global predominance in the world of scientific cooperation to the same extent as the USA does. Along with the British-centered cluster, a number of other clusters exist. Notably, they tend to be centered around European countries, as most European countries have either Germany or Great Britain as their main co-authorship partner (notably, the Scandinavian countries form a cluster of their own around Sweden); Latin American and African countries tend to gravitate towards either Great Britain or France. The only exception is represented by an East Asian cluster centered around Japan (but we should note here that countries from other Asian regions ‘preferred’ not Japan, but Great Britain as their major co-authorship partner).
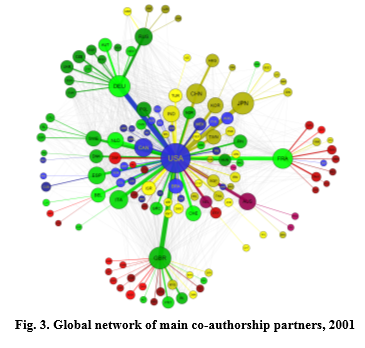
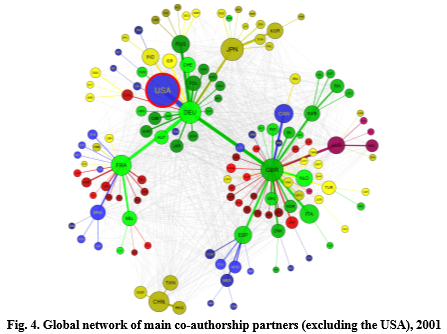
Throughout the 1990s, the USA stayed in its position of the world's most preferred major co-authorship partner. The rest of the network structure did not change much as well; however, clusters centered around Japan and Russia have become visibly smaller by 2001 (see Fig. 3). When removing all the links to the USA, we also do not see much structural change between 1991 and 2001. The only novelty is the appearance of a second ‘East Asian’ cluster centered around China – it was smaller than the Japanese one and included only four countries (China, Taiwan, Hong Kong, and Singapore), but still distinct (Fig 4). Importantly, this cluster only became visible after removing the links to USA from the network.
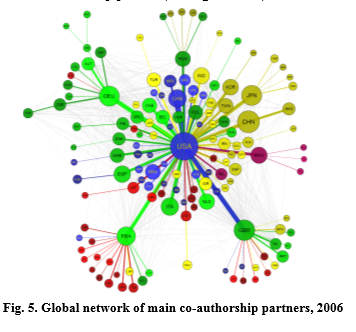
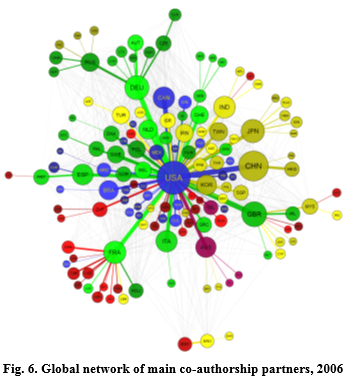
Over the 2000s, the most pronounced trend in the global co-authorship network was the increasing dominance of the USA. A number of countries from other clusters (especially from the British-centered and German-centered ones) ‘switched’ to the USA as their most important international co-authorship partner (see Figs 5 and 6).
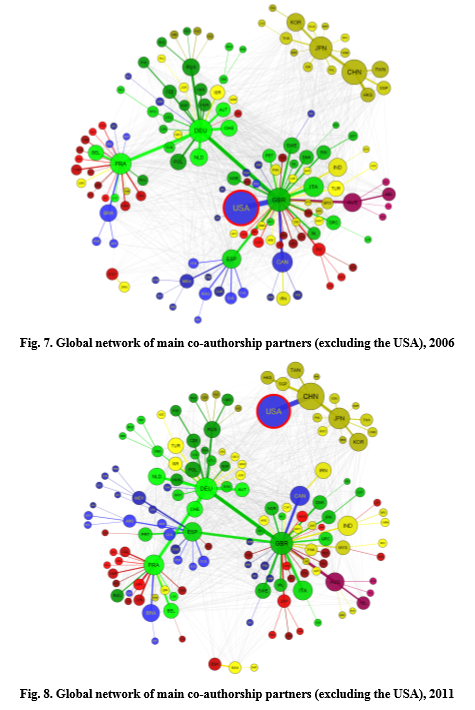
If we remove all the links to the USA and instead choose the second major partner for each of the USA-attracted countries, the evolution of the network structure over the 2000s becomes much more remarkable. First of all, the Japanese and the Chinese clusters merged into a single East Asian cluster separate from the rest of the network (this means that for all the countries in this cluster their major co-authorship partners were situated within the East Asian region, and not elsewhere). Over 2006–2011, China became the major co-authorship partner for the USA, ousting Great Britain from this position. Great Britain per se continued to play the role of the second largest center in the global co-authorship network. Its cluster continued to be geographically diverse, included European, Asian (other than East Asian), and African countries. Notably, however, many Latin American countries formed a new cluster centered around Spain, which means that the latter made its position in the network much more important (see Figs 7 and 8).
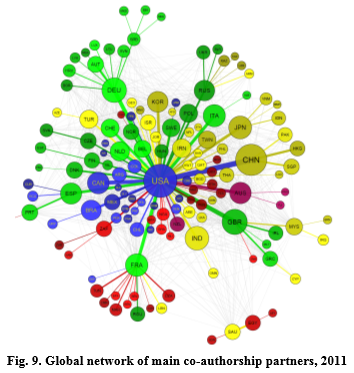
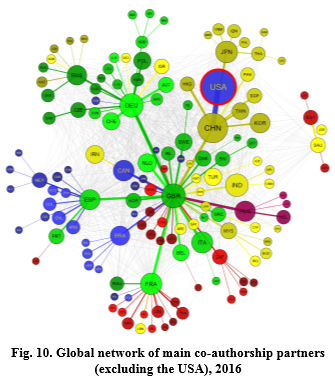
Finally, what is the current outlook of the structure of global co-authorship network? The USA has become even more central, being the most important international co-authorship partner for countries from all regions of the world. A system of second-level centers persists. Over the past 25 years, Russia and France have kept the role of major partners for post-Soviet and Francophonic African countries accordingly. Germany emerged as a distinct center of a rather large purely European cluster. Two East Asian clusters exist now instead of just one in 1991, with China emerging as increasingly strong rival to Japan. The British cluster has shrunk to just a few countries, the rest moving over to the US cluster. One can note the presence of a separate Middle Eastern cluster, but it is generally held together by a single link between Egypt and Saudi Arabia, and its future sustainability is unclear (Fig. 9).
What deeper structural patterns are covered by the global dominance of the USA? Removing all the USA-directed links form the network, we can see that the UK serves as the major ‘hub’, but it does not display such an extent of global predominance in the world of scientific cooperation as the USA does. Along with the cluster centered around UK, there are two Latin American clusters, one attracted to Spain and a smaller one to Brazil; a European cluster strongly gravitating towards Germany (among the members of this cluster there is Russia, which serves as the main partner for its own sub-cluster); a rather sizeable Asian cluster centered around China and Japan; and a predominantly African cluster connected to France. In other words, the removal of the US influence strengthens the clusters centered around Great Britain and Germany, and uncovers the presence of other regional clusters, most notably the Latin American ones.
IV. CONCLUSION
The analysis of the global network of main partners in scientific cooperation yields a number of noteworthy results discovering rather interesting patterns. First of all, the general structure of this network appears to be of ‘hub-and-spoke’ type, with the USA rather predictably playing the role of the central hub. Once all the links to the USA are removed from the network, the UK takes the place of the central hub, but the structure of
the network changes remarkably – it is not ‘hub-and-spoke’ anymore, as a number of distinct regional clusters with their respective centers appear. However, the UK can still be said to be the second globally dominant scientific cooperation partner, as it happens to be the main partner for all the centers of the regional clusters, thus holding the whole network together. Over the last quarter of a century, the evolution of the global co-authorship network followed two very different paths at two levels. At the general level, it has been increasingly turning into a ‘hub-and-spoke’ network where one central hub, the USA, clearly dominates nearly the whole of the network. However, if the impact of the USA is not taken into account, we discover a second level of the network structure with remarkably different patterns – instead of one single hub, there exist a number of centers with their respective clusters, and this structure has not been gravitating towards becoming more concentrated. If anything, its evolution has taken quite the opposite path, with a number of new centers emerging recently with their respective clusters of countries. So, while the global co-authorship network is evolving to become increasingly concentrated around one hub at the world level, at the same time, it is getting increasingly regionalized. The evolution of the drivers behind the exact patterns of regionalization – be it regional adjacency, sharing a common language or common historical past – represents a separate research task and deserves to be a subject of further studies, which will help shed light on the prospect of the future evolution of international scientific cooperation.
NOTES
* The article was prepared within the framework of the project (unique identification number RFMEFI57217X0005) with the financial support of the Ministry of Education and Science of the Russian Federation.
REFERENCES
Beaver, D. D. 2001. Reflections on scientific collaboration (and its study): past, present, and future. Scientometrics 52 (3): 365–377.
Beaver, D., and Rosen, R. 1978. Studies in scientific collaboration. Part I. The professional origins of scientific co-authorship. Scientometrics 1: 65–84.
Elsevier. 2018a. Scopus Database. URL: https://www.scopus.com
Elsevier. 2018b. Scopus: An eye on global research: 5,000 publishers. Over 71M records and 23,000 titles. URL: https://www.elsevier.com/__data/assets/pdf_file/0008/208772/ACAD_R_SC_FS.pdf
Grinin, L. E. 2007. Production Revolutions and Periodization of History: A Comparative and Theoretic-mathematical Approach. Social Evolution & History 6 (2): 75–120.
Grinin, A. and Grinin, L. 2015. The Cybernetic Revolution and Historical Process. Social Evolution & History 14 (1): 125–184.
Grinin, L. and Grinin, A. 2016. The Cybernetic Revolution and the Forthcoming Epoch of Self-Regulating Systems. Moscow: Moscow branch of Uchitel Publishing House.
Grinin, L. E., Grinin, A. L., Korotayev, A. 2017. Forthcoming Kondratieff wave, Cybernetic Revolution, and global ageing. Technological Forecasting and Social Change 115: 52–68.
Luukkonen, T., Tijssen, R., Persson, O., and Sivertsen, G. 1993. The measurement of international scientific collaboration. Scientometrics 28(1): 15–36.
Price, D. J. 1986. Little Science, Big Science ... and Beyond. New York: Columbia University Press.
Standage, T. 1998. The Victorian Internet: The remarkable story of the telegraph and the nineteenth century's online pioneers. Phoenix.
World Bank. 2018. World Development Indicators Database. Researchers in R&D (per million people). URL: https://data.worldbank.org/indicator/SP.POP. SCIE.RD.P6?view=chart
Zinkina, J., Christian, D., Grinin, L., Ilyin, I., Andreev, A., Aleshkovski, I., Shulgin, S., Korotayev, A. 2019. Big History of Globalization: The Emergence of a Global World System. Springer: forthcoming.