The Dependence of Demographic Processes in Russia on the Grain Crop Yields and Alcohol Consumption: A Comparative Analysis of the Data on the Late Nineteenth to Early Twentieth Century and on the Late Twentieth to Early Twenty-First Century

Journal: Social Evolution & History. Volume 21, Number 1 / March 2022
DOI: https://doi.org/10.30884/seh/2022.01.05
The present paper examines the peculiar demographic and socio-natural processes observed in rural areas of the Central Black Earth Region during two chronological timespans: at the turn of the twentieth century and in the period from the late twentieth to early twenty-first centuries. With respect to the late imperial period, one can argue that even quite inaccurate statistics show the dependence of demographic indicators on natural cycles; however, due to modernization, this dependence begins to transform and reduce. In historiography, there is a common belief that the last evident manifestation of the dependence of the Russian society on natural cycles was the famine of 1946–1947; yet the subsequent fading of the effect of these cycles has hardly been studied. A hypothesis is put forward that during the 1990–2000s, which were hard in socio-economic terms, the lean years has influenced demographic processes again as an echo.
We also consider such a ‘non-socio-natural’ phenomenon as alcohol consumption as a factor of demographic change. We came to the conclusion that the relationship between alcoholism and mortality in Russia was little noticeable at the beginning of the twentieth century but very clearly manifested itself at the turn of the twentieth century.
Keywords: Russia's socio-natural synergy, birth and death rates, grain crop yields, alcohol consumption, correlation.
Vladimir L. Dyachkov, Tambov State University named after G. R. Derzhavin more
Valery V. Kanishchev, Tambov State University named after G. R. Derzhavin more
Konstantin S. Kunavin, Tambov State University named after G. R. Derzhavin more
In recent decades, there has been a growing interest in socio-natural research and in the influence of natural and cosmic processes on the society, particularly this may be traced in the teachings of Alexander L. Chizhevsky. For obvious reasons, this research is dominated by a global approach. One of the striking examples is an article by Andrey V. Korotayev, Stanislav E. Bilyuga, Sergey Yu. Malkov, and Daniil A. Osipov published in 2016 in the journal Istoria i sovremennost [History and Modernity]. The authors provide a careful assessment of the obvious yet limited impact that solar cycles have on massive protest movements in society (Korotayev et al. 2016).
We believe that the local approach to the study of interaction between nature and society can be useful for such research as well, making it possible to see in more detail ‘the terrestrial echo of solar storms.’ In particular, in 2014, the Tambov historians and museum experts together with Moscow geographers held a round table dedicated to the 50th anniversary of Alexander L. Chizhevsky's death. During the meeting, various aspects of the impact that the study of solar cycles has produced on the development of geographical and historical sciences were discussed; there were also presented the results of particular studies at the regional level.1
The works of one of the authors of the present article Valery V. Kanishchev and his students, Evgeniy V. Yakovlev and Ruslan V. Suvorin provide examples of such studies at the regional level which deal with the impact of natural disasters on the daily life of traditional society derived from the analysis of data on the Tambov province. In particular, they demonstrate the ambiguous influence of rise and decline in solar activity on crops, various epidemics, and epizootics (Yakovlev 2003; Kanishchev and Suvorin 2015; Suvorin 2015). The Tambov historians pay special attention to the impact of socio-natural factors on protest movements in the region (Dyachkov et al. 2006; Kanishchev et al. 2009).
When studying local socio-natural processes, one of the present authors (Vladimir. L. Dyachkov) has discovered natural-demographic rhythms which are considered the major achievement of the Tambov historians. The causal relationship between massive crop failures, hunger strikes, and a surge in deaths is a well-known characteristic of any traditional agricultural society. We revealed the mechanisms underlying this seemingly obvious relationship. With the discovery of the 28-year and 112-year natural-demographic rhythms and their general structures taken together with the cyclic nature of the yields of staple grain crops (winter rye, oats, and millet) in pre-revolutionary Russia (high yield had a period of seven years; and low yield – a period of three-four years), it became obvious that minimum yields would coincide with the years of the cyclical maximum of birth rate – with corresponding peaks in hunger-epidemic mortality and with minimum positive or negative growth. The main devastating famines, intensified by concomitant diseases, would occur every fourteen years, accurately as an atomic clock, and they would ‘cover’ the period from the nineteenth to the twenty-first year of the 28-year rhythm – the most intense ones in terms of population growth (in particular, in the nineteenth – the early twentieth centuries, the crop failures and epidemics occurred in c. 1821, 1849, 1877, 1905, 1933); as well as slightly the less ‘prolific’ fifth–seventh years of the rhythm (c. 1807, 1835, 1863, 1891, 1919, and 1947). But when the agrarian overpopulation increased at the 70-year upswing phase of the 112-year cycle (1836–1905 within the 1836–1947 cycle) and the transition to the 42-year phase of overpressure relief occurred, these weakest and unfruitful regulators would bring about more and more deaths due to starvation and related causes (Dyachkov 2002).
One of the present authors' paper on the relationship between natural and socio-demographic processes and the growing peasant aggression in the first third of the twentieth century has been appreciated by the community of socio-natural history supporters (Dyachkov 2014).
In preparing this article, we took as a premise that the famine of 1946–1947 was the last evident manifestation of the severe dependence of the Russian society on natural cycles. But the subsequent fading of the effect of these cycles on the population of Russia has hardly ever been studied. We put forward and tried to substantiate a hypothesis that in the 1990s–2000s, which were harsh in terms of socio-economic situation, the lean years influenced the demographic processes once again, like an echo.
At the same time, speaking about the late twentieth century, especially its last decade, historians and demographers point out that natural population change was significantly influenced by the factor of alcohol consumption. In the early twentieth century, the alcohol abuse was not considered as an evident demographic factor. So we decided to examine this issue, using modern quantitative methods and information technologies.
The above descriptions of natural-demographic cycles were originally derived basing on the data on the Tambov province. Replenishing the model with data from neighboring Voronezh, Kursk, Oryol, Penza, Ryazan, Saratov, and Tula provinces (see Fig. 1) has confirmed that natural rhythms (a combination of a seven-year and three-four year cycles) were so prominent and common in the Russian village that they clearly ‘break’ through all the distortions and vicious predetermination of information sources.
Approaching any issue of Russian history which is somehow related to the problem of harvests, a historian inevitably finds himself in a historiographical maze whose intricate paths are formed by a tangle of state, department, and zemstvo statistics, and the everyday wits of peasants, who used to hide the real harvest of grain from the authorities. There were also many tricks used in a population count. Now it is well known that the calculated results contained not only errors of complex count but also deliberate falsifications. The present-in-area population count was especially complicated. Whereas natural population change at the primary level was recorded at least in parish registers, bureaus of vital statistics, and medical institutions, it is quite difficult to calculate any percentage and per mille when it comes to migration movements in a country where, up until 1980, there was no full passport registration and, to this day, there is still a huge, little recorded circular and seasonal migration.
We took the liberty of ‘bypassing’ these intricacies, having decided not to get involved in the disputes between the neo-Malthusians and their opponents over the consumption level in Russia in the nineteenth and early twentieth centuries, and once again tried to examine the rhythms of crop yields as the most profound socio-natural factor of demographic processes in traditional society.
We deliberately extracted the yield data from two ‘compromised’ sources: the governor's reports and articles by Vladimir M. Obukhov (famous Soviet statistician of the 1920s–1930s, pre-revolutionary graduate of Moscow University). In the former, there is a downward trend of changes in yields per capita; in the latter, an upward or evolutionary trend, as the author puts it. It is crucial for us that it turned out that the change of indicators in both graphs almost perfectly coincides with the natural-demographic rhythms.
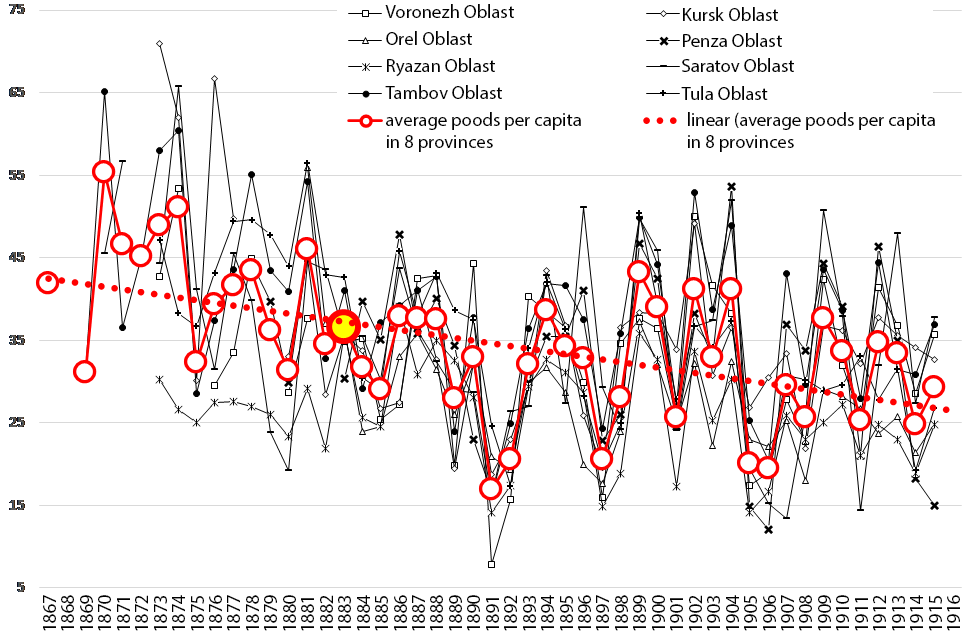
Fig.
1. Provincial and average indices of grain harvests per capita
in eight provinces of the south of Central Russia, 1857–1915
(the indicator of 1883, as the beginning of harvest records according
to Obukhov, is highlighted in the middle line with larger circle)
One should just point out that Figure 1 does not show real harvests or yields but rather their biased representation in the governor's reports on staple grain harvests. Yet, as we will see later, even this distorting mirror and distorting filter does not suppress the strongest connection between grain production and the demographic behavior of people who lived and died being uniformly and naturally connected to all social disturbances.
It needs to be specifically pointed out that the graph of absolute grain harvests during the ‘Obukhov’ period from 1883 to 1915 was an upswing that corresponded to the trend of population growth index according to which, the growth of natural (inherent) fertility in this interval of the 112-year rhythm and a decrease in mortality due to modernist intrusions meet in a social-natural way.
The study of natural population change in the same eight provinces shows that the situation with ‘synergistic socio-natural’ people was much more complex and intriguing compared to that with harvests. Despite all shortcomings and defects of the sources, there are components of a uniform change in the Russian population, with its regional details, that can be seen.
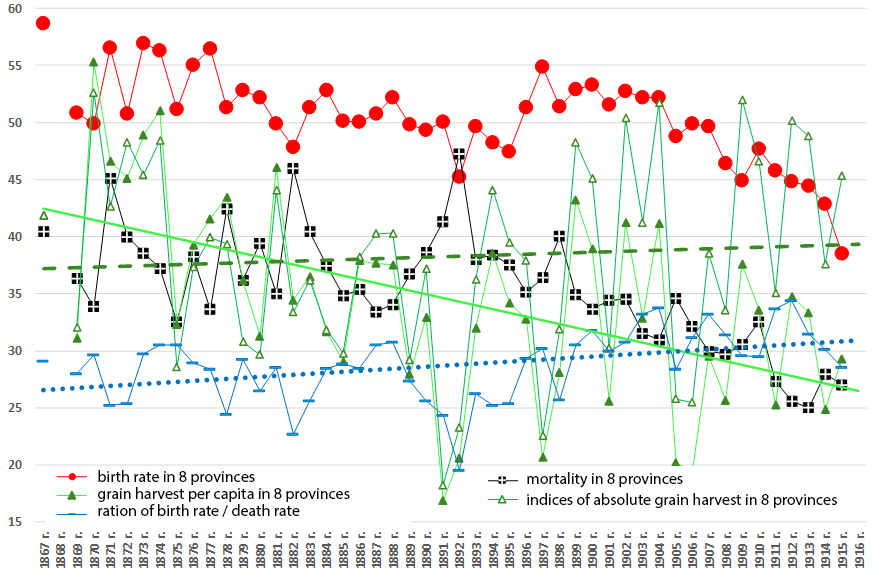
Fig. 2. Average values of birth
and death rates, population growth index,
per capita and total grain harvest in eight provinces of the south
of Central Russia, 1867–1915
Notes: Fertility and mortality rates are calculated in ppm, with interpolations of gaps in the data of the governor's reports on the actual population for particular years in certain provinces.
The growth index – the Pokrovsky / Pearl coefficient was calculated using the birth / death formula * 20, where 20 is the coefficient for scale correlation (to make comparison with the indices of fertility, mortality, and per capita fees all in the same graph). Per capita grain collection index is expressed in poods.
The index of total grain harvest is calculated according to the formula: absolute harvest in million poods / 2,000,000, where 2,000,000 is the coefficient for scale correlation (the indices of fertility, mortality, and per capita fees – all of which can be possibly compared within the same chart).
In Figure 2 fertility looks sharply descending by one and a half times over 49 years. This is due to the peculiarity of the present-in-area population count in the governor's reports of the late 1880s – 1905, in which a natural increase during the reported year was simply added to the population data of the previous year. This approach ignored the growing migration from the provinces under study in the late nineteenth – early twentieth centuries. Therefore, the reports overestimated population in the areas between censuses and, respectively, underestimated any indices that were calculated based on population. Once the denominator of the fraction became ‘correct’ in the census years, the demographic and other ‘per capita’ indices would surge immediately. This is quite visible in our graph at the point of 1897, the year when it was revealed by means of the General Census that the population of certain provinces in previous years had been clearly overestimated by tens of thousands of people.
And yet with all mentioned distortions of the population statistics of that time, the general pattern of natural population change, as a representation of the basic components, remained the same. And this base (specifically, with birth rate in traditional and slightly transitional populations) is natural, with the account of the mechanisms of the 28-year and 112-year cycles. The period between 1867 and 1916 covered the 28-year cycles of 1857–84 and of 1885–1912 and ‘expanded’ into the beginning of the 1913–1940 cycle. Their rhythmic waves contain intervals when the accumulated population pressure was relieved, which manifested in decreasing natural fertility and increasing mortality. The intervals of such a relief within the 28-year cycles of the period in question are 1881–91 and 1909–12. Within the 112-year cycle, there is a period of the same duration (3/8 of cycle) and intended purpose. In this case, it is the cycle of 1836–1947 and its ‘military-revolutionary’ phase (MRP) of relief of the population overpressure via a number of socio-natural measures between 1905–06 and 1946–47. When the MRP of the two mentioned cycles overlapped, the suppressive effect intensified (in this context, there was a ‘minor MRP’ of 1909–1919 within a ‘major MRP’ of 1905–47) – and here we have a drop in birth rates from 1905 onwards.
At the same time, the 28-year cycles contain ‘female attacks’ (first and third (the most robust) seven-year periods) with increased natural fertility – the birth rate during these periods and among female cohorts – children of ‘female attacks’ (the cohorts born in the first and third seven-year periods thus having had higher endogenous female fertility – namely for the period described born in 1871–77, 1885–91, and 1899–1905 and who made their own families after the late 1880s). When the ‘female attacks’ occurred at the upswing of the 112-year wave, the birth rate would increase even more. In this case, the periods of the strongest ‘female attacks’ are the third seven-year periods of 1871–77 and 1899–1905.
The ‘female attacks’ of the late nineteenth century became the major contributor to a unique and paradoxical decrease in the age of first marriage in the countryside by two years, with a corresponding increase in the number of births.
The general downward trend in fertility in the period under study is mainly due to natural factors: the ‘birth center’ was shifting from female cohorts with the highest natural fertility to cohorts with suppressed fertility.
One should point out the following quite small modernist contributions to the synergism of the declining fertility in the early twentieth century (before the First World War): median ages at first marriage in rural areas rose by 1–1,5 years; the first timid and intermittent steps of contraception and abortion (up to 2 per cent of rural women by 1914); and a small increase (from 12 to 15 per cent in Russia, from 4–5 per cent to 6–7 per cent in the macro-region under study) in the share of city dwellers who switched to a family of 4–5 children and an insignificantly increased share of singlehood and single-parent families in the village. The ‘fading’ birth rate in 1905 was caused by conscription and losses in the Russo-Japanese War and the perturbation of the first revolution.
The First World War, due to the mass withdrawal of fiancés and husbands, brought on average a twofold decline in the birth rate in the macroregion. But that would happen by 1917, whereas in 1915 – the last year of the presented line of available information on the correlation between people and bread – a factor of a great war became a noticeable accelerator of the birth rate decline that had been already launched due to natural causes.
Similar to the birth rate, the mortality graph in Figure 2 demonstrates a downward trend but with a different mobile socio-natural combination of decline factors in this segment.
The general and ‘purely’ natural purpose of death is that it acts as a regulator controlling a biological species and preventing its disruptive reproduction. As for people (the Russian peasants in particular), death with varying degrees of effectiveness, cut off the population surplus and suppressed the population exponential growth via an extremely high and constant infant and child mortality, epidemic mortality crises with an individual cycle of causes of death, cyclical crop failures (famines), endogenous cyclical decreases in fertility, the spread of diseases causing infertility (sexually transmitted diseases, diseases of the endocrine system, typhoid fever, malaria, inbreeding, etc.) and, of course, major war deaths.
In our case, everything went on ‘as it used to be’ until the mid-1890s, as long as death would restrain surplus growth with diseases and famine (a noticeable convergence of birth and death rates in 1871, 1881, 1892 – with a high overall mortality rate). And that is when the worried foresters poked into the anthill: health care from the city and the state came to the village and propagated itself. And the overall mortality rate, starting with infants and children, began to decline at a rapid rate at the point of the cycle when nature intended it to increase. Instead of narrowing the growth corridor, its ‘scissors’ opened – with all the immediate catastrophic social consequences.
According to Figure 2, comparatively poor harvests and epidemics of the 1870s – 1880s time and again resulted in mortality spikes of over 40 ‰. The last sharp rise in the indicator occurred in the hungry years of 1891–1892. The figure clearly shows the decoupling of mortality from crop failure. Even in the revolutionary critical years of 1905–1906, the death rate would not rise above 35 ‰.
Therefore, instead of being ‘natural and correct’ (as in some traditional rural societies), that is descending or horizontal, the growth index in the period after the mid-1890s, became slightly ascending, thereby creating the Russian ‘demographic scissors’ of the early twentieth century which meant preserving of a high, although declining, birth rate coupled with a much faster drop in mortality. All this happened in conjunction with a downward trend in per capita grain harvests accompanied by slowly growing absolute grain harvests, now forming ‘the Russian bread cross’ with population increase index.
The latest research on the long and continuous series of complex life and anthropometric statistics has advanced our understanding of the correlation between grain production and population. Over the past 10–15 years, representative electronic databases have helped to reveal a positive correlation between increasing social aggression and noticeably shorter life expectancies for those born in the deadly and stressful famine-epidemic and war years; besides, the age of menarche among the females in these cohorts turned out to be 2–3 years later than among the girls born in ‘fruitful and healthy’ and peaceful years (Dyachkov, Shcherbinin 2019; Dyachkov 2019a, 2019b).
On the basis of the analysis of abundant sources like the German registration of Soviet prisoners of war and those deported to the Third Reich, it has been proved that there is a connection between height, as a reflection of the farmers' general health and vitality, whose foundations were laid by prenatal development and the first infancy weeks, hence, depending on the season (months) of fertilization and birth. Thus, children of both sexes born in any agricultural region in late autumn and winter (peak in December–January) of any year during the period from 1885 to 1926 grew 3–5 cm taller than their June–July counterparts. That is, invariably in the ideal annual wave, those whose perinatal and neonatal periods fell on the months from the end of the harvest to the beginning of Lent, which were the most abundant in terms of food for their mothers, became noticeably taller and stronger in general. And on the contrary, the majority of those, who were carried to full term and born at the time of ‘finishing up’ the previous year's stocks and the spring–summer harvest, would be undersized and have weak health. This is strictly from an objective scientific rather than humanistic perspective (which is not that cheerful at all) that this rhythm turns out to be a remarkable negative feedback, aimed at curbing the reproduction of grain growers. After all, it was during two short intervals of the period from the end of September to January separated by the Christmas Fast that the peasantry arranged 90 per cent of their weddings; this was the well-fed time when, both in young and ‘old’ families, more than a third of the annual ‘amount’ of children would be conceived, with the formation of a constant summer maximum of births. And it was these largest cohorts of pregnancies and births that would soon end up in the worst conditions of the year in terms of preservation and survival, providing the highest rates of involuntary miscarriages and infant mortality in a year. So one should have been lucky to survive to his/her youth and maturity when it would become possible to measure one's height. By the way, this aspect of correlation between grain production and people's lives brings us back to the assessment of church marriage sanctions and to the issue of ‘December births’ and the natural optimal time for conception (in spring and early summer!) – the approach which the urban population was implementing, bidding farewell to the agrarian rhythm of population reproduction and church ‘Lenten’ instructions regarding marital sex life.
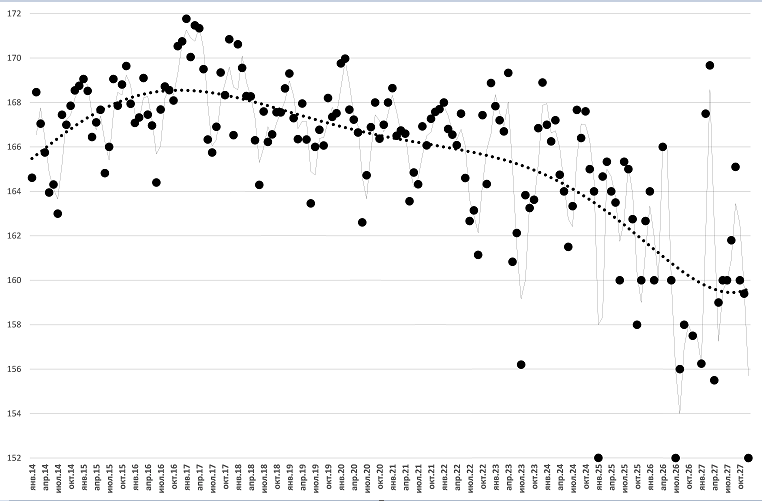
Fig. 3. The movement of the average height of Tambov men
depending
on the month of their birth in the period from 1914 to 1927 (absolute values in
cm; sample 2,439 people. Category: Soviet prisoners of war
of the Second World War, born in the
current borders of the Tambov region)
Source: Generalized data bank ‘Memorial’. URL: https://obd-memorial.ru. Accessed April 25, 2020.
Similar results were obtained from analysis of the height of Soviet prisoners of war during the Great Patriotic War – those who were born in St. Petersburg-Petrograd-Leningrad, in Moscow, in the Vologda Province, and in the Uzbek SSR.2
For the period from the late twentieth to early twenty-first century, we have studied the ratio between harvests and mortality in five regions of the Central Black Earth Region (namely, Belgorod, Voronezh, Kursk, Lipetsk, and Tambov provinces) and adjacent provinces of the south of Central Russia and the Volga region (Bryansk, Oryol, Tula, Ryazan, Penza, and Saratov provinces). The most typical graph of the ratio between the two indicators seems to be obtained for the Lipetsk province.3
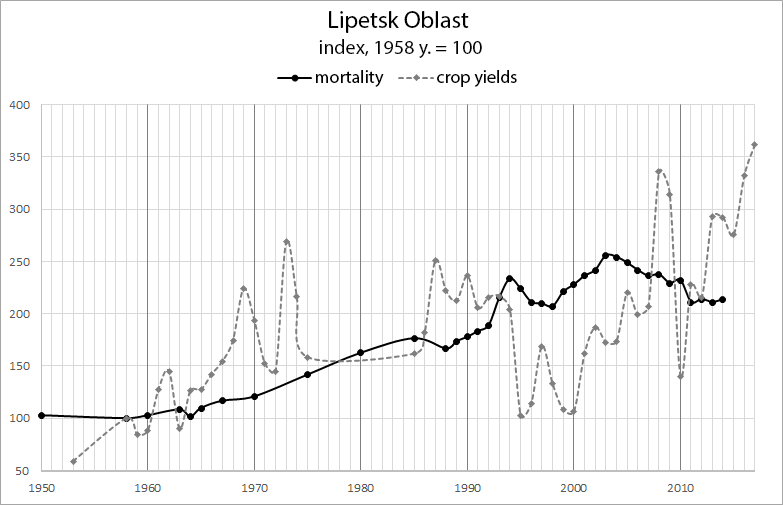
Fig. 4. Ratio of grain yield and
mortality in the Lipetsk province
in the 1950s – 2010s
If we take into account the delayed effect of the natural-demo-graphic cycles, we can assume that after the hungry and deadly years of 1946–1947, the fluctuations of these cycles would again manifest themselves in the Russian society weakened by severe economic crisis in the 1990s and early 2000s. Most likely, these were some manifestations of the ‘echo’ of traditional society, reinforced by other factors.
Our graphs of mortality and harvests for the modern period (similar to the one for Lipetsk) show, in particular, that in 1994–1996 (the 19th –21st years of the 28-year cycle), in 2003 (the last year of the 28-year cycle), and in 2010 (the seventh year of the new cycle), there was observed a small but widespread rise in mortality combined with a low crop harvest in all studied areas.
At the level of individual rural settlements of the Tambov province for which the rural council data on population change have been collected to date, we observed a rise in mortality in Verkhniy Chuevo, Sosnovka, Semenovka, and Pakhotny Ugol in 2003. But this phenomenon was evident not in every village council report with known demographic data. Apparently, at the micro level, the relationship between crop yields and mortality did not manifest everywhere. However, this issue requires further study with the involvement of a wider range of data and ‘appropriate’ research methods.
To study the so-called excess mortality, we considered the calculations conducted by Valery Kanishchev and Sergey Nefedov for the period of the 1870–1890s. The excess mortality for this period was calculated as the excess of mortality in the current year above the average mortality of adjacent ‘normal’ years: with the given frequent crop failures in that time, the years i – 4, i – 3, i + 3, i + 4, that is two years preceding and two years following the year i (the year of famine) were taken as the adjacent ‘normal’ years for the year i. The authors of these calculations came to the conclusion that excess mortality was common for the Russian post-reform society. Between 1871 and 1893, none of the provinces of Russia's European part managed to escape the increasing mortality. In most of them, there were recorded 10–12 years with excessive mortality. There were different ‘crop yield waves’ lasting from of 2–3 to 7 years (Kanishchev and Nefedov 2012).
In the present article, we have extended this analysis to the period of 1894–1909. The results show that the same ‘crop yield waves’ still produce certain effect. This was especially evident in 1905–1906 when, even with calculations with a double step back, a situation similar with particularly heavy mortality in 1891–1892 (i.e., two previous seven-year periods) was repeated.
An attempt was made to calculate the excess mortality for the crisis periods of the 1990s and 2000s, using the same methodology. It is obvious that in all five provinces of the Central Black Earth Region and five adjacent provinces the excess mortality was manifested in the most crisis years of 1993–1995. Then, after some ‘pause’ during the second half of the 1990s, the excess mortality was recorded in 2000–2006 and in 2010. The connection with a drop in crop yields is more or less traced with respect to 1994–1995, 2003; to a lesser extent to 2010. The indicators for other years require further explanation, as well as justifying the application to the modern society of the methodology developed basing on the data from traditional society. But still, we can once again argue with sufficient certainty that in a situation of crisis, modern society turns out to be dependent on natural-productive factors.
Table 1
Correlation between the crop indicators and mortality in provinces of southern Central Russia in the 1860s – 1910s
|
Province |
Linear |
Rank |
||||||||||
|
unbiased |
biased |
unbiased |
biased |
|||||||||
|
N |
r |
p |
n |
r |
p |
n |
r |
p |
n |
r |
p |
|
|
Voronezh |
35 |
–0.41 |
0.02 |
33 |
–0.36 |
0.04 |
35 |
–0.32 |
fail |
33 |
–0.21 |
fail |
|
Kursk |
30 |
–0.11 |
0.58 |
29 |
–0.21 |
0.27 |
30 |
–0.22 |
fail |
29 |
–0.31 |
fail |
|
Oryol |
12 |
0.18 |
0.57 |
11 |
0.19 |
0.58 |
12 |
0.18 |
fail |
11 |
0.05 |
fail |
|
Penza |
16 |
–0.36 |
0.17 |
13 |
–0.35 |
0.23 |
16 |
–0.44 |
fail |
13 |
–0.27 |
fail |
|
Ryazan |
40 |
–0.43 |
0.01 |
39 |
–0.22 |
0.19 |
40 |
–0.43 |
sign |
39 |
–0.19 |
fail |
|
Saratov |
30 |
–0.17 |
0.38 |
29 |
–0.15 |
0.43 |
30 |
–0.18 |
fail |
29 |
–0.21 |
fail |
|
Tambov |
36 |
–0.23 |
0.18 |
36 |
–0.05 |
0.79 |
36 |
–0.24 |
fail |
36 |
–0.06 |
fail |
|
Tula |
37 |
–0.17 |
0.31 |
36 |
0.09 |
0.61 |
37 |
–0.10 |
fail |
36 |
0.09 |
fail |
Sources: Livron V. Statistical Review of the Russian Empire. SPb, 1874; Statistical Chronicle of the Russian Empire. SPb, 1866–1912.
Notes: the unbiased series brings together the gross grain harvest data with the mortality data for the same year; the shifted series compares the mortality data with the previous year's grain harvest; n is the number of data pairs, r is the correlation coefficient (linear: r-Pearson; rank: r-Spearman), p is the probability of error (fail: p > 0.05; sign: p ≤ 0.05).
The correlation analysis of dependence of mortality on the gross grain harvest in the same provinces for 1857–1915 was also carried out. Calculations were performed in biased and unbiased form. Calculations showed that in the late nineteenth century a strong dependence of mortality on crop failure was rare. Two cases of statistically significant correlation were revealed: in the Voronezh and Ryazan provinces. In our opinion, this result, paradoxical from a general historical point of view, could be due to the fact that the correlation analysis, performed using Pearson correlation coefficient, is insufficient to assess the complex synergy between factors of natural-space cycles.
Next, we decided to apply the most well-known method to reveal a nonlinear dependence, using Spearman's rank correlation coefficient (its point is that it is not the values of specific indicators that are to be compared but rather their ranks, hence the scale of changes disappears and only the direction of growth or decline remains).
The application of Spearman coefficient to the data of the eighteenth – early twentieth century revealed even fewer statistically significant correlations than the application of the Pearson's linear correlation coefficient to the same data. Despite the fact that the Spearman coefficient itself should also easily detect linear correlations, those cases that were statistically significant for Pearson are no longer those for Spearman (with one exception of Ryazan province). Even more surprising is that Spearman is sometimes used when the initial data is of poor quality, that is, the requirement for data series in this method is lower than that of Pearson's coefficient, however the latter worked better in our case. It is fair to assume that the whole problem lies in the criterion of statistical significance, which strongly depends on the length (but not the quality) of the series; and, apparently, for Spearman this series should be longer than for Pearson. This is why several cases, despite a good correlation coefficient (e.g., mortality in the Penza province), did not fall into the category of statistically significant due to the lack of observations. Nevertheless, the application of the Spearman coefficient to the data of the nineteenth and early twentieth centuries gives us practically nothing new. Rather, on the contrary, the correlation for that period is closer to linear. However, the main point is, probably, that any correlation dependence is insufficient to explain a more complex demographic ‘picture’ generated by the superposition of different natural rhythms and cycles.
Table 2
Correlation of yield and
mortality indicators in the oblasts
of the southern Central Russia in the 1950s – 2010s
|
Oblast |
Linear |
Rank |
||||||||||
|
unbiased |
biased |
unbiased |
biased |
|||||||||
|
N |
r |
p |
N |
r |
p |
n |
r |
p |
n |
r |
p |
|
|
Belgorod |
37 |
0.29 |
0.08 |
34 |
0.21 |
0.23 |
37 |
0.14 |
fail |
34 |
–0.03 |
fail |
|
Bryansk |
35 |
–0.28 |
0.10 |
33 |
–0.36 |
0.04 |
35 |
–0.49 |
sign |
33 |
–0.59 |
sign |
|
Voronezh |
36 |
–0.08 |
0.66 |
34 |
–0.18 |
0.32 |
36 |
–0.25 |
fail |
34 |
–0.34 |
fail |
|
Kursk |
36 |
0.24 |
0.16 |
34 |
0.11 |
0.52 |
36 |
0.05 |
fail |
34 |
0.06 |
fail |
|
Lipetsk |
36 |
0.4 |
0.02 |
34 |
0.28 |
0.11 |
36 |
0.34 |
sign |
34 |
0.14 |
fail |
|
Oryol |
36 |
0.51 |
0.00 |
34 |
0.45 |
0.01 |
36 |
0.42 |
sign |
34 |
0.26 |
fail |
Table 2 (continued)
|
Oblast |
Linear |
Rank |
||||||||||
|
unbiased |
biased |
unbiased |
biased |
|||||||||
|
N |
r |
p |
N |
r |
p |
n |
r |
p |
n |
r |
p |
|
|
Penza |
36 |
–0.58 |
0.00 |
34 |
–0.57 |
0.00 |
36 |
–0.61 |
sign |
34 |
–0.60 |
sign |
|
Ryazan |
36 |
–0.02 |
0.90 |
34 |
–0.15 |
0.39 |
36 |
–0.15 |
fail |
34 |
–0.28 |
fail |
|
Saratov |
36 |
0.1 |
0.54 |
34 |
0.06 |
0.75 |
36 |
–0.16 |
fail |
34 |
–0.21 |
fail |
|
Tambov |
36 |
0 |
0.98 |
34 |
–0.10 |
0.56 |
36 |
–0.21 |
fail |
34 |
–0.28 |
fail |
|
Tula |
36 |
–0.05 |
0.79 |
34 |
–0.15 |
0.39 |
36 |
–0.21 |
fail |
34 |
–0.30 |
fail |
Sources: National Economy of the RSFSR (Statistical Yearbook). Moscow, 1956–1990; Russian statistical yearbook, Moscow, 1991–2014.
Notes: the unbiased series brings together the gross grain harvest data with the mortality data for the same year; the shifted series compares the mortality data with the previous year's grain harvest; n is the number of data pairs, r is the correlation coefficient (linear: r-Pearson; rank: r-Spearman), p is the probability of error (fail: p > 0.05; sign: p ≤ 0.05).
It may seem that modern society should not be characterized by a strong dependence between demography and productivity. But in our calculations, there were more correlated cases revealed than in the data of the late nineteenth – early twentieth centuries. Rank correlation is indeed more common than linear, but only if all three indicators are taken into account: fertility, mortality, and natural increase (this just proves that birth rate and death rate should not be separated in demographic analysis).
It can be assumed that the dependence of demographic processes in the Russian countryside is still more on crop yields than on natural-space cycles, yet this dependence ceases to be linear (each measurement is distorted by many different external anthropogenic factors).
Alcohol consumption is considered one of these modern factors. Trying to find out the origins of the interdependence between alcohol consumption and mortality in Russian society, we turned to statistics of the early twentieth century.
Table 3
Correlation between mortality and alcohol consumption in the provinces of southern Central Russia in 1890–1909
|
Province |
Linear |
Rank |
||||
|
n |
r |
p |
n |
r |
P |
|
|
Voronezh |
19 |
–0.59 |
0.01 |
19 |
–0.45 |
fail |
|
Kursk |
20 |
–0.50 |
0.03 |
20 |
–0.74 |
sign |
|
Orel |
20 |
–0.34 |
0.14 |
20 |
–0.37 |
fail |
|
Penza |
15 |
–0.40 |
0.14 |
15 |
–0.25 |
fail |
|
Ryazan |
20 |
–0.68 |
0.00 |
20 |
–0.72 |
sign |
|
Saratov |
15 |
–0.58 |
0.02 |
15 |
–0.64 |
sign |
|
Tambov |
16 |
–0.58 |
0.02 |
16 |
–0.58 |
sign |
|
Tula |
20 |
–0.67 |
0.00 |
20 |
–0.72 |
sign |
Sources: Yearbook of Russia 1909. St. Petersburg, 1910; Dmitriev 2019; Ministry of Finance. 1904–1913. SPb, 1913.
Calculations of linear and rank correlations based on the data on the late nineteenth – early twentieth century in per capita alcohol consumption and mortality in almost all provinces revealed an inverse statistically significant dependence. Back at the beginning of the twentieth century, the Russian economist and statistician Vladimir K. Dmit-riev argued that there had been no connection between crop failures and alcohol consumption since the end of the nineteenth century. No less remarkable is this scholar's figurative expression that it is not ‘Mr. Har-vest’ but ‘Mr. Capital’ (Dmitriev 2019) that determines the level of alcohol consumption in the country.
Modern researchers Daria A. Khalturina and Andrey V. Korotayev, using abundant statistical data, indicate that alcohol is the most important factor for the male mortality in industrialized countries. With regard to Russia, these authors reminded that in the 1970s, Soviet demographers began to associate the growing gap between the life expectancy of men and women with high consumption of alcohol by the former. As Khalturina and Korotayev emphasized, this issue has been clarified in the study of the consequences of the anti-alcohol campaign in the Soviet Union in 1984–1987 – when actual alcohol con-sumption significantly decreased. This led to a drop in mortality, especially from alcohol poisoning. After the anti-alcohol campaign was abolished, the death rates, especially the adult male mortality, grew sharply. According to Khalturina and Korotayev, in 1995–1998, the alcohol consumption indicators in Russia dropped again; but starting from 1999, due to the alcohol tax cuts, a new growth in the indicator began (Khalturina and Korotayev 2006).
In their latest research, these authors and their colleagues noted that the 2006 measures to reduce alcohol production and to tax denatured alcohol and ethanol-containing liquids caused a drastic reduction in mortality. They illustrated this with a corresponding graph. (Khaltourinaand Korotayev 2015; Khaltourina et al. 2018).
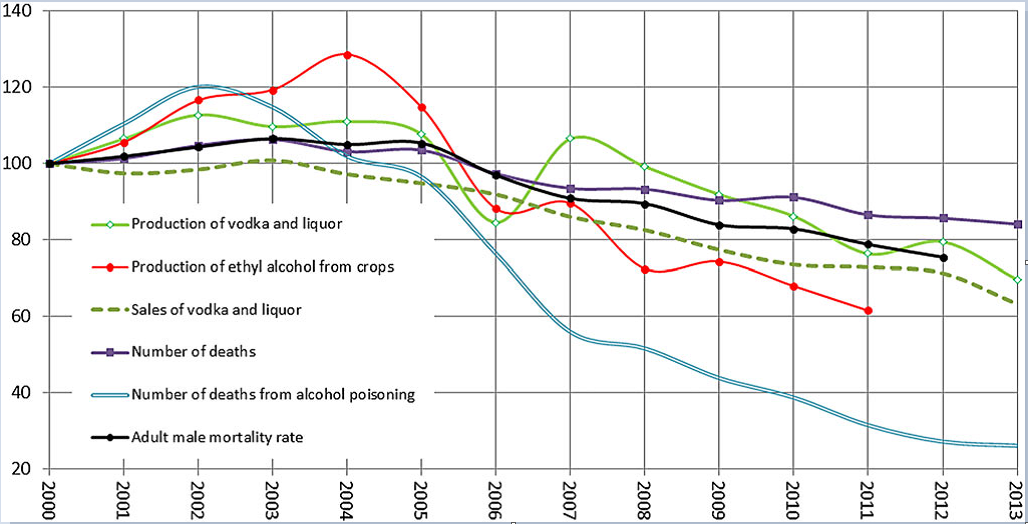
Fig. 5. Alcohol production,
sales and mortality in Russia, 2000–2013
(100 = the level in 2000)
Source: Khaltourina and Korotayev 2015.
One of the latest graphs explaining the relationship between increased alcohol consumption and male life expectancy as an indirect indicator of premature mortality was plotted by a well-known specialist in this field, Doctor of Medical Sciences Alexander Nemtsov.
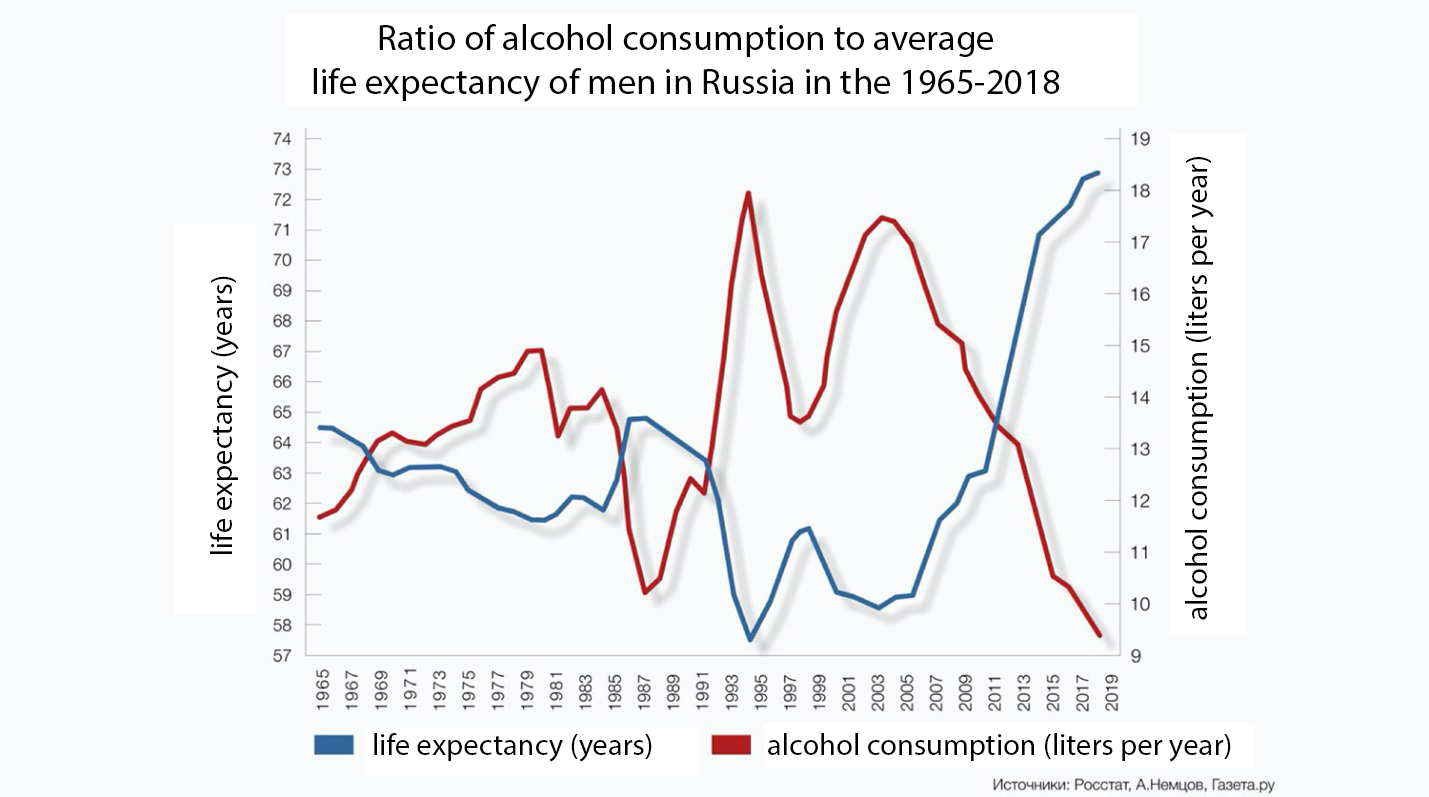
Fig. 6. The ratio between the alcohol consumption and average male life expectancy in Russia in the 1960s–2010s
Source: Gazeta.Ru. URL: https://www.gazeta.ru/tags/person/aleksandr_nemtsov.shtml. Accessed April 25, 2020. Also at https://www.yaplakal.com/forum3/st/0/topic2279218.html.
First, the graph clearly confirms the findings of Khalturina and Korotayev and of their predecessors in the 1970–1980s. Second, it shows that a new rise lasted from 1999 to 2006, and then it turned into a decline continuing to the present.
A comparison of this graph with the graphical indicators of harvests and mortality in the 1990s and 2010s suggests that the decline in the average life expectancy for males (and, correspondingly, the increase in their mortality) coincided with crop failures in the mid-1990s and 2003. But the elongation of the lower values of life expectancy indicates a weak dependence of mortality on the circumstances of particular years. Therefore, the above-mentioned years with excessive mortality (1993–1995, 2000–2006) were primarily related to increased alcohol consumption rather than natural rhythms and, accordingly, crop failures in certain years.
But the most interesting is the segment of the modern graph (Fig. 5) which begins in 2003 and passes particularly through 2010. As we have already noted, in that hot and lean year, there was a small rise in mortality in all provinces of the Central Black Earth Region as well as in the neighboring regions. But this did not affect the increasing alcohol consumption and the indicator of male life expectancy, which continued to grow steadily.
In other words, the influence that such a modern factor as the level of alcohol consumption has on the health of Russia's population proves to be greater than the ‘echo’ of natural and space cycles. At the same time, the facts of a decrease in the influence of alcohol on the demographic processes of the 2010s require explanation.
In particular, we would like to call attention to opinion polls conducted by Tambov sociologists in 2018–2019 in the urban-type settlement of Sosnovka, the villages of Podlesnoe, Tugolukovo, and Iskra (Kanishchev et al. 2019).
First of all, these data show moderate alcohol consumption by the residents of the Tambov village. Yet, focus should be narrowed to some contradictions in the answers to the questions ‘Is there anyone in your family who regularly drinks alcohol?’ and ‘Do you personally drink alcoholic beverages?’ When answering the first question, 11 per cent of respondents said yes in Sosnovka, 12 per cent in Podlesnoye, 14 per cent in Tugolukovo, 35 per cent in Iskra. At the same time, when asked about their personal attitude to alcohol use, 32 per cent of respondents in Sosnovka, 26 per cent in Podlesnoye, 40 per cent in Tugolukovo, 60 per cent in Iskra admitted using alcohol. It may seem that, among those using alcohol, there are more respondents than members of their families. But this is hardly a significant contradiction. Indeed, the first question was about the regular use of alcohol; whereas the second one, about using it in general.
The vast majority of respondents in Podlesnoye – 66 per cent, in Iskra – 60 per cent, almost half of them in Sosnovka – 49.8 per cent, and more than a third in Tugolukovo – 36 per cent said that they drink alcohol less than once per month. At the same time, a few respondents indicated the daily consumption of alcohol. With such answers, there is hardly any kind of mass alcoholism having direct influence on modern demographic processes. There is even some doubt as to whether there is any point in asking such questions in sociological and demographic studies.
The question ‘At what age did you try alcohol for the first time?’ may be quite relevant for our research. The results of the surveys in all settlements under study indicate the age of minority: Tugolukovo – 17.74 years, Podlesnoye – 17.58, Sosnovka – 17.38, and Iskra – 16.43. Theoretically, it can be assumed that the habit of using alcohol in premarital age can then lead to the conception of children while being intoxicated. But the data on alcohol consumption above makes such assumptions unlikely.
This doubt is deepened when analyzing the answers to the question ‘What alcoholic drinks do you prefer?’ The respondents clearly avoided hard liquor. Beer and wine is preferred in Podlesnoye by 53 per cent of respondents, by 60 per cent in Sosnovka, by 65 per cent in Iskra, and by 75 per cent in Tugolukovo. It is unlikely that these people become alcoholics. Therefore, we once again voice doubts about any influence that moderate consumption of alcohol by a resident of modern rural settlements in the Tambov Oblast can have on demographic processes. That being said, we are talking not only about the effect on fertility but also on mortality.
Let us add an important point that is essential for determining the reliability of the results of the polls conducted. In all the studied settlements, several respondents were bold enough to indicate their consumption of homebrew, which makes their answers more credible.
It is obvious that the ‘sly’ results of opinion polls should be treated with caution. They can only provide supplementary insights based on a variety of sources and the knowledge of historical trends.
This year, a socio-natural approach to the study of the factors of demographic processes will probably be particularly necessary. Even now, nine months into the year, it is evident that the year has been apparently atypical both in natural, climatic, and demographic terms. In the upcoming assessments of its results, we hope that the methods developed by historians in the interdisciplinary application of data of social-humanitarian and natural sciences and information technologies can also be useful.
FUNDING
The article was written with the financial support of the Russian Science Foundation grant on project №18-18-00187 ‘Strategies for the demographic behavior of the rural population in the south of Central Russia in the twentieth – early twenty-first centuries.’
NOTES
1 Alexander Leonidovich Chizhevsky: an outstanding scientist of the twentieth century from the Tambov region. Materials of the interregional round table dedicated to the 50th anniversary of the death of A. L. Chizhevsky. April 3, 2014 Tambov: Galina Zolotova Printing Studio, 2015. Original in Russian (Александр Леонидович Чижевский – выдающийся учёный XX в. и Тамбовщина. Материалы межрегионального круглого стола, посвящённого 50-летию со дня смерти А.Л. Чижевского. 3 апреля 2014 г. Тамбов: Студия печати Галины Золотовой).
2 See the site of the Center for Fractal Modeling of Social and Political Processes. URL: http://ineternum.ru/.
3 The rest of the graphs, due to their large number and difficulty reading them as a hard copy, are posted on the website of the Center for Fractal Modeling of Social and Political Processes. URL: http://ineternum.ru/.
REFERENCES
Dmitriev, V. K. 2019. Critical Research on Alcohol Consumption in Russia. Moscow: Yurite. Original in Russian (Дмитриев В. К. Критические исследования о потреблении алкоголя в России. М.: Юрайт).
Dyachkov, V. L. 2002. Natural and Demographic Cycles as a Factor in Russian History: the 19th – early 20th c. In Social History of the Russian Province in the Context of the Modernization of the Agrarian Society in the 18th –20th cc. Materials of the international conference (pp. 17–31). Tambov: Izd-vo Tambov State University named after G. R. Derzhavin. Original in Russian (Дьячков В. Л. Природно-демографические циклы как факторы российской истории, XIX – первая половина XX в. // Социальная история российской провинции в контексте модернизации аграрного общества в XVIII–XX вв. Материалы международной конференции. Май 2002 г. С. 17–31. Тамбов: Изд-во ТГУ им. Г. Р. Дер-жавина).
Dyachkov, V. L. 2014. Natural and Socio-Demographic Factors of the Growing Peasant Aggression in the First Third of the 20th Century (Tambov case). Istoria i sovremennost 1: 128–141. Original in Russian (Дьячков В. Л. Природно- и социально-демографические факторы роста крестьянской агрессии в первой трети ХХ в. (Тамбовский случай). История и современность. № 1. С. 128–141).
Dyachkov, V. L. 2019a. Methodology, Searching Method and Some Important Results of Studying the Socio-Natural Synergy of Russian Demographic Processes in the Twentieth Century. In Russian Province from the Perspective of Estate-Legal, Ethno-Confessional, Socio-Cultural, Medico-Social and Demographic Collisions in the 18th – 21st centuries. Collection of articles by the participants of the International Scientific Conference. Tambov, 30 August 2019 (pp. 49–73). Tambov: Print-Service. Original in Russian (Дьячков В. Л. Методология, методика поиска и некоторые важные результаты изучения социоестественного синергизма российских демографических процессов XX в. // Российская провинция сквозь призму сословно-правовых, этноконфессиональных, социокуль-турных, медико-социальных и демографических коллизий в XVIII–XXI вв. Сб. статей участников Межд. науч. конф. (Тамбов, 30 августа 2019 года). Тамбов: Принт-Сервис. С. 49–73).
Dyachkov, V. L. 2019b. From Recent Discoveries – the Great War as ‘Damage to the Human Race’ Russian Province from the Perspective of Estate-Legal, Ethno-Confessional, Socio-Cultural, Medico-Social, and Demographic Collisions. In Russian Province from the Perspective of Estate-Legal, Ethno-Confessional, Socio-Cultural, Medico-Social and Demographic Collisions in the 18th – 21st centuries. Collection of articles by the participants of the International Scientific Conference. Tambov, 30 August 2019 (pp. 110–116). Tambov: Print-Service. Original in Russian (Дьячков В. Л. Из недавних открытий – Большая война как ‘порча человеческой породы’ // Российская провинция сквозь призму сословно-правовых, этноконфессиональных, социокультурных, медико-соци-альных и демографических коллизий в XVIII – XXI вв.: Сборник статей участников Международной научной конференции. Тамбов, 30 августа 2019 года. Тамбов: Принт-Сервис. С. 110–116).
Dyachkov, V. L., Kanishchev, V. V., and Yakovlev, E. V. 2006. Natural-Historical Background of the 1905–1907 Revolution. In The First Russian Revolution: A View from the Future (pp. 19–38). Tambov: Izd-vo Tambov State University named after G. R. Derzhavin. Original in Russian (Дьячков В. Л. Естественно-исторические предпосылки революции 1905–1907 гг. // Первая российская революция: взгляд из будущего. Тамбов: Изд-во ТГУ им. Г.Р. Державина. С. 19–38).
Dyachkov, V. L., and Shcherbinin, P. P. 2019. Army and the Military Factor in the Demographic Behavior of the population of the Tambov Region in the 18th – 20th centuries: monograph. Tambov: Izd-vo Tambov State University named after G. R. Derzhavin. Original in Russian (Дьячков В. Л., Щербинин П. П. Армия и военный фактор в демографическом поведении населения Тамбовского региона в XVIII – XX вв.: монография. Тамбов: Изд-во ТГУ им. Г.Р. Державина).
Jargin, S. 2016. Alcohol Consumption in Russia and Some Aspects of Public Health. International Journal of High Risk Behaviors and Addiction (Feb 27) 5 (1): e26617.
Jargin, S. V. 2015. Some Aspects of Nonbeverage Alcohol Consumption in the Former Soviet Union. Psychiatry Journal 2015: 507391.
Kanishchev, V. V., Meshcheryakov, Yu. V., and
Yakovlev, E. V. 2009. Tambov Riot of 1830
in the Context of Cholera Crises in Russia in the Nineteenth century. Tambov:
Izd-vo Tambov State University named after
G. R. Derzhavin.
Original in Russian (Канищев В. В.,
Мещеряков Ю. В.,
Яковлев Е. В. Тамбовский бунт 1830 г. в
контексте холерных кризисов в России в XIX в.: монография.
Тамбов: Изд. дом ТГУ им. Г. Р.
Дер-жавина).
Kanishchev, V. V., and Nefedov, S. A. 2012. Determination of Excess Mortality in Russia in the Late Nineteenth Century. Informatsionnyy byulleten assotsiatsii Istoriya i kompyuter [Information bulletin of the Association History and Computer] 38: 80–81. Original in Russian (Канищев В. В., Нефедов С. А. Определение излишней смертности в России во второй половине 19 века. // Информационный бюллетень ассоциации История и компьютер 38. С. 80–81).
Kanishchev, V. V., Okatov, A. V., Sletkov, I. A., and Svetlakov, D. V. 2019. Comparative Analysis of Methods of Sociological Surveys of the Population of the Village of Preobrazhenie of Izmailovsky region Lipetsk Province, the Urban Settlement of Sosnovka and the village of Podlesnoe of the Sosnovsky District of the Tambov Province in Order to Identify the Demographic Strategies of the Rural Population. In Problems of Agrarian History. Materials of the Regional Scientific Conference in Memory of Professor V. M. Vazhinsky (pp. 83–86). Lipetsk: LGPU. Original in Russian (Канищев В. В., Окатов А. В., Слетков И. А., Светлаков Д. В. Сравнительный анализ методик социологических опросов населения с. Преображенье Измайловского Липецкой области, р.п. Сосновка и с. Подлесное Сосновского Района Тамбовской области с целью выявления демографических стратегий сельского населения // Проблемы аграрной истории. Материалы региональной научной конференции памяти профессора В.М. Важинского. Липецк: ЛГПУ. С. 83–86).
Kanishchev, V. V., and Suvorin, R. V. 2015. Natural Disasters in the Tambov Province and Cycles of A. L. Chizhevsky. In Alexander Leonidovich Chizhevsky: An Outstanding Scientist of the 20th century and the Tambov Province (pp. 61–65). Original in Russian (Канищев В. В., Суворин Р. В. Стихийные бедствия в Тамбовской губернии и циклы А. Л. Чижевского // Александр Леонидович Чижевский – выдающийся учёный XX в. и Тамбовщина. Тамбов. С. 61–65).
Khalturina, D. A., and Korotayev, A. V. 2006. Russian Cross: Factors, Mechanisms, and Ways to Overcome the Demographic Crisis in Russia. Moscow: KomKniga. Original in Russian (Халтурина Д. А., Коротаев А. В. Русский крест: Факторы, механизмы и пути преодоления демографического кризиса в России. М.: КомКнига).
Khaltourina, D., and Korotayev, A. 2015. Effects of Specific Alcohol Control Policy Measures on Alcohol-Related Mortality in Russia from 1998 to 2013. Alcohol and Alcoholism 50 (5): 588–601.
Korotayev, A. V., Bilyuga, S. E., Malkov, S. Yu., and Osipova, D. A. 2016. On Solar Activity as a Possible Factor of Socio-Political Destabilization. History and Modernity 2: 180–209. Original in Russian (Коротаев А. В., Билюга С. Э., Малков С. Ю., Осипов Д. А. О солнечной активности как возможном факторе социально-политической дестабилизации. История и современность. № 2: 180–209).
Korotayev, A., Khaltourina, D., Meshcherina, K., and Zamiatnina, E. 2018. Distilled Spirits Overconsumption as the Most Important Factor of Excessive Adult Male Mortality in Europe. Alcohol and Alcoholism 53 (6) (November): 742–752. DOI: https://doi.org/10.1093/alcalc/agy054.
Nemtsov, A. V. 2002. Alcohol-related Human Losses in Russia in the 1980s and 1990s. Addiction Nov. 97 (11): 1413–25.
Neufeld, M., Rehm, J. 2013. Alcohol Consumption and Mortality in Russia since 2000: Are There Any Changes Following the Alcohol Policy Changes Starting in 2006? Alcohol-Alcohol Mar-Apr; 48 (2): 222–30.
Penina, O. 2017. Alcohol-Related Causes of Death and Drinking Patterns in Moldova as Compared to Russia and Ukraine. European Journal of Population, Nov 21; 33 (5): 679–700.
Saburova, L., Keenan, K., Bobrova, N., Leon, D. A., and Elbourne, D. 2011. Alcohol and Fatal Life Trajectories in Russia: Understanding Narrative Accounts of Premature Male Death in the Family. BMC Public Health Junе 20; 11: 481.
Suvorin, R. V. 2015. The Impact of Natural Disasters on the Daily Life of the Agrarian Society in the First Half of the 19th Century (based on materials from the Tambov province). Author's summary of the PhD thesis. Tambov. Original in Russian (Суворин Р. В. Влияние стихийных бедствий на повседневную жизнь аграрного общества первой половины XIX в. (по материалам Тамбовской губернии): Автореф. дис. ... канд. ист. наук. Тамбов).
Yakovlev, E. V. 2003. Impact of Emergencies on the Daily Life of the Population of the Tambov Province in the late 19th – early 20th Centuries and the Activities of the Authorities and the Public to Prevent and Overcome the Consequences. Author's summary of the PhD thesis. Tambov. Original in Russian (Яковлев Е. В. Влияние чрезвычайных ситуаций на повседневную жизнь населения Тамбовской губернии второй половины XIX – начала XX вв. и деятельность властей и общественности по их предотвращению и преодолению последствий: Автореф. дис. ... канд. ист. наук. Тамбов).