Mаcroeconomic Evolution: The Multipolarity of the Process and Quantitative Estimation Models

Journal: Social Evolution & History. Volume 14, Number 2 / September 2015
ABSTRACT
The development of global economy at the turn of the centuries was characterized by the emergence of two new sustained points of growth (China and India), weakening of economic potential of developed countries (G-7), shift of new wave of potential growth to the countries with considerable domestic markets (Russia, Brazil, SAR, Indonesia, Iran, Turkey, Nigeria, Argentine, Vietnam, and Thailand). The economic crisis which started in 2007 revealed that growth potential of G-7 countries has reached its limit, while structural disparity of their economics lowers the competiveness of their goods and services at international markets. In that context countries that may become a ‘new wave’ of economic growth are of practical interest. Assuming that the stability of global development can be provided only at the expense of multipolar growth points, we proposed a set of mathematical models, taking into account key indicators, such as population number, technological growth rates and GDP volume. Calculations, based on these models have been performed. It was shown, that without any regional wars the countries of ‘new wave’ and BRICS are capable of providing the sustainable development of world economy in the first half of the twenty-first century.
INTRODUCTION
Nowadays, even though the imperatives of current development in different countries have national peculiarities, still they are largely subject to globalization processes. The rapid development of IT has changed the character of economic dynamics; the contribution of information resources and networks is comparable to that of other resources such as natural and human ones. It is largely the reason for the attempts of many countries and groups of countries to keep their leading positions on the world economic map. However, this map is getting increasingly multipolar. The USA also admits this reality. The last two reports of the US National Security Council (Rabstone and Evans 2008; Garrett and Pavel 2012) and the report to the US Congress (Ahearn 2011) pointed out that there will be no leading country and its role will pass to networks and coalitions; besides, against the background of the decreasing importance of the EU, Japan, and Russia, the share and importance of such countries as China, India, Brazil, Nigeria, Indonesia, SAR, Columbia, Turkey, and Iran will grow. It should be noted, that the USA itself as well as other countries – members of the G7 – are gradually losing their leading positions. In this respect, the creation of G-20 group which accounts for more than two-thirds of the world population, 90 per cent of world GDP and 80 per cent of world trade is a response to the challenges of the time. The inability of G-7 countries to respond to new challenges was revealed during the recent economic crisis, when government debt served as a good indicator of the situation in the countries: according to the estimates of the IMF experts, this indicator will grow from 70 per cent of GDP in 2007 to 110 per cent of GDP in 2015, while the fast-growing economies have this indicator at the value not exceeding 35–37 per cent of GDP (Cottareli and Schaechter 2010). The scholars, studying the crisis, point out the limited capabilities of the G-7 countries to cope with global economic challenges independently and emphasize the need for the formation of new forums, like G-20, which de-facto designate a transition to a multipolar world (Birdsall 2012). Within the framework of contemporary economic development, the world economic map is a natural result of all processes that have taken place during the last one and a half centuries. According to some experts, globalization is the result of labor migration and capital mobility (Solimano and Watts 2005); while others consider it to be the result of technological advance and world trade growth (Maddison 2005).
An important factor determining the multipolar character of modern world is the demographic processes and their non-uniform behavior in different countries and regions of the world. Some researchers, basing on the statistics of 43 developing countries, point out a linear dependence between the per capita GDP growth and population growth (Minh 2012). An increasing number of scholars consider population aging and population age structure as a factor with significant impact on the type and rates of economic development (Nagarajan, Teixeira, and Silva 2013). Bloom with co-authors presents an extended analysis of changes in age distribution in the Asian countries during the period from 1960 to 2005 (Bloom, Canning, and Finlay 2010). While for the fast developing economies the changing age structure can be considered as an advantage, for the European countries, and on a wider scale for OECD member countries, it should be considered as a serious economic challenge (Feldstein 2006; Bloom, Canning, Fink, and Finlay 2007; Bloom, Canning, and Fink 2011). Some researchers specifically point out the threat of an absolute and relative depopulation of Europe – while in 1900, 20 per cent of world population lived in Europe, it was only 12 per cent in 2005 and in highly plausible case the share of the continent in world population will amount 7 per cent in 2050 and only 4 per cent in 2100 (Sommer 2006).
A critical contributor to the economic evolution processes is the technological development which considerably increases the productivity and efficiency and together with labor and capital becomes one of the key factors of economic growth. In the twentieth century, the economic evolution proceeded rather unevenly (Debackere and Verbeek 2002; Färe et al. 1995; Giorno, Richardson, and Suyker 1995; Mokyr 2005; Boskin and Lau 2000; Crafts 2003). The technological advance not only considerably changed individuals' lifestyle, but also became a factor of social evolution, in particular, contributing to the formation of human capital assets (a new role of education) and to the emergence of knowledge-based economy (Koh and Leung 2003; Antoci, Sabatini, and Sodini 2011; Lin 2003).
The joint impact of demographic factor and technological advance, as clear from statistic data, predetermined the type and the rate of economic evolution of macro-social systems. As a measure of such evolutionary processes a commonly used indicator like gross domestic product (GDP) can be applied. On the assumption of multipolarity of macroeconomic evolutionary processes, countries are divided into different groups (G-7, BRICS and ‘New locomotives’ with the latter including Indonesia, Iran, Turkey, Nigeria, Argentina, Vietnam, and Thailand) and in Fig. 1 we present our estimation of the dynamics of different countries' share in world GDP in the period from 1980 to 2013. The graphs in the figure give a clear visualization of the changing role of the countries under study in the world economic development. Firstly, there is an obvious consistent trend of decreasing share of the developed countries (G-7 members) in world GDP (from 50 per cent to 38.5 per cent) and a rapidly growing share of BRICS countries (from 12 per cent to 28 per cent) against the background of growing share (from 4.5 per cent to 6.6 per cent) in the world GDP of the countries which in the future may become new economic drivers. In this context, the question arises as to whether this trend will continue for more two or three decades and what the world economic map will look like in 2050. The point at issue will be different scenarios of economic development of the three groups of countries in order to determine the countries whose economic growth will produce a maximum impact on macroeconomic evolution.
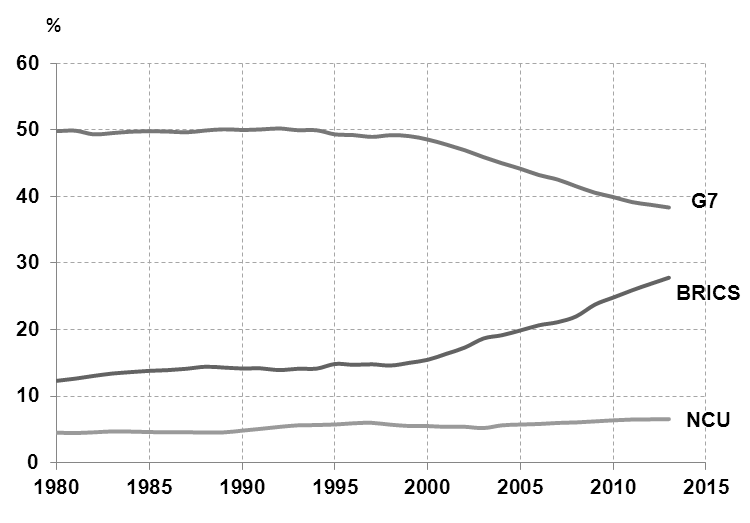
Fig. 1. The dynamics of three groups of countries in world GDP (1980–2013)
WHO ARE THEY – THE FUTURE TIGER ECONOMIES?
In 2001, Jim O'Neill coined a new acronym – BRIC (Brazil, Russia, India, and China) to denote countries that, to his opinion, could become new driving forces of the global economy. A bit later SAR joined the group and the abbreviation took its final shape – BRICS. The development of global economy in the first decade of the twenty-first century revealed that these countries largely justified expectations. The consequences of the world economic crisis, which started in 2007, could have been catastrophic, were it not for the economies of these countries, especially of India and China, which even under such conditions had the annually growth rates at 5–8 per cent. Far from all scholars agree on the further developmental prospects for these countries and their somewhat slowing economic growth rates are the reason of the started discussions on the issue of what countries, apart from BRICS, could become new world economic growth engines in the first half of the twenty-first century.
O'Neill introduced the concept of ‘Next Eleven’ (O'Neill 2011) which includes emerging market countries, namely, Bangladesh, Egypt, Indonesia, Iran, Mexico, Nigeria, Pakistan, Philippines, South Korea, Turkey and Vietnam. In addition, he specially pointed out the countries that could take on the burden of leadership – Mexico, Indonesia, Nigeria, and Turkey, which got the acronym MINT. American political analyst Jack Goldstone proposed a slightly different concept of countries – locomotives, essentially dismissing the concept of BRICS countries (Goldstone 2011). According to him, the role of new locomotives should be attributed to Turkey, India, Mexico, Brazil, and Indonesia – TIMBI. The set of arguments, used by O'Neill and Goldstone is rather extensive and includes arguments of geopolitical, social and demographic character. To our opinion, with respect to its economic and technological potential South Korea is closer to G-7 group than other countries, including BRICS members. Egypt and Pakistan, as well as Bangladesh while having a substantial demographic potential, are subject to high political risks, which significantly decrease the opportunities of economic and technological development. Mexico, as NAFTA member, is dependent on its main economic partners – the USA and Canada, and as a result, has less freedom to work out its own economic strategy. At the same time, one should point that close trade relations within the framework of the agreement can facilitate a more active borrowing of high technologies. Philippines have considerable human resources (97 mln. people) but the low per capita GDP and serious poverty issues (25 per cent of the population lives on less than US$2 a day) put serious restrictions on growth potential.
We propose a slightly different list of countries, which together with BRICS countries may act as economic locomotives (see Table 1).
Table 1
Economic and demographic indicators of countries – ‘New locomotives’ in 2010
| Country | Population, mln people | GDP, $ bln | Per capita GDP, $ thou./ pers. | Annual GDP growth, 1990–2010, % |
| Argentina | 41 | 625 | 15.1 | 4.01 |
| Vietnam | 90 | 343 | 3.8 | 7.39 |
| Indonesia | 233 | 1,165 | 5.0 | 4.65 |
| Iran | 67 | 1,020 | 15.2 | 4.73 |
| Niger | 153 | 289 | 1.9 | 4.47 |
| Thailand | 66 | 667 | 10.1 | 4.44 |
| Turkey | 78 | 931 | 12.0 | 3.72 |
| Total | 729 | 5,040 | 6.9 | 4.50 |
Let us note first, that Indonesia, Nigeria, Iran, Turkey, and Vietnam are included in the N-11 group, proposed by O'Neill. Unlike Philippines, Thailand has a larger per capita GDP (more than quadruple) and relatively high long-term growth rate (more than 4.4 per cent over the last 20 years). Argentine has larger per capita GDP than Mexico, although it is three times smaller in population and two times smaller by GDP. In spite of the fact that an average GDP growth rate in Argentine amounted to 2.4 per cent over the period from 1960 to 2002, as compared to 4.5 per cent in Mexico (Solimano and Soto 2005), our calculations reveal that over the last two decades the indicator exceeded 4.0 per cent, which can be considered as a sustained and positive economic trend. The estimates of the prospects of economic growth for the three groups of countries are based on the model simulation results.
MODELS OF MACROECONOMIC EVOLUTION
The complex of models consists of three blocks. The first block describes the demographic dynamics basing on Kapitza (1996, 2010) equation applied to the world in general and for separate groups of countries – G-7, BRICS and ‘New locomotives’ (New Countries Up-growth – NCU further on). The second block describes the technological dynamics for the same groups of countries. In the processes, the rates of economic growth are estimated on the assumption that Kuznets-Kremer equation is used as the basis for the evaluation of technological development rates (Kremer 1993; Korotayev, Malkov and Khalturina 2007), supplemented by iterations obtained from the following general considerations:
а) technological development in the G-7 countries proceeds only through their own development and technologies;
b) technological development in BRICS countries occurs due to their own R&D as well as developments and technologies borrowed from the G-7 countries;
c) technological development in NCU occurs by means of developments and technologies borrowed from G-7 and BRICS.
The third block estimates the GDP dynamics based on calculations in the demographic block and block of technological development.
Our approach is consistent with fundamental principles stated earlier (Grossman and Helpman 1991, 1994) regarding new possibilities in trade (export, import), high technologies and high-tech products, as well as R&D results with the start of globalization processes in economy. Thus, we have the following systems of models:
Demographic block
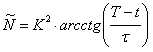 ,
,where: Ñ – population forecast; t – time; K2, T, τ – parameters of the demographic models.
Technological block
Where q(1) – the chain growth rate of technical progress for the first approximation;
q(2) – the chain growth rate of technical progress for the second approximation (considering the development of own technologies);
q(3) – the chain growth rate of technical progress for the third approximation (considering the borrowed technologies);
ĺ – the share of researchers in the number of employed;
Ā() – basic rates of growth of technical progress for the corresponding approximation;
k(1), a, ĺmax, ĺ0, k(3), ε(3), TF(3) – parameters of technological models.
Dynamics of GDP block
where Ỹ – the forecast of GDP volume;
The results of calculations of the demographic block are presented in Fig. 2 and Table 2, while the results for the other two blocks of the model are presented in Table 3 and in Figs 3–6.
Table 2
The forecast of the population for the period until 2050 in millions
| Fact | Forecast | ||||
| 2010 | 2020 | 2030 | 2040 | 2050 | |
| World | 6,839 | 7,592 | 8,166 | 8,620 | 8,977 |
| ‘The Group of Seven’ (G7) | 737 | 779 | 812 | 842 | 868 |
| BRICS | 2,901 | 3,287 | 3,562 | 3,787 | 3,968 |
| ‘New locomotives’ (NCU) | 729 | 843 | 949 | 1,038 | 1,110 |
| BRICS + ‘New locomotives’ (NCU) | 3,630 | 4,130 | 4,511 | 4,825 | 5,078 |
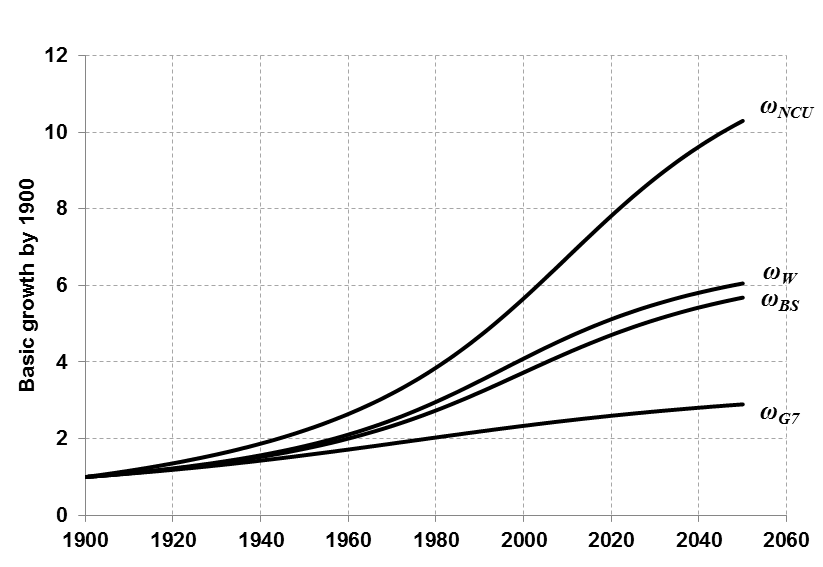
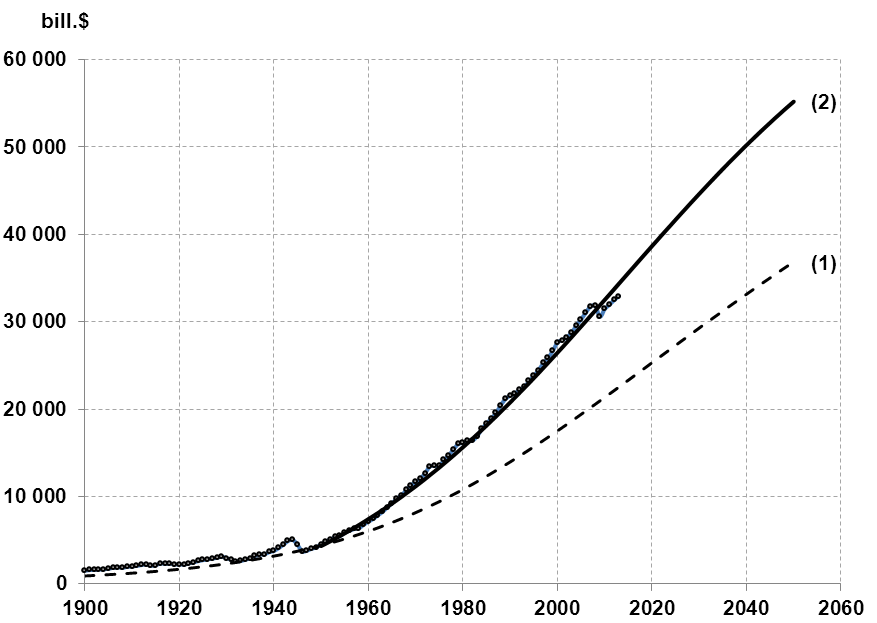
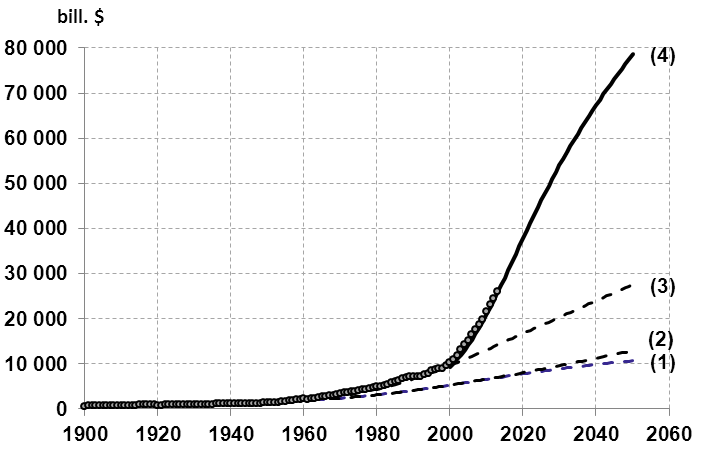
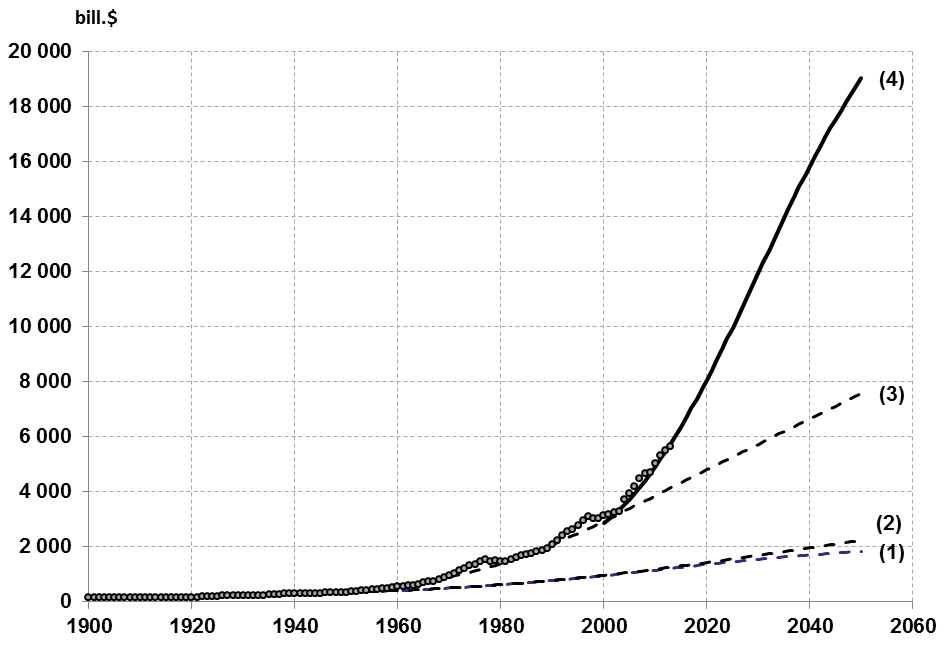
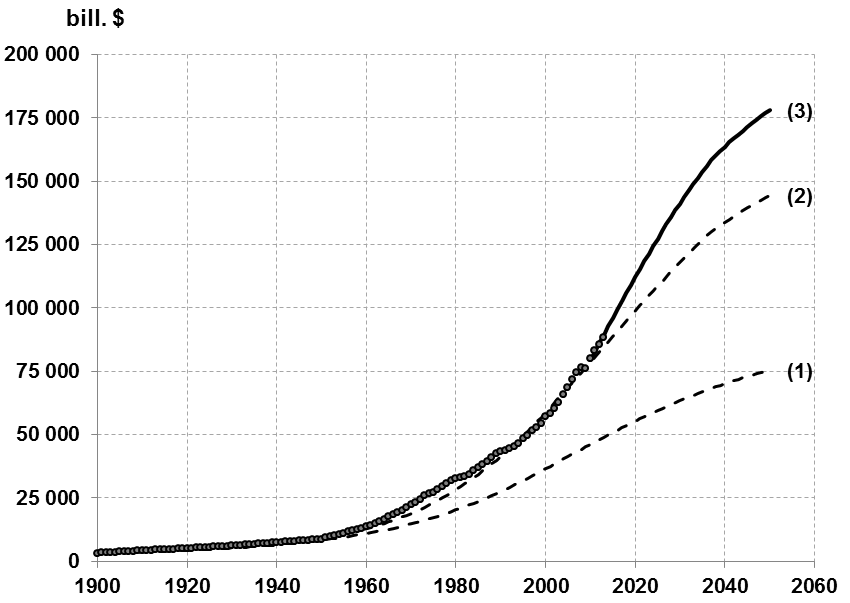
Fig. 6. World GDP forecast (W)
Table 3
GDP forecast for the period until 2050, billions $
| Fact | Forecast | ||||
| 2010 | 2020 | 2030 | 2040 | 2050 | |
| World | 79,897 | 110,617 | 141,097 | 163,595 | 178,075 |
| ‘Group of Seven’ (G7) | 31,472 | 35,443 | 37,785 | 50,215 | 55,200 |
| BRICS | 21,533 | 38,455 | 54,020 | 67,321 | 78,748 |
| ‘New locomotives’ (NCU) | 5,040 | 8,036 | 11,937 | 15,822 | 19,007 |
| BRICS + ‘New locomotives’(NCU) | 26,573 | 46,489 | 65,957 | 83,143 | 97,725 |
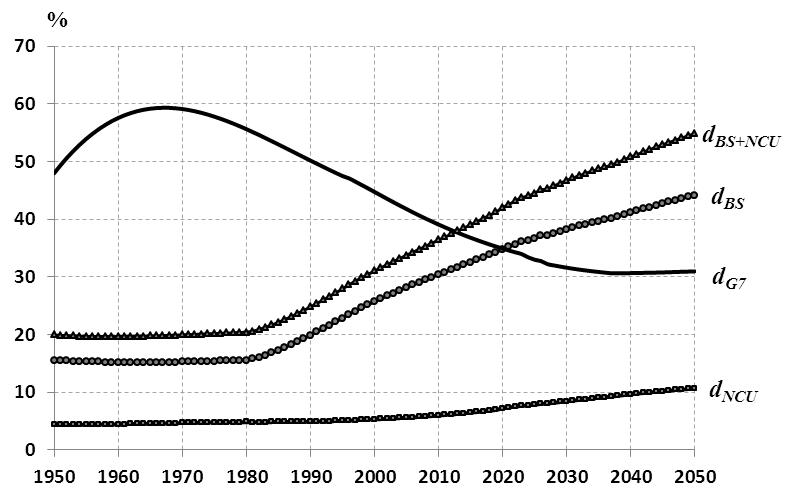
Figs 3–6 and Table 3 expose that perspectives of the economic dynamic for the countries under discussion differ substantially. The main growth is forecasted in BRICS and NCU. By 2020, the total GDP of BRICS will outbid that of the G7, though in 2010 the combined GDP of the BRICS countries and NCU countries used to be much less than aggregate GDP of G7 member states. In spite of decreasing average annual growth GDP rates after 2020 in BRICS and NCU countries, it should be expected that their total GDP by 2050 will exceed the G7 total GDP by two times. One of the main factors of that developmental dynamics will be the population growth in these countries. In 2010, the population growth in NCU and G7 countries was almost at the same level (729 and 737 million people respectively); the population of BRICS was estimated at 2,901 million people. According to our calculations, in 2020 the total population of BRICS and NCU countries will exceed the total population of G7 countries by more than five times, and in 2050 – almost by six times. Fig. 7 shows the retrospective and future dynamic countries' share in world GDP from 1950 to 2050. In 2003 and 2006, Goldman Sachs and PwC (Wilson and Purushothaman 2003; Hawksworth 2006) suggested their vision of the perspectives of the BRICS and world economic development for the period until 2050. In spite of the fact that these calculations are separated by ten years, the estimated values of GDP volumes, obtained by means of the proposed models, do not reveal significant differences to forecasts made by Goldman Sachs. As to the forecast of the PwC Company, the direct comparison is hindered, because their estimation was carried out with allowance for the purchasing power parity of national currencies in respect to the US dollar.
INSTEAD OF A CONCLUSION OR ON THE POSSIBILITY OF MODEL DEVELOPMENT SCENARIO
The demographic factor, as it has been pointed out above, is going to be the main source of the development. What can be said about technical factor? One needs to take into account processes of qualitative order, which take place in BRICS and NCU countries. Nowadays China, the biggest country of the group, starts shifting to the average per capita income group. In 10–15 years' time, the same process will start in India. Brazil and Russia are countries with the average per capita income already. The shift to the average per capita income, as a rule, leads to that fact that industries, which used to support a rapid growth at the first stages of modernization, become noncompetitive as a result of the growing labor expenses. That is why industries requiring considerable labour costs become less competitive, what stipulates their transfer to the countries with a lower wage level. Such industries are replaced with brand new ones, requiring large investments, more qualified workers and more advanced technologies. It is important to point that the model of borrowing knowledge and technologies at that period transforms into developing own technologies and their export, what is one of the regular stages on the way to the status of a developed country. Thus, when China and India come into the average per capita income countries group, they will leave enough economic space for the countries with low income and technologies. The BRICS countries are interested that this place would be occupied by the co-untries ready for cooperation and partnership. The most suitable ones are the NCU countries: some of them could adopt the low-income production, others – innovative technologies and products, accompanied by direct investments. This economic cooperation will allow BRICS to perform structural reforms on a new technological level and more effectively while the NCU countries will be able to achieve high and stable growth rates.
It is expected that the high growth rates of the NCU countries will provoke a significant additional demand for innovative technologies and products, developed in the BRICS countries and thus, will support structural transformations within BRICS itself, preventing a rapid decline in economic activity, what is very important for the whole developing world. With such an economic cooperation, BRICS and NCU could create a zone of open and fair trade, and as a result – a coalition of majority in G20 and thus, to promote a successful completion of the Doha Round of WTO negotiations with the fullest regard to the interest of developing countries. This would be a serious step towards maintaining an open and fair global trade system.
The stable economic development of BRICS countries can result in a close cooperation within the G20 and support a more effective and mutual collaboration aimed at creating a considerable global demand for further sustainable growth of world economy. And this will promote an unhindered spreading of free trade concepts on a global scale which can bring about positive shifts in the developing and developed countries. Alongside with the emerging innovations, these structural shifts can lead to the long-term buoyant wave of the global economic upswing in the first half of the twenty-first century.
A close economic association with BRICS could provide favorable geopolitical environment for the development of NCU countries due to the following reasons:
– the latter will be able to actualize models of rapid growth, as supported with the investments and innovations from BRICS, which nowadays includes countries with large foreign currency reserves and powerful sovereign funds (China and Russia);
– in cooperation with BRICS, NCU countries can achieve the open and fair global trade system which will become the main driving force of the long-term rapid growth;
– to obtain security guarantees from the three great nuclear powers (Russia, China, and India), – BRICS members, what will allow the former,to limit military expenses and defense.
Thus, the cooperation of BRICS and NCU countries will promote stable high growth rates of developing economies in the twenty-first century and accelerate the developed and developing world convergence processes.
Ahearn, R. J. 2011. Rising Economic Powers and the Global Economy: Trends and Issues for the Congress. CRS Report for Congress. Congressional Research Service.
Antoci, A., Sabatini, F., and Sodini, M. 2011. Economic Growth, Technological Progress, and Social Capital: The Inverted U Hypothesis. Research Paper Series No 07. Brussels: Economics and Econometrics Research Institute.
Birdsall, N. 2012. The Global Financial Crisis: The Beginning of the End of the Development Agenda? CGD Policy Paper 003. Washington, D.C.: Center for Global Development.
Bloom, D. E., Canning, D., and Fink, G. 2011. Implication of Population Aging for Economic Growth. NBER Working Paper 16705. Cambridge, MA: National Bureau of Economic Research (NBER).
Bloom, D. E., Canning, D., Fink, G., and Finlay, J. E. 2007. Does Age Structure Forecast Economic Growth. NBER Working Paper 13221. Cambridge, MA: National Bureau of Economic Research (NBER).
Bloom, D. E., Canning, D., and Finlay, J. E. 2010. Population Aging and Economic Growth in Asia. In Ito, T., and Rose, A. (eds.), The Economic Consequences of Demographic Change in East Asia (pp. 61–89). Chicago: University of Chicago Press.
Boskin, M., and Lau, L. 2000. Generalized Solow-Neutral Technical Progress and Postwar Economic Growth. NBER Working Paper 8023. Cambridge, MA: National Bureau of Economic Research (NBER).
Cottareli, C., and Schaechter, A. 2010. Long-Term Trends in Public Finances in the G-7 Economics. IMF Staff Position Note, SPN/10/13. Washington: International Monetary Fund.
Crafts, N. F. R. 2003. Quantifying the Contribution of Technological Change to Economic Growth in Different Eras: A Review of the Evidence. London: School of Economics.
Debackere, K., and Verbeek, A. et al. 2002. Measuring Progress and Evolution in Science and Technology – II: The Multiple Uses of Techno-metric Indicators. International Journal of Management Reviews 4(3): 213–231.
Färe, R., Grosskopf, S., Norris, M., and Zhang, Z. 1995. Productivity Growth, Technical Progress, and Efficiency Change in Industrialized Countries. The American Economic Review 84(1): 66–83.
Feldstein, M. S. 2006. The Effect of the Ageing European Population on Economic Growth and Budgets: Implications for Immigration and Other Policies. NBER Working Paper 12736. Cambridge, MA: National Bureau of Economic Research (NBER).
Garrett, B., and Pavel, B. 2012. Global Trends 2030: Alternative World. Washington, D.C.: National Intelligence Council 2012-001.
Goldstone, J. A. 2011. Forget the BRICs. The Real Economies that will Shake up the World over the Next Few Decades Need a New Acronym. Foreign Policy. December 2.
Grossman, G. M., and Helpman E. 1991. Innovation and Growth in the Global Economy. Cambridge, MA: MIT Press.
Grossman, G. M., and Helpman, E. 1994. Endogenous Innovation in the Theory of Growth. The Journal of Economic Perspectives 8(1): 23–44.
Hawksworth, J. 2006. The World in 2050. How Big will the Major Emerging Market Economies Get and How Can the OECD Compete? Pricewaterhouse Coopers LLP.
Kapitza, S. P. 1996. The Phenomenological Theory of World Population Growth. Uspehi phizicheskih nauk 166(1): 63–80. In Russian (Капи-ца С. П. Феноменологическая теория роста населения Земли. Успехи физических наук 166: 63–80).
Kapitza, S. P. 2010. On the Theory of Global Population Growth. Uspehi phizicheskih nauk 180(12): 1337–1346. In Russian (Капица С. П. К теории роста населения Земли. Успехи физических наук 180 (12): 1337–1346).
Koh, W. T. H., and Leung, H.-M. 2003. Education, Technological Progress and Economic Growth. Research Collection School of Economics. URL: http://ink.library.smu.edu.sg/soe_research/1184.
Korotayev, A. V., Malkov, A. S., and Khalturina, D. A. 2007. Laws of History: Mathematical Modeling of Development World System. Demography, Economy, Culture (pp. 182–188). M.: KomKniga/URSS. In Russian (Коротаев, А. В., Малков А. С., Халтурина, Д. А. Законы истории: Математическое моделирование развития Мир-Системы. Демография, экономика, культура (с. 182–188). M.: KomKniga/URSS).
Kremer, M. 1993. Population Growth and Technological Change: One Million B.C. to 1990. The Quarterly Journal of Economics 108(3): 684–716.
Lin, T.-C. 2003. Education, Technical Progress, and Economic Growth: The Case of Taiwan. Economics of Education Review 22: 213–220.
Maddison, A. 2005. Growth and Interaction in the World Economy. The Roots of Modernity. Washington, D.C. The AEI Press.
Minh, Q. D. 2012. Population and Economic Growth in Developing Countries. International Journal of Academic Research in Business and Social Sciences 2(1): 6–17.
Mokyr, J. 2005. Long-term Economic growth and the History of Technology. Amsterdam: Elsevier.
Nagarajan, R., and Teixeira, A. A. C., and Silva, S. 2013. The Impact of Population Ageing on Economic Growth: An In-depth Bibliometric Analysis. FEP Working Paper No 505. Porto.
O'Neill, J. 2011. The Growth Map Economic Opportunity in the BRICs and Beyond. London: Portfolio/Penguin.
Rabstone, W., and Evans, N. 2008. Global Trends 2025: A Transformed World. Washington, D.C.: National Intelligence Council.
Solimano, A., and Soto, R. 2005. Economic Growth in Latin America in the late 20th Century: Evidence and Interpretation. Santiago, Chile: United Nations.
Solimano, A., and Watts, N. 2005. International Migration, Capital Flows and the Global Economy: A Long Run View. Santiago: UN.
Sommer, T. 2006. Is the 21st Century Going to Be the Asian Century. ASIEN 100: 70–78.
Wilson, D., and Purushothaman, R. 2003. Dreaming with BRICs: The Path to 2050. Global Economics Paper No: 99. The Goldman Sachs Group.