Scenarios of the World Technological Development during the Global Energy Transition: An Optimal Average Assessment

Journal: Journal of Globalization Studies. Volume 17, Number 1 / May 2026
DOI: https://doi.org/10.30884/jogs/2026.01.02
Igbal Adil oglu Guliyev
The School of Financial Economics Moscow State Institute of International Relations (University) Ministry of Foreign Affairs of the Russian Federation, Moscow, Russia
This article presents an optimal evaluation of global energy transition scenarios, categorizing them as positive, neutral, or negative. The research aims to contribute to a more comprehensive and realistic understanding of the potentially achievable key metrics of global energy transition. By addressing biases in scenario development and drawing on diverse assessments, the study offers insights into potential trajectories for decarbonization efforts.
Keywords: global energy transition, national strategy, technological development, technological readiness, scenarios.
Introduction
The global energy transition has become a major trend in the larger global political and economic landscape, with the landmark COP 2023 decisions resulting in first-time agreement on moving away from fossil fuels.1 In light of this, it is important to assess how realistic are the commitments made by countries on their decarbonization over time and analyze the possible scenarios for the global energy transition. This paper proposes a methodology to identify positive, neutral, and negative scenarios of global energy transition based on an average between the scenario components from different actors (Guliev 2024a).
The general supposition of the article is based on the fact that modern energy sphere as well as the modern economy faces severe challenges that to a great extent mean the need to adapt to the general goals of global sustainable development and a net-zero production. The major challenges include the necessity to cut down greenhouse gas emissions with the presumption of competitiveness of the industries, the need to introduce energy-saving technologies cutting down global demand for energy, and the decline of growth of Asian economies, building up the pressure on energy sphere. The other challenges (numerous and broadly discussed and researched) can be summed up as the climate change challenge and the industrialization challenge led to the necessity for new energy sources, i.e. renewable energy sources, which in turn contribute to the pressure on energy industry, traditionally relying on conventional energy. These challenges, as well as their implications have been in depth analyzed in the previous works as part of the general project research under the Russian Science Foundation Grant No. 22-78-00214 ‘Countries' strategic adaptation to the global energy transition: technological aspects’ (Guliev 2024b, 2024c).
These global processes are hard to predict, just as the influence of these challenges on the energy industry. As a result, the viable way of forecasting long-term development of energy industry in current situation is to conduct research of the forecasts of multiple expert communities and experts and to combine them in such a way, that the average between the forecasted data will be near to equal to the consensus scenario (as it will in some way resemble Delphi method). This article addresses this task and tests the hypothesis that this approach can lead to the accuracy acceptable in terms of long-term forecasting.
Literature Review
Every scenario, end especially any public paper, is susceptible to bias due to the political environment influence, possible orientation towards target strategic metrics, as well as certain specific interests of the producing actor. To address these biases, this paper proposes a methodology to identify scenario frames (key presumptions and key metrics) for positive, neutral, and negative scenarios based on a median between the respective scenario components from different actors. Notably, similar work was conducted in the UN Long-term low-emission development strategies report 2023 (UN 2023), but it only covered national strategies and did not focus on scenario-based variations. Similar approach was taken by IPCC in their special report ‘Emissions scenarios’ 2000. The very research is based on a balanced number of sources, by their origin and affiliation (see Methodology).
Methodology
The methodology aims to address the biases that could be innate to every scenario. The identified scenario frames (key presumptions and key metrics) for positive, neutral, and negative scenarios include such key metrics as: (1) Total energy consumption; (2) Non-fossil fuels (including renewable energy sources – RES, hydrogen and nuclear energy) share in primary energy mix; and (3) Level of global temperature.
The methodology is based on the following idea: the energy trilemma optimum is data generator for the approximation, while every approximation (every scenario) is an estimation of this ideal optimum. As a result, the mathematical expectation, calculated in the article through the estimation of the key components, contributing to the variation of the results from the optimum allow to approximate the 99 % possibility field and potentially make an approach to the data generation assessment – as a result the conclusion of the most relevant/optimal scenario of energy transition can be proposed and interconnected to the real data-based scenarios.
The methodology of the research is constructed in the way to avoid biases due to potential outweigh of certain political or national groups in the analyzed sources (instead, a balanced list of sources from developed and developing countries is formed). Another criterion for sources choice was the fact that a prognosis is multiple-scenario structured, provides distinct criteria for scenario distinction, as well as comprehensively covers the majority of the key target metrics compared in the present research.
That is the reason why, for example, a range of authoritative but very specialized prognoses (e.g., IPCC) were not included, or those prognoses that structure predictions not by scenario methodology (e.g., WMO, NASA). Neither are covered revered sources where the prognoses have fundamental methodological differences, which make the data incomparable (e.g., OPEC World Energy Outlook has first published a prognosis with the same modeling timeline of 2050 only in 2024, and this prognosis focuses on fundamentally different key metrics, such as energy demand, and does not estimate the majority of those used in the present research [OPEC N.d.]).
Average positive, neutral and negative scenarios are developed based on the identified metrics. To avoid any group of actors dominating the median results, equal number of strategies of the same nature was considered (three sources from each category – government, science, corporate sector – within both the Western and BRICS sources). The average time frames utilized in this methodology are the 2050 and 2100 horizons, with prognostic trends extended mathematically to ensure consistency with the chosen time frames.
Results
Within the analysis the author used the following sources types:
A – National / supra-national / international organization's scenario projection;
B – Scientific scenario projection;
C – Corporate scenario projection.
Table 1
Key target metrics by energy transition scenario
|
Source type |
Source |
Time frame |
Methodology |
Positive |
Neutral |
Negative |
|
A |
World Energy Council Energy Scenarios 2019 |
2020–2060 |
Interview method-based (developed on insights from energy-leaders through a series of interviews and workshops) |
‘Unfinished Symphony’ (coordinated policy-led world) |
‘Modern Jazz’ (market-led world) |
‘Hard Rock’ (fragmented world) |
|
Key points & indicator estimates |
By 2050: Non-fossil fuels = 26.3 %; GDP = 198 trln USD. Global temperature increase = 2.1 °C by 2040. CO2 emissions = 17 Gt in 2050. Total energy consumption = 15.3 Gtoe by 2050 |
By 2050: Non-fossil fuels = |
By 2050: Non-fossil fuels = |
|||
|
A |
IRENA World Energy Transitions Outlook 2023 |
2023–2050 |
Macroeconomic modeling |
‘1.5 °C Scenario’ (prognoses of energy if the global temperature rise remains by 1.5 °C threshold by 2050) |
– |
‘Planned energy scenario’ (world energy development according to current states' plans and policies) |
|
Key points and indicator estimates |
By 2050: Non-fossil fuels = crease = 1.5 °C. CO2 emissions = –0.5 Gt (with carbon capture and removal). Total energy consumption = 4.4 Gtoe |
– |
By 2050: Non-fossil fuels = 19 %; CO2 emissions = 12.9
Gt (with carbon capture and removal). Total energy consumption = |
|||
|
A |
IEA World Energy outlook 2024 |
2024–2100 |
IEA's Global Energy and Climate Model, combining a large-scale energy market simulation model and the Energy Technology Perspectives model |
‘Net Zero Emissions by 2050’ |
‘Announced Pledges Scenario’ (shows the potential outcomes of full realization of the Nationally Determined Contributions and other pledges) |
‘Stated policies scenario’ (current policies with count of the expected implementation gap) |
|
Key points and indicator estimates |
By 2050: CO2 emissions = |
By 2050: CO2 emissions = increase = 2.1 °C |
By 2050: CO2 emissions = By 2100: Global temperature increase = 2.4 °C |
|||
|
A |
WETO-H2 research (on request from European Commission) |
2010–2050 |
Projections to 2050 have been
made with a world energy sector simulation model – the POLES model – that
describes the development of the national and regional energy systems, |
‘Hydrogen case’ |
‘Carbon Constraint case’ |
‘Reference projection’ (continuation of existing economic and technological trends is assumed) |
|
Key points & indicator estimates |
By 2050: total energy consumption = |
By 2050: CO2 concentration in the
atmosphe- |
By 2050: total energy
consumption is larger than in 2007 by 2.2 CO2 concentration in
the 900–1000 ppmv |
|||
|
A |
India Energy Security Scenarios (IESS) 2047 (IESS N.d.) |
2022–2047 |
Economic modeling |
– |
Only one scenario is modeled, assumed as neutral |
- |
|
Key points & indicator estimates |
– |
Energy demand = 22 Gtoe by 2047; Non-fossil fuels share is 46.6 %
in 2047 (including 5.5 % nuclear and 4 % hydro); energy related GHG emissions
|
- |
|||
|
B |
R. Way, |
2020– |
Economic modeling (forecast of technology costs and energy system modeling, based on modeling of primary and secondary energy production, consumption and storage) |
‘Fast transition’ |
‘Slow transition’ and ‘Slow nuclear transition’ |
‘No transition’ |
|
|
Key points & indicator estimates |
Non-fossil fuels replace fossil fuels by 2050 (take about Costs = 5.2 trln $USD in 2050 |
Non-fossil fuels grow slow up to 2050, then pace gather either wind&solar or nuclear energy. (RES take about 50 % in energy mix by 2050). Total energy consumption = 500 EJ/yr = 11.9 Gtoe in 2050. Costs differ: |
Energy market grows at 2 % per year with current
energy mix staying stable. Non-fossil fuels = Costs = 6 trln $USD in 2050 |
||
|
B |
M. Bazillian, M. Bradsaw, A. Goldthau, K. Westphal (2019). Model and
manage the changing geopolitics |
1980–2100 |
Economic modeling |
‘Big Green Deal’ (policies, funding and cooperation drive rapid decarbonization) |
‘Technology Breakthrough’ (Renewables surge then slow as competition limits their spread) |
‘Dirty Nationalism’ & ‘Muddling On’ (Fossil-fuel industries are protected and energy markets fragmented OR fossil fuels dominate and renewables fail to mitigate climate change) |
|
|
Key points & indicator estimates |
Non-fossil fuels 50 % of energy mix by 2050 |
Non-fossil fuels 50 % of energy mix by 2040 |
Non-fossil |
||
|
B |
Akayev A. A., Davydo- |
2000–2100 |
Mathematic modelling (based on fundamental multi-factor computation) |
‘Net-Zero scenario’ (sufficient decarbonization efforts of key actors + substantial shift in societal decision-making mechanisms towards energy transition) |
‘Ambitious scenario’ (sufficient decarbonization efforts of key actors) |
‘Conservative scenario’ (current trends are prolonged) |
|
Key points & indicator estimates |
Non-fossil |
Non-fossil |
Non-fossil |
|||
|
C |
BP Energy Outlook 2022 |
2020– |
Scenario-descriptive method (the goal – to cover the whole range of possible outcomes), with correlation with scenarios by the Intergovernmental Panel on Climate Change (IPCC) |
‘Net Zero’ |
‘Accelerated’& ‘New Momentum’ |
‘Delayed & Disorderly’ |
|
Key points & indicator estimates |
RES – 64 % by 2050, with nuclear – 7 % and hydro – 10 %; oil – 7 %, gas – 9 %. Global temperature increase = 1.5 °C. Total energy consumption = 650 EJ in 2050 = 15.5 Gtoe |
RES – 56–33 % by 2050, with
nuclear – 6–4 % and hydro – |
Assumption is staying within the finite carbon budget. Global temperature increase = over 2 °C. Total energy consumption = 420
EJ |
|||
|
C |
Shell Energy Transformation Scenarios 2021 |
2020–2100 |
Scenario-descriptive method (modeling based on hypothesis about which driver will prevail in actors' decision-making) |
‘Sky’ |
‘Waves’ |
‘Islands’ |
|
Key points & indicator estimates |
1.5 °C by 2100; solar&wind = 20 % by 2029; 50 % by 2043. Total energy consumption = 828 EJ in 2050 (= 19.7 Gtoe); 1,049 EJ in 2100 (= 25 Gtoe) |
2.3 °C by 2100; solar&wind = 20 % by 2031; 50 % by 2053. Total energy consumption = 901 EJ in 2050 (= 21.5 Gtoe); 1,361 EJ in 2100 (= 32.4 Gtoe) |
2.5 °C by 2100 (and rising); solar&wind = 20 % by 2035; 50 % by 2068. Total energy consumption = 704 EJ in 2050 (= 16.8 Gtoe); 823 EJ in 2100 (= 19.6 Gtoe) |
|||
|
C |
2050 World and China Energy Outlook (CNPC 2019) |
1990–2050 |
Economic modeling |
‘Scenario with early breakthrough in hydrogen vehicle development’ (with 80 % of global mileage by 2050) |
‘Reference scenario’ (current trends are prolonged) |
‘Scenario with technological breakthroughs in oil and gas’ & ‘Deglobaliza- |
|
Key points & indicator estimates |
World primary energy demand = 13.9 Gtoe by 2050 (calculated by author based on predicted fall in energy consumption in transport sector) |
By 2050: World population = 9.77 bln; World GDP = US$205; World
primary energy demand = |
By 2050: RES = 26.3 %; World
primary energy demand = |
|||
|
|
|
CO2 emissions peak at 40 bln tons in 2030, falling to 33 bln tons in 2050 |
|
Table 1 allows producing several significant results for the
hypothesis testing. First and foremost, the growth of new energy sources is
predicted by every researched expert or group of experts. Second, the
interconnection between population, energy consumption and climate remains the
major driver of energy transition despite the energy saving technologies
growth, the new solutions for cutting down greenhouse gas emissions and the
emergence of such fuels as hydrocarbon and safer options for nuclear energy
generation (the latter is often addressed as a clear source of energy). The
overall conclusion
is that in any case no breakthroughs are
expected in energy generation and industrial production. As a result, no
significant changes in ‘energy trilemma’ concept are expected.
This result leads to the partial proof of the hypothesis – while the mathematical expectation of the optimum of energy development lies in the intersection of energy trilemma, the forecasts appear as the local variations for the optimums, as they are produced as the estimations of the energy trilemma optimum.
Discussion
Based on the gathered data a median prognosis calculation was executed (Table 2, graphs 1–6). The methodology (formulas) used to calculate the median prognoses calculation is stated within each respective table cell: the respective key target metric drawn from forecasts made by various international and national organizations and outlined in Table 1 in same units of measurement, are then summed up and their arithmetic medium is found.
The arithmetic medium for each scenario 2050, X, is calculated as:
X= {Sum of
metrics}÷{Total numbers of forecasts,
where the respective metrics are indicated}.
The count presumes low-basis effect of energy-transition key metrics efficiency from 2021 and longer period need for additional marginal effects after breakthrough; therefore, if no specific prognoses are identified for 2100, change rate development presumes to be same for periods 2021–2050 and 2050–2100. This translates into the calculation as follows:
1. For each scenario 2050, X, a percentage of change in comparison to base year (2021), D, is found (indicated within each the respective table cell);
2. The key metrics for each scenario 2100, Y, is calculated as:
Y = X*(1+100/D).
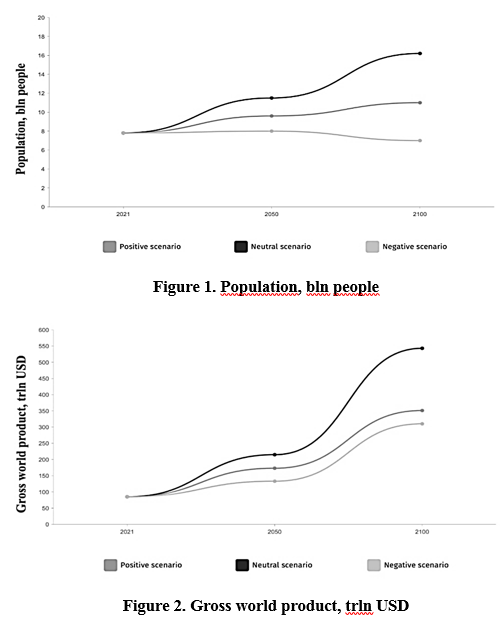
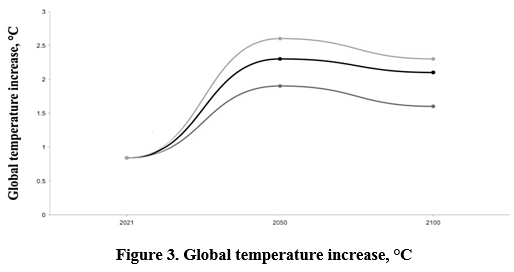
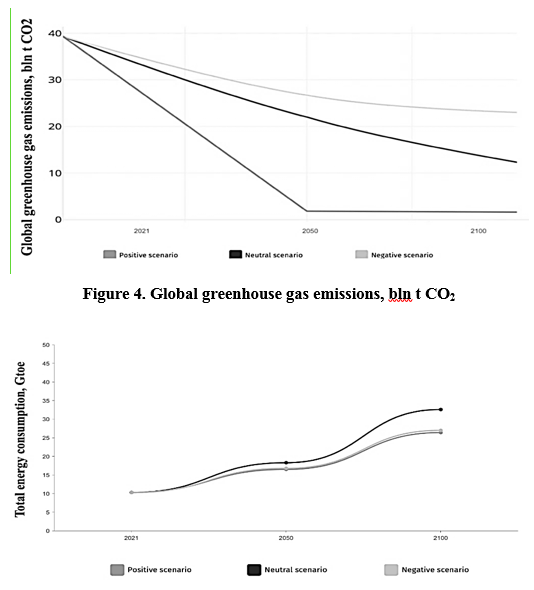
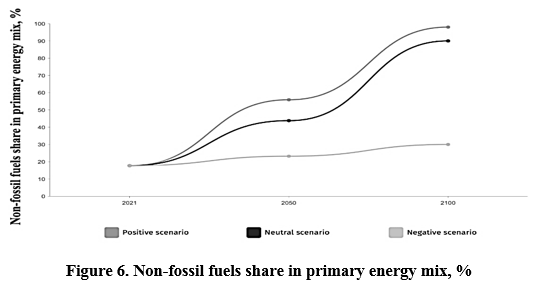
The obtained median prognoses key metrics were used to construct the curves shown in Figures 1–6 (each Figure shows the respective key metrics in time and according to positive, neutral and negative scenarios).
Table 2
Key target metrics by energy transition scenario: median prognoses calculation2
|
Key target metrics |
Base year (2021) |
Positive Scenario 2050 |
Positive Scenario 2100 |
Neutral Scenario 2050 |
Neutral Scenario 2100 |
Negative Scenario 2050 |
Negative Scenario 2100 |
|
Population, bln people*** |
7.8 |
9.6 |
11 |
11.5 |
16.2 |
8 |
7 |
|
Gross world product, trln USD*** |
84.9 |
(198 + 150 + |
173 * 2.03 = 351 |
(229 + 205 + |
214.8 * 2.53 = 543 |
(168 + 80 + |
133 * 2.33 = 310 |
|
Global temperature increase, °C** |
0.84 |
(2.2 + 1.5 + 1.5 + 1.9) ÷ |
(1.7 + 1.5) ÷ |
(2.5 + 2 + 2.1) ÷ 3 = 2.2 |
(1.8 + 2.3) ÷ |
(3 + 2.1 + 2.4) ÷ 3 = 2.5 |
(2 + 2.5) ÷ |
|
Global greenhouse gas emissions, bln t CO2* |
39.3 |
(17 + 16 – 0.5 + 0) ÷ |
8.1 × 0.2 = 1.6 |
(28 + 15 + 33 = 12) ÷ |
22 × 0.56 = 12.3 |
(36 + 29 + 12.9 + 29) ÷ |
26.7 × 0.87 = |
|
Total energy consumption, Gtoe* |
10.3 |
(15.3 + 15.5 + 19.7 + 13.9) ÷ 6 = 16.5 |
16.5 × 1.6 = 26.4 |
(16.3 + 21 + 22 + 11.9 + 17.6 + 21.5 + 18) ÷ 7 = 18.3 (+ 78 % to base year) |
18.3 × 1.78 = 32.6 |
(17.9 + 24.4 + 17.2 + 14.3 + 10 + 16.8) ÷ 6 = 16.8 |
16.8 × 1.63 = 27 |
|
Non-fossil fuels share in primary energy mix, %* |
17.7 |
(26.3 + 40 + |
approx. 98***** |
(25 + 40 + 46.6 + 50 + 50 + 28.4
+ 60 + 44.5 + 50) ÷ 9 = 43.8 |
approx. 90 |
(12 + 30 + 10 + 15 + 35 + 26.3 +
22 + 35) ÷ |
23.2 × 1.31 = 30 |
* Base year statistics from: KPMG&Kearney report https://www.energyinst.org/statistical-review.
** Base year statistics from NCEI 2021.
*** Average calculation based on scenario review (primary sources: UN, IPCC, SRES): Population projections; Economic Development // IPCC Emission Scenarios Special Report. // IPCC archive, official website. Mode of access: https://archive.ipcc.ch/ipccreports/sres/emission/index.php?idp=14.
**** Average calculation based on: World Energy Council 2019; Moyer 2023; CNPC 2019; Wang and Teng 2022.
***** In situations where the prolonged prognoses 2100 calculation exceeds 100 %, the author adjusts the results to close realistic share (e.g., 98 %).
Conclusion
1. BRICS countries are considerably less
active in building scenario analysis, and provide only limited research and vision in the sphere; the global
research and source base
is dominated by relevant Western sources. However, the given research includes three
(A, B, C-type) BRICS-affiliated sources as a
form of additional possible bias-correction.
2. It should be noted that the identified scenarios (positive/neutral/negative) are comparable, as they proceed from similar assumptions: the positive scenario assumes maximisation of funds and efforts aimed at energy transition with high energy efficiency; the neutral scenario often assumes implementation of energy transition within the context of highest economic growth, individual political challenges and certain level of technological advancement; the negative scenario predicts a minimal result of energy transition, often linking it to maximisation of political contradictions.
3. Notably, the neutral scenario presents the hypothetically optimal development variant in terms of energy trilemma (energy equity, energy security and environmental sustainability). As comes from the obtained data and the context from the analyzed sources, according to this scenario, the share of renewable energy sources and hydrogen in the global energy balance is expected to increase significantly (over 80% by 2050), but the distribution of their share in the energy balance will be heterogeneous depending on countries and regions. Global greenhouse gas emissions and the global temperature rise will present a medium between the positive and the negative scenarios. But at the same time, it is the scenario which will allow for the highest population and GDP growth (almost twice higher than expected growth in the positive scenario). This hypothesis is to be proved by the author at the next stages of research.
In the next step, the author will generate final scenarios by adjusting the median forecast based on expert analysis of the energy transition factors identified at earlier stages of the study.
Acknowledgment
This article was prepared within the framework of the Russian Science Foundation (grant No. 22-78-00214).
NOTES
1 Your quick guide to the outcomes of COP28 // Forbes. Retrieved from: https://www.forbes.com/sites/davidcarlin/2023/12/13/your-quick-guide-to-the-outcomes-of-cop-28/?sh=542077321c4e.
2 Based on data from Table 1.
REFERENCES
Akayev, A. A., Davydova, O. I. 2022. Climate and Energy. Scenarios of Energy Transition and Global Temperature Changes Based on Current Technologies and Trends. Istoriia i sovremenost 4: 36–57. DOI: 10.30884/iis/2022.04.03. In Russian.
Bazillian, M., Bradsaw, M., Goldthau, A., Westphal K. 2019. Model and Manage the Changing Geopolitics of Energy. Nature 569: 29–31. https://doi.org/10.1038/d41586-019-01312-5. URL: https://www.nature.com/articles/d41586-019-01312-5?utm_source=Nature+Briefing&utm_campaign=2fd338d820-briefing-dy-20190502&utm_medium=email&utm_term=0_c9dfd39373-2fd338d820-43600101.
BP. 2022. BP Energy Outlook 2022 Edition. URL: https://www.bp.com/content/dam/bp/business-sites/en/global/corporate/pdfs/energy-economics/energy-outlook/bp-energy-outlook-2022.pdf.
CNPC. 2019. 2050 World and China Energy Outlook. CNPC Economics and Technology Research Institute. ResearchGate. URL: https://www.researchgate.net/publication/345151631_2050_World_and_China_Energy_Outlook_2019.
Guliev, I. A. 2024a. International energy relations in the context of global energy transition: technological aspect. Discussiya 5 (126): 171–176. DOI 10.46320/2077-7639-2024-5-126-171-176. Original in Russian (Гулиев, И. А. Международные энергетические отношения в условиях глобального энергетического перехода: технологический аспект. Дискуссия № 5 (126): 171–176).
Guliev I. A. 2024b. Strategic Technological Adaptation of Russia to the Global Energy Transition: Analysis of the Traditional Energy Sector. O. Strakhovoe delo 7 (376): 12–20. (Гулиев, И. А. Стратегическая технологическая адаптация России к глобальному энергетическому переходу: анализ сектора традиционной энергетики. Страховое дело. № 7 (376). С. 12–20).
Guliev I. A. 2024c. Strategic Technological Adaptation of Russia to the Global Energy Transition: Analysis of the Non-Carbon Energy Sources Sector. Upravlenie Riskom 2 (110): 9–19. (Гулиев, И. А. Стратегическая технологическая адаптация России к глобальному энергетическому переходу: анализ сектора неуглеродных источников энергии. Управление риском. № 2 (110). С. 9–19)
.IESS. N.d. India Energy Security Scenarios (IESS) 2047. URL: https://iess2047.gov.in/#?in
puts=1-1-1-1-1-1-1-1-1-1-1-1-1-1-1-1-1-1-1-1-1-1-1-1-1-1-1-1-1-1-1-1-1-1-1-1-1-1-1-1-1-1.
IRENA. 2023. World Energy Transitions Outlook 2023. URL: https://www.irena.org/-/media/Files/IRENA/Agency/Publication/2023/Jun/IRENA_World_energy_transitions....
KPMG&Kearney. 2023. Statistical
Review of World Energy. URL: https://www.energyinst.
org/statistical-review.
Moyer, J. D. 2023. Modeling Transformational Policy Pathways on Low Growth and Negative Growth Scenarios to Assess Impacts on Socioeconomic Development and Carbon Emissions. Sci Rep 13: 15996. https://doi.org/10.1038/s41598-023-42782-y.
NCEI
– National Centers for Environmental Information. 2021. Annual 2021 Global Climate Report. URL: https://www.ncei.noaa.gov/access/monitoring/monthly-report/global/202113#:~:
text=The%20year%20culminated%20as%20the,ten%20warmest%20years%20on%20record.
OPEC. N.d. World Energy Outlook 2050. URL: https://publications.opec.org/woo.
Shell. 2021. Shell Energy Transformation Scenarios 2021.
URL: https://www.shell.com/
energy-and-innovation/the-energy-future/scenarios/what-are-the-previous-shell-scenarios/
the-energy-transformation-scenarios/_jcr_content/root/main/section_524990089/simple/
promo_copy_1516727479/links/item0.stream/1652184088020/f91916c4527649c220d98
0582a53095403809767/shell-energy-transformation-scenarios-overview.pdf.
UN. 2023. Long-Term Low-Emission Development Strategies. Synthesis report by the secretariat. URL: https://unfccc.int/documents/632339.
Wang, T.-P., Teng, F. 2022. A Multi-Model Assessment of Climate Change Damage in China and the World. Advances in Climate Change Research 13 (3): 385–396. https://doi. org/10.1016/j.accre.2022.04.005.
Way, R., Mealy, P., and Farmer, J. D. 2020.
Estimating the Costs of Energy Transition
Scenarios Using
Probabilistic Forecasting Methods. University of
Oxford. URL: https://
www.inet.ox.ac.uk/files/energy_transition_cost_INET_working_paper_with_SI1.pdf.
World Energy
Council. 2019. World Energy Council Energy Scenarios. URL: https://www. worldenergy.org/publications/entry/world-energy-scenarios-2019-exploring-innovation-
pathways-to-2040.