Population Ageing and Global Economic Growth

Journal: Journal of Globalization Studies. Volume 7, Number 2 / November 2016
The author develops a simple model to examine the impact of population ageing – including reduced productivity and declining labor forces – on global economic growth.
Keywords: global economic growth, labor force, population ageing, demographic bonus, demographic onus.
What will be the impact of population ageing on global economic output? How fast will Africa or other regions have to grow to make up for slowing growth in China? Which countries or regions will likely be the prime drivers of global economic growth in the future?
To answer these questions, we can develop a simple model of productivity gains and losses from population growth and population ageing, and apply it to projections of labor force growth (or decline) in various regions. The results provide a set of simulations that allow us to grasp the rough contours of likely global economic growth under various scenarios.
Productivity Gains: From Good to Gone
In theory, productivity gains are easy to come by, with several major routes all contributing significant increases in output per employed worker. First is urbanization; simply shifting workers from lower productivity rural work (mainly agriculture and home production or handicrafts) to urban work (services and machine-aided manufacture) provides major gains. Second is sectoral shifts; the transfer of workers from lower productivity labor-intensive manufacturing and unskilled services (food preparation, janitorial, retail, tourism) to capital intensive manufacturing and professional services provides additional boosts to productivity. The education of the labor force, in regard to both secondary and tertiary education, is a requirement for, and hence is associated with, this kind of sectoral change. Finally, the information/communications revolution, by networking workers and linking them to information, can also provide increases in their productivity; but to be sure our current measurements do not do a very good job of showing those gains in practice (Triplett 1999).
Yet in recent years many scholars have argued that the easy gains from the first two factors are over, at least in the mature industrial economies (Cowen 2011; Gordon 2012). And indeed, the data on productivity in these economies shows a marked decline in the increase in GDP per person employed. As Fig. 1 shows, since the mid-1970s the growth in this measure of productivity has declined markedly and remained low for the last 30 years. The only exception is South Korea, which experienced strong productivity gains up through the mid-1990s; but since that period South Korea has joined the other advanced economies in regression to a mean annual productivity increase of 2 per cent.
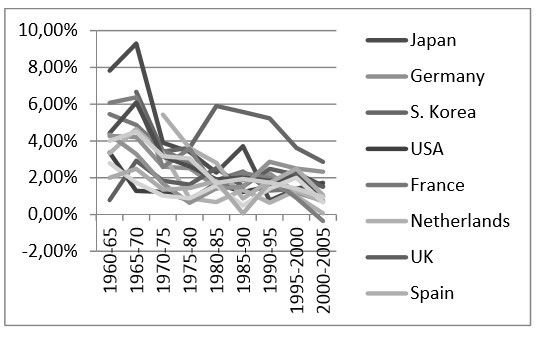
Fig. 1. Productivity decline in the advanced industrial economies, 1960–2005
Source: BLS 2009.
From Demographic Bonus to Demographic Onus
One reason for this widespread decline in productivity may lie in shifting demography. Ogawa, Kondo and Matsukura (2005), writing about Japan in particular, described the process of population ageing as taking an economy from enjoying a demographic bonus to facing the burden of a demographic onus. The demographic bonus, or demographic dividend (Lee and Mason 2006), is a result of reaching a middling stage in the demographic transition. In that transition, the initial stage is a decline in mortality rates concentrated in the youngest years, while fertility rates remain moderately high. In this stage societies experience a sharp increase in population growth but also a rapid rise in the dependency ratio, as the number of young people aged 1–14 expands very fast relative to the number of working age people (those 15 and older). In this stage, societies have to invest a great deal in clothing, feeding, caring for, and educating the young.
In the middle phase of the transition, fertility rates decline as well. This causes a significant slowdown in the growth of younger age cohorts; but the past growth in the young population now shows up as a rapid expansion of the labor force. Since the younger population is no longer surging, but the past growth has not yet produced a large number of older (over 65) people, the ratio of workers in the prime working years to those who are dependent surges. Moreover, since fewer resources are needed for feeding, clothing, caring for, and educating the young, more capital is available to invest in raising the productivity of those of working age. In addition, the benefits of investing in the health and education of the very young cohorts in the first phase can now begin to pay off, as younger workers are healthier and better educated, and thus more productive, than the workers they replaced.
Of course, this bonus is not automatic. It will fail altogether if the larger labor force cannot find employment; and it will be reduced if the younger workers did not receive more education and more capital per worker than the older workers that preceded them. Still, in most of today's mature industrial economies, the demographic bonus played a substantial role in boosting their economies and their productivity growth in the 1950s and 1960s; and it also played a similar role in boosting productivity in South Korea in the 1980s and 1990s and in China from the 1980s to the early 2000s (Bloom et al. 2003; Cai 2009).
In the third phase of the demographic transition, these positive trends go into reverse. With still diminishing mortality, though now concentrated in the later years of life, much of the enlarged workforce now moves into its senior years (population ageing) and the dependency ratio again increases. Moreover, a larger portion of the workforce will be in the later stages of their careers, from age 40–65. This is a period of general stagnant or declining productivity, compared to workers age 20–40, whose productivity generally rises rapidly with gains in experience and education (Lee and Mason 2011). If the fertility rate declines very sharply, the size of the labor force may experience an overall contraction as well. To some degree, these trends may be offset by rising education and capital investment of the smaller workforce, aided by the savings accumulated by late career workers as they save for retirement, providing a ‘second demographic bonus’ (Idem 2006). Yet as more and more workers enter their 60s, 70s, and 80s, and draw down their savings, more resources will be diverted to providing medical care and retirement support (savings and government pensions) for the elderly. Moreover, unlike the investments in school-age children and younger workers, which produce large payoffs 20 years hence when those workers enter the labor force and their prime productive years, the investments in maintaining the lives, health, mobility, and entertainment of the elderly are a dead-weight loss, buried with the elderly a decade or two hence when they pass. These negative trends create a demographic ‘onus’ that, other things equal, will eventually lower the rate of productivity growth in ageing societies.
Estimating the Effects of Ageing and Regional Differences in the Global Economy
We can create a rough estimate of how much ageing and population growth in different regions will contribute to global economic growth in the next 25 years (2015–2040) by looking at likely rates of productivity growth (in terms of gains in output per employed persons) in various regions, and multiplying that by the projected increase in the labor force (population aged 15–64) in those regions. Of course, the actual percentage employed will depend on labor force participation and rates of unemployment. But for simplicity we assume that labor force participation will not change dramatically in the next 15 years and that unemployment will be cyclical around an equilibrium rate, so that fluctuations will cancel out over a 15-year period. These two assumptions ensure that the employed population will be a constant proportion of the working age population (labor force), and so the growth rate in employed population over the period will be the same as the growth rate of the labor force.
However, while the employed population may grow in line with labor force, if a population is ageing then a larger proportion of those employed will be aged 40 or above, and hence will not contribute to increasing productivity. I have chosen to enter this effect in a very simple, but transparent and easy to calculate way, by reducing the rate of productivity growth as the median age of the population increases. If we assume (as is the likely equilibrium for advanced industrial societies) an age pyramid in which all cohorts are the same size, then the number of workers aged 20–39 will be the same for each age. If a one-year increase in the median age pushes the last cohort to age 40, that will reduce the number of workers aged 20–39 by .05 per cent. So I approximate the impact of ageing on productivity growth by reducing the gains in productivity per employed worker (which are assumed to be provided entirely by gains to experience and education in those under 40) by .05 per cent for every year increase in the population median age from 2015 to 2040.
For example, for Europe – as for the other mature industrial economies – I assume that productivity per employed person will continue to grow at a basic rate, driven by capital investment and education growth, at the same level that has prevailed for the last 30 years, namely 2 % per annum. However, I reduce this by a quarter, as the median age in Europe is projected to grow by 4.9 years from 2015 to 2040 (UN Population Division 2012), and 4.9 x .05 = .245. In addition, the labor force in Europe is expected to shrink significantly, by .51 % per year, for a total reduction of 12 % in 2015–2040. Multiplying these figures produces an expected economic growth rate, taking account of productivity growth, labor force change, and population ageing, of 1.23 % per year for this period. Starting from Europe's GDP in 2014, and using this growth rate to project GDP in 2040, and repeating these calculations for every other region, allows us to calculate Europe's expected contribution to total global GDP increase over this quarter century.
I have divided the world into a variety of economic regions. Europe, the US and Canada, Japan, and Oceania (Australia and New Zealand) are assumed to be mature industrial economies with base productivity growth rates of 2 % per year. Russia and the Former Soviet Union Countries, however, are seen as likely to grow more slowly, due to the constraints that centralized authority and strict information controls will put on their ability to transition to innovation and knowledge-based economies. I assume their base productivity growth rate will be 1 % per year. (If Russia continues to be afflicted by ultra-low oil prices and international sanctions, as it is currently, even that may be optimistic.)
Other regions are assumed to still have much higher growth rates, as they are still benefitting from the first or second demographic bonus. Thus, I assume that China will still enjoy annual gains in productivity per employed person of 6 %, due to continued shifts to employment requiring higher education, greater investments of capital per worker, and further urbanization. I assume India will have productivity gains almost as high, of 5.5 % (representing its most recent rate). Sub-Saharan Africa is also assumed to have a productivity growth rate of at least 5 %, as it enters the first demographic dividend (although that will depend on its currently stalled fertility starting to decline [Guengant and May 2013]).
For other regions that are not yet mature industrial economies, but no longer low-development countries, I assume an annual rate of productivity increase of 4 % (4.2 % for Indonesia as that is its most recent rate); these areas include Latin America and Asia outside of China, India, Indonesia and Japan. For the Middle East and North Africa, I assume a slightly lower rate of productivity growth, given the ravages of the Arab Revolutions of 2011 and the ongoing civil wars still plaguing the region.
Most of these areas will still enjoy a rapid growth of their labor forces in this period (UN Population Division). Using the UN's medium estimates, these rates range from a high of 2.75 % per year in sub-Saharan Africa to just 0.32 % per year in the US and Canada. However, every region on earth is now experiencing some measure of population ageing. Interestingly, the fastest rises in median age are not in the ‘already old’ areas of Europe or Japan. The rate of ageing is highest in China and Latin America, followed by other areas of Asia. Ageing is lowest in areas of still relatively high population growth (sub-Saharan Africa) or areas of high immigration (US and Canada, and Oceania).
With these estimates, the overall rate of growth of the world's economy is 3.1 %; about the same as the world experienced from 1990 to 2012 (World Bank 2014). However, some people may find a sustained productivity growth rate for sub-Saharan Africa of 5 % excessively optimistic (Rodrik 2014). Given the increase in population and minimal ageing, SS Africa's economy is projected to grow at 7.7 % per year in this model, the highest of any region. While growth has been strong recently, this is still well above the level of growth in most African nations. And as there is no sign that Africa's fertility is declining (Guengant and May 2013), the projected demographic bonus may not arise. We can run the model again with assumed lower productivity growth rates for sub-Saharan Africa.
The results are interesting, even dropping Africa's annual productivity increase to 2 % only drops its growth rate to 4.63 %; this implies that much of Africa's recent 5 % per year growth rates are due to labor force gains rather than productivity improvements (World Bank 2014). What is more, the impact on global economic growth is minimal, dropping from 3.1 to 2.96 %. This is because Africa's contribution to global GDP is so small, changes in its growth rate have a minimal impact on total global growth rates. But that means Africa cannot play the role of the ‘next China’ anytime soon. Perhaps after 2040; but in the next 15 years if there is a major slowdown in China's output, there is no way that growth in Africa can compensate.
We can see that by running the model with changes in China's growth rate. In the base projection, China's productivity is set to grow at 6 % per year, but rapid ageing and a sharp decline in the labor force, second only to Japan, reduce the net expected growth rate to only 4.92 % per year. If China's productivity grows instead by 5 % a year, its new growth falls to 3.93 % per year. That has a modest impact on global economic growth, which declines only from 3.1 % to 2.94 %. But for growth in Africa to offset that decline and restore global growth rates to 3.1 %, African productivity per person would have to increase by 7 % per year, leading to sustained annual growth rates of 9.75 %. In other words, Africa can offset a growth decline in China, but only if it grows just as rapidly as China did during its boom years.
The same is true of India. If China's productivity growth averages only 5 % in this period, India's productivity would have to increase by 7.5 % per annum (a net growth rate of 8 % per year) to keep global economic growth at 3 %.
The biggest gains to the world economy would, naturally, come from boosting output in the biggest regional economies, namely those of Europe and North America. If Europe or the US/Canada increased their annual productivity gains to 3 % per year, the world economy would grow by about 3.3 % per year. If both could achieve such productivity gains, the world growth rate would be 3.5 %, despite demographic ageing and work force changes.
At the same time, this simulation shows how difficult it will be to achieve a 4 % rate of global economic growth, a rate commonly seen or exceeded prior to 1980. In order to boost global growth rates to 4 % per year in 2015–2040, given global demographic trends, here is what must happen: annual productivity gains per employed worker of 3 % in both Europe and North America; of 7 % per annum in China; of 8 % per annum in India, of 5 % per annum in Latin American and other Asia, and 6 % per year in sub-Saharan Africa. Is this possible? Perhaps – with optimum education and investment in Africa and India, China's economy stabilizing at an overall growth rate of 6 % for the next 25 years, and Latin America boosting its growth rate to ‘miracle’ levels of sustained 5+ % growth. In addition, new technological marvels (3D printing, driverless cars, commercial drones, etc.) would have to boost productivity gains in Europe and North America back to the 3 % per year levels not seen for several decades.
The Future Will be Different
These projections seem highly optimistic. It is more likely that we are simply entering a wholly different world than we experienced prior to 1980. In the immediate post-WWII decades, several factors strongly promoted global growth. First, population growth was rapid in the largest and most productivity-advancing regions, namely Europe and the United States. Second, movements of population out of agriculture to the cities and into manufacturing were easy and widespread in Asia and Latin America (and in China after 1980, where urbanization and growth had previously been suppressed under Mao Zedong's strict communist regime). Third, the development of globalized production and trade stimulated markets around the world and created greater efficiencies in the distribution of capital and production. But these advances have now spread to most of the world, and their potential for further rapid growth is diminished. In addition, the world's largest economies – the U.S. and Europe – are now experiencing much reduced labor force growth or even decline, in addition to slower productivity increases. Global growth of 3 % per year may be the ‘new normal’ as far as the next quarter century is concerned.
Even Africa, despite its enormous potential for a demographic dividend and increased movement of population from rural work to urban manufacturing, will not be able to boost global economic growth back to 4 % on its numerous shoulders. At best, growth in Africa should just offset declining growth rates in China. If we use the model to ask – what growth rate in Africa would be necessary to raise the global growth rate to 4 %, if all other regions experience the baseline growth rate, the answer is that sub-Saharan Africa would have to enjoy 25 years of sustained growth of 15 % per year, based on productivity gains of 12 % per year. That is a rate never sustained even by China with its strong government, internal peace, excellent education, and access to rapidly expanding export markets in 1980–2010; and is extremely unlikely to be reached by a divided, poorly governed, and under-educated Africa. Those who saw 4 % global economic growth as ‘normal’ in the 1960s and 1970s are unlikely to see that return in their lifetimes.
Still, 3 % annual growth need not be unpleasant. With global population growth slowing sharply, projected to increase only from 7.32 to 9.04 billion in this period, for an annual increase of under 1 % per year, that still leaves plenty of room for per capita income growth. The real question will be how that net growth is distributed. If most of the world's population enjoys a real annual income increase of 2 % per annum, the future may look bright, with real incomes doubling each generation. But if, as in recent years, most of those gains go to a small fraction of the global population (Piketty 2014), progress for most people will be minimal. The problem is that there is not enough growth to go around; concentrating gains at the same time that global growth is slowing will likely create a new world politically, as well as economically, in the coming decades.
REFERENCES
Bloom, D. E., Canning, D., and Sevilla, J. 2003. The Demographic Dividend: A New Perspective on the Economic Consequences of Population Change. Santa Monica, CA: RAND Corporation.
Bureau of Labor Statistics (BLS). 2009. International Comparisons of GDP per Capita and per Employed Person: 17 Countries, 1960–2008. Washington, DC: Department of Labor.
Cai, F. 2009. Future Demographic Dividend – Tapping the Source of China's Economic Growth. China Economist (July–August): 17–24.
Cowen, T. 2011. The Great Stagnation: How America Ate All the Low-Hanging Fruit of Modern History, Got Sick, and Will Feel Better. London: Dutton/Penguin.
Gordon, R. J. 2012. Is U.S. Economic Growth Over? Faltering Innovation Confronts the Six Headwinds. NBER Working Paper No. 18315. Cambridge, MA: National Bureau of Economic Research.
Guengant, J.-P., and May, J. F. 2013. African Demography. Global Journal of Emerging Market Economies 5(3): 215–267.
Lee, R., and Mason, A. 2006. What is the Demographic Dividend? Finance and Development 43(3): 16–17.
Lee, R., and Mason, A. 2011. Population Aging and the Generational Economy: A Global Perspective. London: Edward Elgar.
Ogawa, N., Kondo, M., and Matsukura, R. 2005. Japan's Transition from the Demographic Bonus to the Demographic Onus. Asian Population Studies 1(2): 207–226.
Piketty, T. 2014. Capital in the Twenty-First Century. Transl. by Arthur Goldhammer. Cambridge, MA: Harvard University Press.
Rodrik, D. 2014. Why an African Growth Miracle is Unlikely. Milken Institute Review: 43–54.
Triplett, J. 1999. The Solow Productivity Paradox: What do Computers Do to Productivity? Canadian Journal of Economics 32(2): 309–333.
UN Population Division. 2012. World Population 2012. New York: UN Population Division, UN Department of Economic and Social Affairs. URL: http://www.un. org/en/development/desa/population/publications/pdf/trends/WPP2012_Wallchart.pdf.
World Bank 2014. World Development Indicators: Growth of Output. URL: http://wdi. worldbank.org/table/4.1.
APPENDIX
Table 1
A Simple Model of Contributions to Global Economic Growth, Adjusting for Labor Force Growth and Aging, 2015–2040
|
| Productivity Growth |
Labor Force Growth 2015–2040 | Labor Force Aging Factor | GDP Growth rate
| GDP
2014 | Total Growth
2015-2040 | GDP
2040 | ||
|
% per year for 25 years | Avg. | Total | (increase in median age*.05) | 2015-2040
| |||||
|
Europe |
2 |
1.640606 |
–0.51 % |
0.88 |
–0.25 % |
1.23 % |
17891 |
1.357856 |
24293 |
|
US+ Canada |
2 |
1.640606 |
0.32 % |
1.083 |
–0.14 % |
2.19 % |
18022 |
1.717772 |
30958 |
|
Japan |
2 |
1.640606 |
–1.01 % |
0.776 |
–0.33 % |
0.64 % |
5733 |
1.172135 |
6720 |
|
Russia + FSU |
1 |
1.282432 |
–0.32 % |
0.923 |
–0.24 % |
0.44 % |
2298 |
1.116069 |
2565 |
|
China |
6 |
4.291871 |
–0.52 % |
0.877 |
–0.50 % |
4.92 % |
8062 |
3.324825 |
26805 |
|
India |
5.5 |
3.813392 |
0.86 % |
1.24 |
–0.36 % |
6.03 % |
2097 |
4.320919 |
9061 |
|
Indonesia |
4.2 |
2.797003 |
0.66 % |
1.18 |
–0.36 % |
4.52 % |
901 |
3.019693 |
2721 |
|
Other Asia |
4 |
2.665836 |
0.70 % |
1.19 |
–0.38 % |
4.33 % |
3973 |
2.887944 |
11474 |
|
Latin America |
4 |
2.665836 |
0.56 % |
1.15 |
–0.44 % |
4.13 % |
5970 |
2.749152 |
16412 |
|
MENA |
3 |
2.093778 |
1.24 % |
1.36 |
–0.32 % |
3.95 % |
3767 |
2.63157 |
9913 |
|
Oceania |
2 |
1.640606 |
0.99 % |
1.28 |
–0.16 % |
2.85 % |
1476 |
2.020097 |
2982 |
|
SS Africa |
5 |
3.386355 |
2.75 % |
1.97 |
–0.17 % |
7.70 % |
1552 |
6.393306 |
9922 |
|
|
|
|
|
|
|
|
|
|
|
|
WORLD |
|
|
|
|
|
3.10 % |
71742 |
2.144149 |
153826 |