Are Globalization and Governance Interrelated? Evidence among World Economies

Journal: Journal of Globalization Studies. Volume 7, Number 2 / November 2016
This paper is to explore a new way to look at globalization and governance. The objective of this paper is to quantify the degree of globalization together with the degree of governance. The differences of our indices from existing literatures are that we use principal component analysis for both indices, and we improve on how indices are computed by taking Lockwood (2004) suggestions; and we also improve on the variables in the indices such that looking at the pair indices at the same time would reflect the interaction of globalization and governance for individual economies. We include intra-industry trade in the globalization index such that the degree of globalization is more accurately reflect in the index. We include aspects that reflect the quality of life, namely, health, education and quality of labor, on top of institutional governance in the governance index. Unlike the existing literatures, we do not intend to concentrate on decomposing various factors of globalization and governance; instead, we believe that policy makers can make use of the pair indices to formulate their governance policies to accommodate and advance the globalization process of their economies.
Keywords: globalization, governance, factor analysis.
I. Introduction
Globalization is an ongoing process of greater inter-dependence among countries. The process is complicated because globalization is more than just an economic phenomenon. Technological and political changes also drive the process of globalization, which has massive non-economic consequences on an economy (Fischer 2003). In earlier literatures, the focus usually concentrated on the implications and consequences of economic openness variables like trade and capital flows on income and growth. These advocates usually describe globalization as the gains of income and growth from the increase in foreign direct investment, the fluctuation of relative currency values and merchandize and services trade flows (Feldstein 2000; Kearney 2005).
More recent literatures looked at the relationship between globalization and governance. There are two different groups of literatures that examined the impact of globalization on governance and the impact of governance on the degree of globalization. The first group of studies put more focus on the impact of domestic aspects of an economy when the economy engages in globalization activities. The focus of these researches includes globalization and income distribution (Frankel 2000), poverty, distortion in factor markets (Bhagwati 2002, 2004), corruption (Bonaglia et al. 2001) and gender inequality (Shu et al. 2007). Another group of literatures emphasized the contribution of governance to globalization, they stressed on the efficacy of local governance that affects the degree of globalization. Governments need to consider both ‘globalization’ and ‘governance’ aspect when they consider to go global, especially for emerging economies, which would keen on depending on external drivers, for example, exports and FDI to boost GDP growth rate, however, these economies exposed themselves to external volatilities while their domestic governance are still fragile. It is difficult to successfully move towards a more globalized economy with incomplete and incompatible government policy fragments (United Nations 2000). In developed economies with effective markets and high government capacity, globalization usually implies opportunities to travel, communicate, or influence events. In developing economies, globalization may mean more uncertainty and risk in terms of economic, social, cultural, environmental, and political (Klingner 2004).
In the existing literature, several globalization indices were constructed to quantify the degree of globalization (Kearney 2003; Andersen and Herbertsson 2005; Dreher 2006; Heshmati 2006). Kearney's globalization index is the first globalization index in the literature. The dataset comprises data on 62 countries for the period from 1995 to 2000 and it describes economic, personal contact, technological, and political components. The variables of these components are expected to proxy the channels through which globalization affect individual countries and each factor contributes to the quantification of a multidimensional globalization index. It was constructed by using simple weighted average of the components, and the weightings are chosen arbitrarily. Based on Kearney's research, Lockwood (2004) finds the ranking of countries to be sensitive to the way the indicators are measured, normalized and weighted. Making improvements on Kearney's method, Andersen and Herbertsson (2003) used factor analysis and Heshmati (2006) used principal component analysis to construct their globalization indices. Dreher (2006) constructed sub-indices of economic globalization, social globalization and political globalization, and added more variables in the dataset, especially in cultural globalization. The study used principal components analysis to calculate the weights of the sub-indices and then apply principal component analysis on the sub-indices to get the overall globalization index.
In the context of openness, existing globalization indices did not include dimension of trade patterns as one of the variables. Intra-industry trade implies higher dimension of trade pattern. Intra-industry trade refers to the exchange of products belonging to the same industry (Ruffin 1999). It increases the variety of goods an economy can consume, and is surely the effect brought about by globalization. Including intra-industry trade as one of the component of the globalization index reflects more accurately the level of merchandize trade among countries, which is certainly an important expression of the level of globalization.
A couple of governance indices were constructed (Basu 2003; Kauffman et al. 2008), but they hardly link the degree of governance to the performance of globalization. The World Bank Aggregate Governance Indicators measure government governance on political and legal aspects, however, it does not measure other domestic aspect, such as health and education. The development of governance should not only depend on how the government works but also depend on what policies the government addresses to take care of its citizens (Klinger 2004). This study tries to address this policy aspect.
Using principal component analysis the Quality of Economic Governance Index (Basu 2003) focused on the economic part of the governance, and was composed of macroeconomic variables and economic openness variables including government debt and trade together with several governance variables, namely, infant mortality rate, adult literacy rate and poverty of 71 developing and transition economies during 1998~2000. The index tried to link economic openness to governance quality variables, but it combined them into one index, and therefore the interaction and relationship between economic openness and governance quality was unclear.
This paper is to explore a new way to look at globalization and governance. The objective of this paper is to quantify the degree of globalization together with the degree of governance. The differences of our indices from existing literatures are that we use principal component analysis for both indices, and we improve on how indices are computed by taking Lockwood (2004) suggestions; and we also improve on the variables in the indices such that looking at the pair indices at the same time would reflect the interaction of globalization and governance for individual economies. We include intra-industry trade in the globalization index such that the degree of globalization is more accurately reflect in the index. We include aspects that reflect the quality of life, namely, health, education and quality of labor, on top of institutional governance in the governance index.
Unlike the existing literatures, we do not intend to concentrate on decomposing various factors of globalization and governance; instead, we believe that policy makers can make use of the pair indices to formulate their governance policies to accommodate and advance the globalization process of their economies.
The paper is organized as follows. Section II defines the globalization and governance variables in the globalization index and governance index respectively. Section II describes methodology of the two indices. Section IV presents the result and Section V concludes the paper.
II. Data
The dataset consists of a total of 62 world economies over the period from 1998 to 2002. There is a delay in the provision of data. Data for the four years from 1998 to 2001 are complete, while some data for 2002 are either provisional or unavailable.
Globalization Variables and Governance Variables
Globalization variables and Governance variables are selected to construct the Globalization Index (Glob) and the Governance Index (Govn) respectively. There are 17 globalization variables and 17 governance variables. Table 1a lists the globalization variables and Table 1b lists the governance variables and the data sources.
Variables in the Globalization Index are based on Kearney (2005) dataset. It is composed of four major components: economic integration, personal contact, internet technology, and political engagement. Based on the variables in Kearney (2005) Globalization Index we expand the list of globalization variables by incorporating patterns of trade of an economy summarized by inter-industry trade and intra-industry trade. International trade has conventionally been based on comparative advantage. This can be done by looking separately at an economy's performance in inter-industry trade and intra-industry trade. Inter-industry trade shows an economy's export performance based on its own comparative advantage. Intra-industry trade increases the variety of goods an economy can enjoy, and is surely the effect brought about by globalization. Adding intra-industry trade as an extra variable in the construction of the Globalization Index reflects more accurately the dimension of merchandize trade, and therefore this should reflect more accurately the level of globalization.
For the construction of Governance Index, the objective is to compose an index that can represent a general picture of the quality of governance. Working from scratch we expand the World Bank's Aggregate Governance Indicators, which represents the quality of institutional governance by incorporating other governance variables that represent healthcare, education and the quality of labor force. The selection criterion is inspired by Basu (2003). We would like to improve on Basu (2003) so that our Governance Index when reviewed side by side with the Globalization Index can reveal the interaction of globalization and governance. Therefore when we select the governance variables we referred to the existing literatures that they were examined in respect with the process of globalization in the existing literatures as laid out in the Section I. Our objective is to include variables that represent these aspects from well-established sources that can track the data series continuously. The variables are categorized into Institutional Establishment, Education and Health and Quality of Labor Force.
Table 1a
Classification of Globalization variables
|
Globalization variables |
Data Source |
|
1. Economic integration: i) Total trade flows ii) Foreign direct investment iii) Portfolio capital flows iv) Investment income 2. Inter-industry trade: i) Revealed comparative advantage 3. Intra-industry trade: i) Export and import: same product 4. Technology connectivity: i) Internet users ii) Internet hosts iii) Secure servers 5. Personal contact: i) International travel & tourism ii) International telephone traffic iii) Remittances iv) Personal transfers 6. International engagement: i) Membership in international organizations ii) Government transfer iii) International treaties ratified iv) Personnel and financial contribution to United Nations Security Council missions |
IFS IFS IFS BOPS
UN
UN
ITU ITU Net
SSCT ITU BOPS BOPS
WFB BOPS OFW UNDPI |
|
Notes: IFS = International Financial Statistics, International Monetary Fund; BOPS = Balance of Payment Statistics, United Nations; UN = United National Comtrade, United Nations; ITU = International Telecommunication Union Database, International Telec- сommunication Union; Net = Netcraft Secure, International Telecommunication Union; SSCT = Server Surveys Compendium of Tourism Statistics, World Tourism Organization; WFB = The World Factbook, Central Intelligence Agency; OFW = Official websites of selected basket of treaties; UNDPI = United National Development Program Indicators, United Nations. | |
Table 1b
Classification of Governance variables
|
Governance variables |
Data Source |
|
1. Institutional establishment: i) Patent applications ii) Corruption Perception Index iii) Voice and accountability iv) Political stability v) Government effectiveness vi) Regulatory quality vii) Rule of law viii) Control of corruption ix) Property right protection x) Regulatory scores 2. Education and health: i) Public spending on education ii) Primary school pupil-teacher ratio iii) Total health expenditure iv) Physicians per thousand people v) Primary school enrolment 3. Quality of labor force: i) Youth unemployment ii) Labor force, children10–14 |
WDI CI AGI AGI AGI AGI AGI AGI IEF IEF
WDI WDI WDI WDI WDI
WDI WDI |
|
Notes: WDI = World Development Indicators, World Bank; CI = Corruption Index 1996–2002, Transparency House; AGI = Aggregate Governance Indicators 1996–2004, World Bank; IEF = Index of Economic Freedom, Heritage Foundation. | |
III. Methodology of Construction of Globalization Index and Governance Index
All the globalization variables and governance variables are normalized on a yearly basis (Lockwood 2004; Dreher 2006) before they are used to construct the Globalization Index and Governance Index.
Let us denote the original variable of economy i at time t as Vit. The transformed variable is:
Taking Lockwood (2004) advice, we normalize the variables on a yearly basis. The advantage is that the resulting globalization index would not be affected by the inclusion of additional years. Since the Globalization Index and Governance Index are meant to capture the interaction of globalization and governance for each individual economy, the computation of the pair indices should be on-going, therefore the ranking of an economy in the pair indices should not be changed due to the change in sample period.
Advantages of Principal Component Analysis in Index Construction
After the data are transformed, we apply the Principal Component Analysis (PCA) yearly to the indicators.
There are several advantages of using the PCA method. Since these indicators are likely to be correlated, the PCA can reduce these indicators to fewer variables which capture the maximum variation of the resulting principal components, so that the indices capture the variation as fully as possible. Furthermore, the PCA method gives data-driven weights to the indicators that form the principal components.
PCA is advantageous over the method used in Kearney's Globalization Index (2003, 2007) and World Bank's Aggregate Governance Index (2005, 2008). Kearney (2003, 2007) used simple weighted average method, while the World Bank's Aggregate Governance index (2005, 2008) used Unobserved Component Model. Both indexing methodologies have the weakness of arbitrary weightings, that is, the weightings are assigned rather than estimated and therefore involved value judgments. The Kearney (2003, 2007) assigned arbitrary weightings on each variable to form the ranking of the globalization index. Explicitly, in the 2007 AT Kearney Globalization Index, the author assigned triple weightings on FDI, double weightings on trade, and single weightings on other variables, and equal weightings on each sub-component (Kearney 2007). Those weightings reflected the relative importance of each indicator from the viewpoint of the author. The World Bank's method involves value judgments on whether an indicator is ‘representative’ or ‘non-representative’ when they apply the unobserved component model, and the calculations on these two groups of indicators are different (Kauffman, Kraay, and Mastruzzi 2008). The weakness of World Bank's method is that it also involves value judgments, which can be different from respective of the researchers. PCA generates weightings that are data-driven, and therefore there is no value judgment involved.
Construction of the Indices by Principal Component Analysis
The latent variable model postulates that, in the case of Globalization Index (Glob), the Glob is linearly dependent on the set of transformed globalization variables (V) set out in Table 1a and an error term (Rencher 2002), namely:
![]()
where V1, …, VΨ is set of Ψ factors that are used to capture the externality of an economy. The following procedure is used to compute the principal components (PCs):

where α11, α12, …, α1Ψ are elements of eigenvector α1 = { α11, …, α1Ψ}, and there are a total of L eigenvectors, which are determined by the dataset. A total of L principal components are computed using successive eigenvectors elements, α1, α2, …, αL;, corresponding to the largest L eigenvalues, λ1 > λ2 > … > λL, of the factor correlation matrix. The first principal component, PC1, of the linear combination with maximal variance becomes our Glob, which is then normalized by the following procedure:

The scaled Glob will take a value of unity when an economy has the highest degree of globalization in the sample in the year.
These procedures are similarly applied to the construction of the Governance Index (Govn).
In constructing the two indicators, the missing values in the country series are replaced by the means of the two nearby data points1. Different weightings are generated from a corresponding principal component analysis for countries that an entire series of a variable is missing.
We apply the PCA to each individual year instead of applying one PCA to the whole sample period. This avoids a sudden change in the indicators of a particular year affecting the rest of years in the sample. The methodology we use is an improvement on those used in Dreher (2002), Anderson and Herbertsson (2005) and Heshmati (2006).
Dreher (2002) used weightings of principal component analysis generated from year 2000 for the calculation of indices for each single year from 1970 to 2000. The principal component analysis is meant to give weightings that maximize the variance of the indices, but if weightings generated in 2000 are used for indicators of all preceding years, the maximum variance effect is lost and ranking in the indicators would not reflect the underlying ranking of the year. Our method that apply PCA to each year generates the yearly factor scores that maximized the variance of the indices avoids the problem arises from the method of Dreher (2002).
Andersen and Herbertsson (2005) and Heshmati (2006) used a single principal component analysis for all the data in their sample period of 1979–2000 and 1995–2000 respectively, and they provided rankings of economies according to the factor scores for each year generated by pooling the years over the sample period. However, taking Lockwood's (2004) suggestion on normalization, the problem in the Anderson and Herbertsson (2005) and Heshmati (2006) methodology is that the change in the ranking of one economy in a specific year would change the rankings of other economies over the whole sample period. To improve on this weakness, we apply the PCA to each individual year instead of applying one PCA to the whole sample period. This avoids a sudden change in the indicators of a particular year affecting the rest of years in the sample that arises from the methods in Anderson and Herbertsson (2005) and Heshmati (2006). And this also avoids the same problem when the sample period grows from time to time.
IV. Empirical result
Table 2 gives the five-year (1998–2002) average of the Globalization Index and Governance Index. The ranking based on the five-year average shows that the top 10 economies in the two indices are mainly advanced economies in North America and Western Europe. Singapore is the only Asian economy that scored a position in the top 10. Most of the remaining European Union economies are included when the scores are extended to the top 20. Hong Kong is the other Asian economy that is included in the top 20 of the two indices.
Table 2
Globalization Index and Governance Index
|
(62 World Economies, 1998-2002 Average) | ||||
|
Ranking |
Globalization Index |
Governance Index | ||
|
Economies |
Index |
Economies |
Index | |
|
1 |
2 |
3 |
4 |
5 |
|
1 2 3 4 5 6 7 8 9 10 11 12 13 14 15 16 17 18 19 20 21 22 23 24 25 26 27 28 29 30 31 32 33 34 35 36 37 |
Ireland United States Netherlands Switzerland Sweden Finland Singapore Denmark Austria United Kingdom Canada New Zealand Australia Norway Germany France Hong Kong Portugal Spain Italy Czech Republic Israel Slovenia Hungary Slovak Republic Japan Malaysia Panama Greece Poland Korea Croatia Argentina Chile Philippine Brazil Russian Federation |
1.00 0.70 0.72 0.65 0.65 0.62 0.64 0.61 0.60 0.60 0.60 0.56 0.50 0.48 0.49 0.48 0.47 0.40 0.38 0.37 0.35 0.32 0.30 0.27 0.28 0.27 0.26 0.25 0.24 0.23 0.23 0.20 0.19 0.17 0.16 0.15 0.15 |
Sweden Switzerland Finland Denmark United States Norway Canada Germany Singapore Netherlands New Zealand Austria United Kingdom Australia Ireland Spain France Japan Portugal Hong Kong Slovenia Italy Israel Czech Republic Hungary Malaysia Chile Greece Poland Saudi Arabic Tunisia Korea Panama Slovak Republic Argentina Morocco Botswana |
0.93 0.91 0.90 0.93 0.89 0.87 0.88 0.88 0.86 0.84 0.83 0.86 0.84 0.85 0.80 0.74 0.73 0.73 0.72 0.71 0.71 0.70 0.66 0.63 0.63 0.53 0.60 0.59 0.56 0.52 0.48 0.48 0.47 0.47 0.44 0.41 0.43 |
|
1 |
2 |
3 |
4 |
5 |
|
38 39 40 41 42 43 44 45 46 47 48 49 50 51 52 53 54 55 56 57 58 59 60 61 62 |
Thailand Mexico China Turkey Romania South Africa Indonesia Ukraine Botswana India Tunisia Colombia Peru Senegal Venezuela Nigeria Egypt Kenya Morocco Pakistan Sri Lanka Uganda Saudi Arabic Iran Bangladesh |
0.15 0.14 0.14 0.13 0.13 0.14 0.12 0.12 0.10 0.11 0.11 0.10 0.08 0.08 0.07 0.07 0.07 0.06 0.05 0.05 0.04 0.04 0.03 0.03 0.01 |
Brazil Thailand Romania Egypt South Africa Croatia Sri Lanka Turkey Peru Mexico Venezuela Colombia Russian Philippine India Iran China Indonesia Ukraine Senegal Kenya Pakistan Uganda Bangladesh Nigeria |
0.39 0.40 0.37 0.36 0.38 0.37 0.34 0.32 0.32 0.30 0.30 0.30 0.29 0.28 0.26 0.21 0.22 0.16 0.21 0.19 0.13 0.12 0.10 0.03 0.00 |
An economy can vary considerably between the two indices. For example, Japan ranked 26th in the Globalization Index but ranked 18th in the Governance Index. Another example is Indonesia whom ranked 44th and 55th in Globalization Index and Governance Index, respectively. Table 2 shows that economically weaker economies tend to rank lower in the two indicators. In fact, all economies that ranked below 30th are developing economies.
We can also see from Figure 1 that there is a positive relationship between Globalization Index and the Governance Index. An economy that possesses higher quality of the governance tends to have higher degree of globalization.
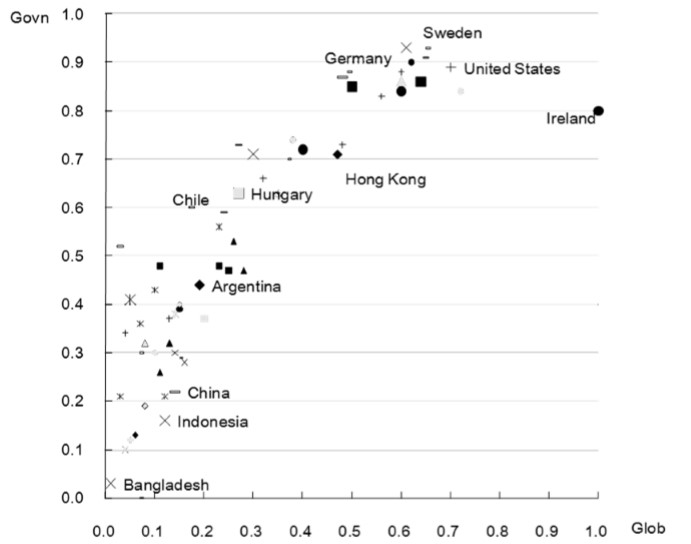
Fig. 1. Relationship Between Globalization variables and Governance variables
As shown in Figure 1, there is clearly a relationship between globalization and governance. The interaction of globalization and governance is complex. It is possible that better governance contributes higher degree of globalization and the reverse can also be true, that is, higher degree of globalization can improve governance. It is therefore important for policy makers to know their relative position of the degree of globalization as well as governance among the world economies. References can be made from economies of similar background that possess different degrees of globalization and governance when policy makers formulate policies on either globalization or governance.
V. Conclusion
This paper argues that the interaction between globalization and governance is complex, but both are essential in this globalization era. This paper advocates a new way to look at globalization by examining globalization variables and governance variables at the same time by the construction of globalization index and governance index.
In constructing the Globalization Index, this paper takes into account the pattern of trade and industries by incorporating the inter-industry and intra-industry trade, in addition to the total trade flows. On the other hand, the number of governance variables used in the analysis should provide a comprehensive picture on the domestic performance of the economies.
Both indices are constructed using the Principal Component Analysis, which do not arbitrarily assign weightings. And this paper improves on the procedure to normalize the variables such that the Principal Component Analysis are conducted to maximize the variations of the principal components in index construction.
Studying the pair indices at the same time gives policy makers better understanding of how an economy could benefit more out of globalization. The paper finds that higher quality of governance is related to higher degree of globalization. Policy makers can monitor the pair indices to formulate policies to boost growth.
NOTE
1 In the globalization index, the maximum number of missing economies in the 1998–2002 sample periods is 4, and their percentage ranged between 5.9 per cent and 11.8 per cent. For the governance index, the corresponding figures for the maximum number of missing economies are 40, and the percentage ranged between 5.9 per cent and 35.3 per cent.
REFERENCES
Andersen, T., and Herbertsson, T. 2005. Quantifying Globalization. Applied Economics 37: 1089–1098.
Balassa, B. 1965. Traded Liberalization and ‘Revealed’ Comparative Advantage. The Manchester School of Economic and Social Studies 33: 99–123.
Balassa, B. 1977. ‘Revealed’ Comparative Advantage Revisited: An Analysis of Relative Export Shares of the Industrial Countries, 1953–1971. The Manchester School of Economic and Social Studies 45: 327–344.
Balassa, B. 1979. The Changing Pattern of Comparative Advantage in Manufactured Goods. Review of Economics and Statistics 61 (2): 259–266.
Balassa, B. 1986. Comparative Advantage in Manufactured Goods: A Reappraisal. Review of Economics and Statistics 68 (2): 315–319.
Basu, S. 2003. Estimating the Quality of Economic Governance, A Cross-Country Analysis. Draft.
Bhagwati, J. 2002. Free Trade Today. Princeton: Princeton University Press.
Bhagwati, J. 2004. In Defense of Globalization. New York: Oxford University Press.
Bonaglia, F., Macedo, J. and Bussolo, M. 2001. How Globalization Improves Governance. OECD Technical Paper no. 181.
Dreher, A. 2002. Does Globalization Affect Growth? Evidence from a New Index of Globalization. Working paper.
Dreher, A. 2006. Does Globalization Affect Growth? Evidence from a new Index of Globalization. Applied Economics 38 (10): 1091–1110.
Feldstein, M. 2000. Aspects of Global Economic Integration: Outlook for the Future. National Bureau of Economic Research Working Paper 7899.
Fischer, S. 2003. Globalization and Its Challenges. Ely Lecture, American Economic Association Meeting. Washington DC, January.
Heritage Foundation 1998–2002. Index of Economic Freedom. Washington DC.
Heshmati, A. 2006. Measurement of a Multidimensional Index of Globalization. Global Economy Journal 6 (2): 1–28.
International Telecommunication Union. 1998–2002. International Telecommunication Union Database, Geneva.
International Telecommunication Union. 1998–2002. Netcraft Secure Server Surveys, Geneva.
International Monetary Fund. 1998–2002. International Financial Statistics, Washington DC.
Kauffman, D., Kraay, A., and Mistruzzi, M. 2008. Governance Matters: Aggregate and Individual Governance Indicators 1996–2007. Policy Research Working Paper 4654. The World Bank.
Kearney, A. 2005. Measuring Globalization: Economic Reversals, Forward Momentum. Washington DC: Foreign Policy.
Kearney, A. 2007. Globalization Index 2007 Methodology. URL: http://www.atkearney. com/index.php/Publications/globalization-index-data-2007.html.
Klinger, D. 2004. Globalization, Governance, and the Future of Public Administration: Can We Make Sense Out of the Fog of Rhetoric Surrounding the Terminology? Public Administration Review 64 (6): 737–743.
Lockwood, B. 2004. How Robust is the Foreign Policy-Kearney Globalisation Index? The World Economy 27: 507–523.
Rencher, A. 2002. Methods of Multivariate Analysis. 2nd ed. New York: Wiley-Interscience.
Ruffin, R. 1999. The Nature and Significance of Intra-industry Trade. Economics and Financial Review, Oct. URL: http://findarticles.com/p/articles/mi_m0DKI/is_/ai_60102 705?tag=artBody;col1; http://www.dallasfed.org/research/efr/1999/efr9904a.pdf.
Shu, X., Zhu, Y., and Zhang, Z. 2007. Global Economy and Gender Inequalities: The Case of the Urban Chinese Labor Market. Social Science Quarterly 88: 1307–1332.
Transparency House. 2003. Corruption Index 1996–2002. Washington DC.
United Nations. 1998–2002. Balance of Payments Statistics. New York: United Nations.
United Nations. 1998–2002. United Nations Development Program Indicators. New York: United Nations.
United Nations. 1998–2002. UN Comtrade. New York: United Nations.
United Nations. 2000. Globalization and Governance. We the Peoples. URL: http://www. un.org/millennium/sg/report/full.htm.
World Bank. 1998–2002. Aggregate Governance Indicators. Washington, DC: World Bank.
World Bank. 1998–2002. World Development Indicators. Washington, DC: World Bank.
World Tourism Organization. 1998–2002. Compendium of Tourism Statistics. New York: United Nations.
APPENDIX I. Calculation of inter-industry trade and intra-industry trade
Trade statistics are post-trade data that reflect the outcome of trade policies. The performance of inter-industry trade can often be seen from an economy's ‘revealed comparative advantage’ (Balassa 1965, 1977, 1979, 1986). An index of revealed comparative advantage (RCA) can be calculated as:
![]()
where Xig denotes economy i's export of commodity g, Xwg is world export of commodity g, Xi is economy i's total export and Xw is total world exports, where i=1,…,N; t=1,…,T; and g=1,…,G. When an economy's value of RCAit,g exceeds unity, that economy is said to have a revealed comparative advantage in good g at time t. The total number of export industries with revealed comparative advantage that exceeded unity in each economy are selected and normalized (NRCA) to form an indicator for an economy's performance in inter-industry trade (TRCAit):

In intra-industry trade, economies export and import the same good or service in a given period. Performance in intra-industry trade reflects more on the varieties of goods the economy enjoys due to industrial diversity and technological advancement than simply on trade flows based on comparative advantages. The extent of global economic integration through market structure and industry pattern is indicated by the level of intra-industry trade that reflected the outcome of investment by multinational enterprises, which have increasingly invested in various world economies in order to reduce cost and compete in the world market. The intra-industry trade index (IIT) can be calculated as:

where Xij,g is the export value of good g from country i to country j; Mij,g is the import value of good g to country i from country j; and nj = total number of economy i's trading partners.
This effectively is the weighted average of individual industry indices, where the weights are the shares of industries in total trade. The intra-industry trade index is compiled using the UN Comtrade Database, SITC Rev.3 (UN Comtrade, 1998–2002), for all the 62 economies with all commodities up to two-digit level.