A Quantitative Analysis of Reign Lengths of Pre- and Post-Taifa Periods and Taifa Kingdom Durations During the Existence of Al Andalus

Almanac: History & Mathematics:Investigating Past and Future
This paper will explore the disparity in the distribution of Umayyad Caliphate reign lengths with respect to the Nasrid Sultanate reign lengths. Further resolution is given to this disparity by showing that the same disparity exists between the Taifa 1 period and the Taifa 2 period. In response to the demonstration of this disparity, a hypothetical position is put forward according to which Malthusian limits on resources did not exist until at least the Taifa 2 period. Further, a preliminary computer model is constructed to show the potential for such a non-intuitive relationship between populations of entities and their upper (Malthusian) limits.
Keywords: Zipf-Pareto size-frequency distribution, self-organization, Malthusian limits, linear, non-linear.
Introduction
Science is a process by which both accepted models of the physical universe are confirmed and extended and also by which, due to contradictory data, old models are replaced by new ones. As such, in the mind of the philosopher of science, Thomas Kuhn, science experiences periods of confirmation and extension on the one hand and of rejection of currently held models on the other. Further, these periods of confirmation and extension, noted as periods of stasis by Kuhn (1970), and periods of change, noted as periods of revolution, occur within and contribute to increasing societal complexity. Both of these notions, stasis and revolution have pertinence in the following study which began as an exercise in confirmation but ending in discovery.
The late Per Bak proposed that much of, and he would have suggested all of, nature proceeds through time in fits and starts (Bak 1996), a process not unlike that described above for scientific change through time. Further, Bak proposed that the size-frequency distribution of the fits, the revolutionary or paradigm shifting periods, can be described by a simple power function size-frequency distribution, Y = aX-b, where Y = frequency, X = magnitude, and a & b are fitted constants. This power function is also known as the Zipf-Pareto function after the late Harvard social scientist George Zipf and the Italian economist, Wilfredo Pareto, both of whom noted the occurrence of this distribution in phenomena of their respective fields. This relationship holds for earthquake distributions, for the duration of businesses, for species durations and the list could be expanded ad infinitum. One can also think of this process as a representation of survivorship. The duration of businesses certainly fits this definition and with some reorganization from earthquake magnitudes to the times between those magnitudes, the distribution would also fit this pattern (for a semi-popular book on this topic see Ormerod 2005). It should then come as no surprise that such a distribution could be used as a tool of confirmation regarding size distributions and the like. In this paper, the notion of such distributions will be applied to rank-order distributions, and it will be shown that only in certain circumstances is a power function with a negative exponent an appropriate model for the distribution of rulers.
The setting for this study is the Iberian Peninsula. Peninsulas and islands offer special qualities as natural test tubes, they are both (relatively) well-defined entities. They have clearly defined geographic boundaries, come in a range of sizes, and can impose clear resource limits on the inhabitants of such places. As such, these geographies provide excellent contexts for comparative studies, both in place and over time. As an example of such an application in a not so distantly related field, biogeography, the theory of island biogeography developed mathematically by MacArthur and Wilson (1967) represents a paradigm shift in the understanding of the underlying mechanisms of biogeographic distributions. The foundation of this theory is that islands are discrete entities; by extension, peninsulas are also effectively geographically discrete. It should be noted here that the concept of island can and has been extended metaphorically to clearly defined biological units even extending down to the level of individuals being colonized by pathogens. The emphasis on peninsular discreteness has pertinence because endemic resources, especially arable land, are by default also similarly limited, i.e. Malthusian limits raise their ugly heads.
The period of time over which this study occurs is the period of time of the existence of Al Andalus, 756 CE to 1492 CE, a period of 736 years in which the Muslim rule of the Iberian Peninsula went through a series of phases from an initial phase of rule by the Umayyad Caliphate through a period of civil war and fractiousness, the Taifa period, to a geographically reduced Caliphate of Granada the existence of which formally ended in 1492 CE. It is over this period of time that the rank ordering of reign lengths and of Taifa Kingdom lengths was analyzed. (Please note that for the sake of understanding context this period of time, the entire 781 years, will be divided into pre-Taifa, Taifa, and post-Taifa periods, these corresponding to the previously mentioned Caliphate and Taifa pe-riods but having pertinence here as a taxonomy of context over which a change in reign-length distributions will be identified; this change, in the context of this study, will be shown to be quite rapid).
Methods
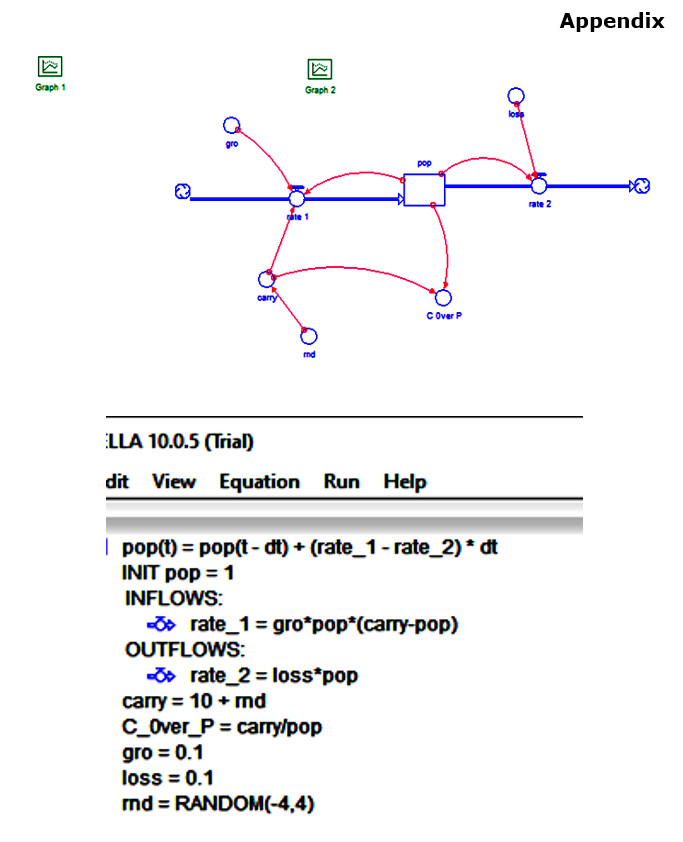
The raw data for this study were taken from Kingdoms of Faith (Catlos 2018). It should be noted here that individual reign lengths were used, as identified by specific rulers, in both the pre- and post-Taifa periods, while the duration of individual Taifa Kingdoms were used as a proxy for reign duration during the Taifa period. Note that there were three distinct Taifa periods during the years. This raw data on duration of either individual rulers or Taifa Kingdom durations was then simply ranked in order with the longest reign with a rank of 1 and succeeding reigns with lesser durations having sequentially lower (but numerically higher) ranks. These data were then plotted using the scatter plot feature of the on-line SciDAVis graphing software. Linear regressions were done using this feature of the aforementioned software, but all power function regressions were done using a TI-84+ calculator. All simulations of the effects of random changes in the magnitude of Malthusian limits on population size were done using STELLA software.
Size-frequency distributions and rank-order distributions, as they are being used in this research, are similar, as with respect to entities being ranked, if they have unique quantitative measures, they can either be binned, i.e. classed within a defined range and applicable to a size-frequency distribution, or they can be listed individually and then rank-ordered. The Taifa data were binned as a consequence of the large number of data points, while the pre-and post-Taifa data were not.
A word about the sequence is worth mentioning here. Initially, the intent was to confirm a Zipf-Pareto distribution of reign lengths. However, when the disparity between pre-Taifa and post-Taifa distributions was noted, it then became necessary to investigate the Taifa period. It created an initial problem, as there were no data immediately available of reign lengths of the rulers of all the innumerable Taifa Kingdoms. There were, however, data available on the duration of all the individual kingdoms themselves. I chose to do a rank-ordering of kingdom duration lengths for the three Taifa periods, realizing that rule length of individual rulers per se was probably linked in a direct proportion to kingdom duration length, if but not only if, the ability to access resources, area itself being one of those resources directly affected both reign lengths and kingdom duration lengths, i.e. then that these two classes of data are in fact interlinked. This is a fundamental assumption of this research.
Results
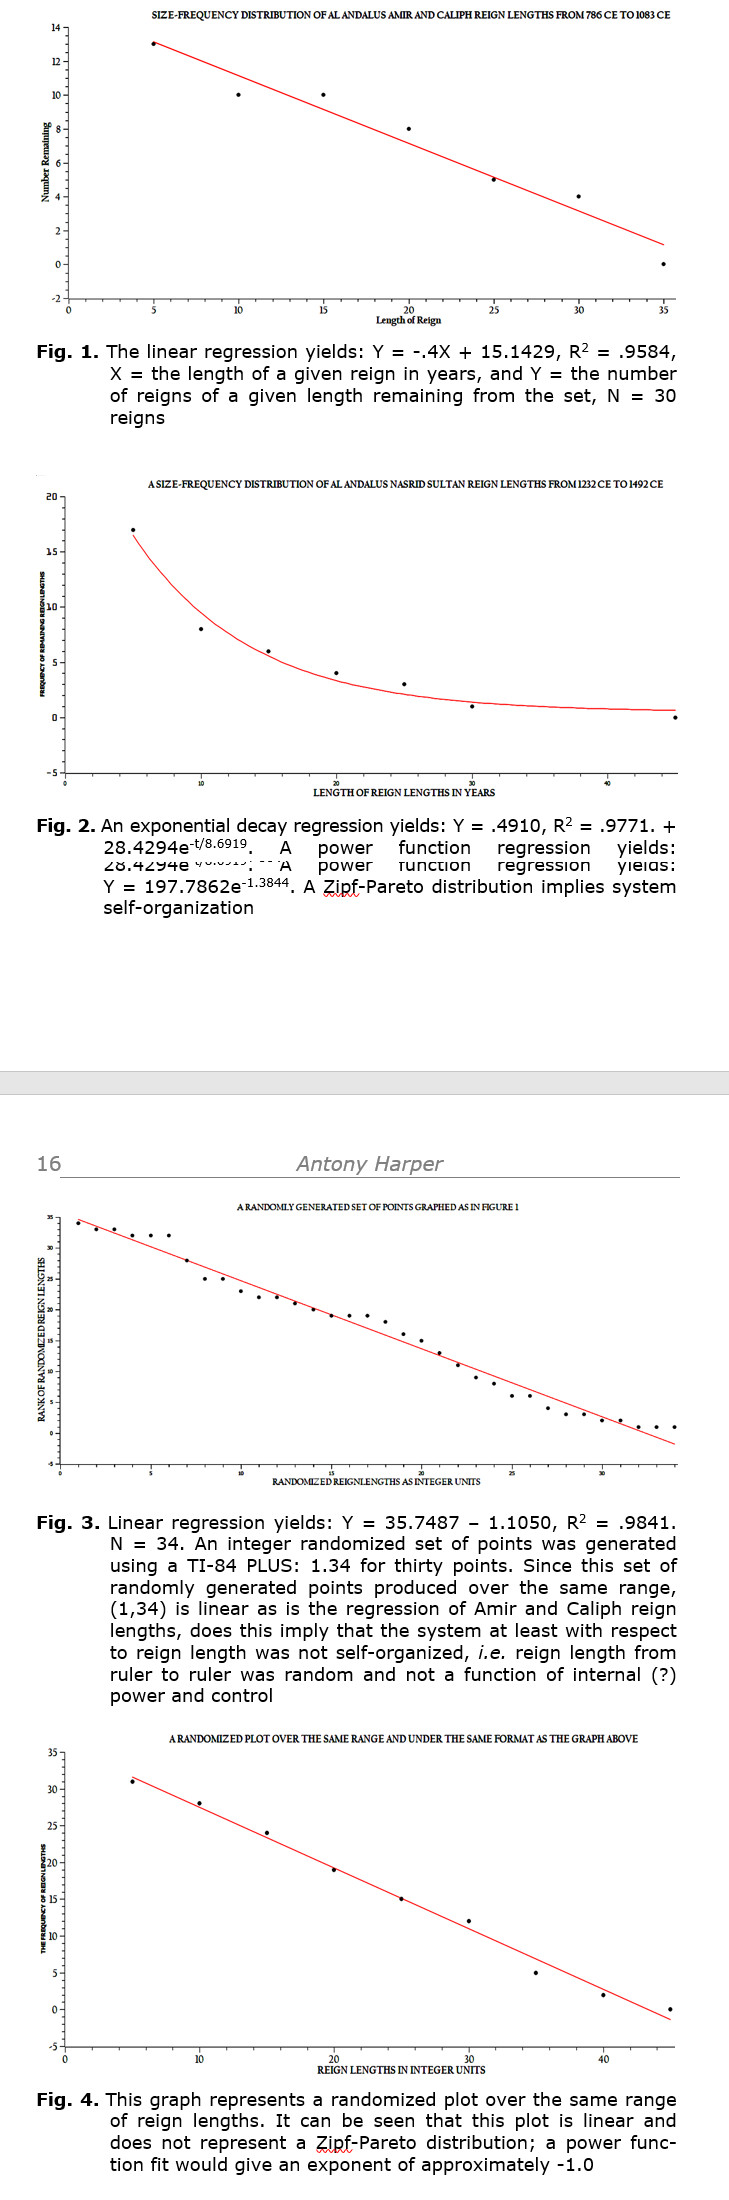
When reign lengths of pre-Taifa rulers of the Umayyad Caliphate were rank-ordered and then plotted, the following plot was yielded (see Fig. 1). However, when a similar rank-ordered data set was plotted for the post-Taifa period, the pattern of the plot was unquestionably non-linear. With regard to this linear pattern, it might be thought that the probability of a given reign length is the same as any other reign length within the range of this data; much as species survivorship in a Type II survivorship curve have a constant rate of survival. However, time series of this data will imply something quite different (see Fig. 2). These two rank-ordered distributions clearly have different patterns, a point the significance of which will be treated in the discussion. As a standard of comparison, randomized distributions of the same range of points were generated for each of the distributions represented in Figs 1 and 2 (see Fig. 3 and 4). It should be noted that, while both of the graphs in Fig. 1 and 3 are linear, the graph in Fig. 3 was produced as a random series of points generated on a TI-84+ calculator and was not collected as empirical evidence. Unquestionably both graphs represent a linear array of points having a negative slope and can be represented by the general equation for a line: Y = a – bX.
If we consider Figs 2 and 4, something quite different is apparent in a comparison of these two graphs; they are not the same. Graph two is non-linear and decreasing as the independent variable, the rank of the magnitude of reign lengths increases. The implication of this graphical pattern is that lengthy reign lengths are less frequent than shorter ones. A relationship, like this one, can be represented by the following power function: Y = aX-b. However, interestingly enough, when a random simulation over the same range of points is constructed, as displayed in Fig. 4, the rank-ordering is linear. This then is the discovery referred to in the Introduction and what its implications are will be (partially) dealt with in the Discussion section. Clearly then, the non-linear graph of rank-ordered reign lengths is a response to a historical and ecological context that the pattern in Fig. 4 was not influenced by. Some change in circumstance(s) occurred between the pre-Taifa period and the post-Taifa period. Now the Taifa period will be analysed.
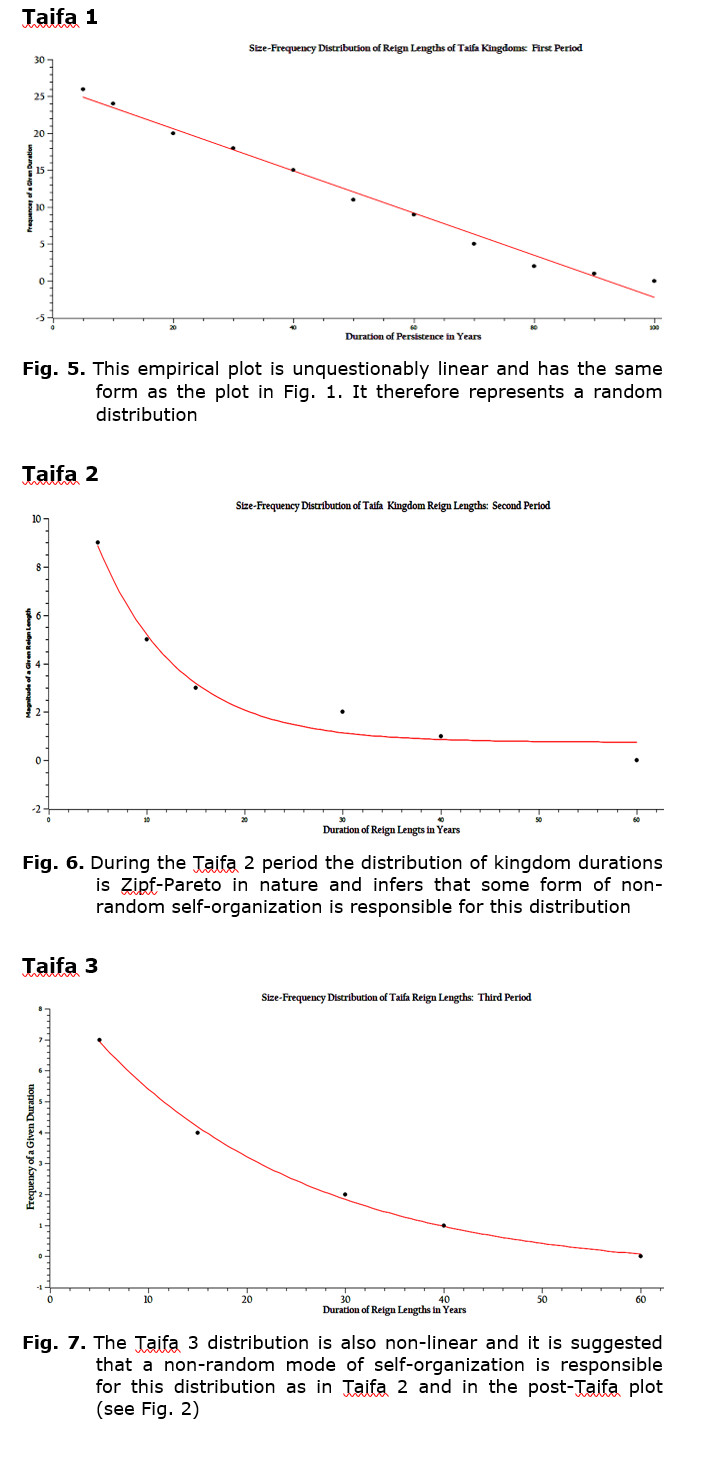
The Taifa period includes three phases of state fractionation labeled only for convenience as Taifa 1, Taifa 2, and Taifa 3. The intent here is to determine if using a similar analysis, size-frequency analysis, an event window or horizon can be identified. Figs 5, 6, and 7 represent graphs of the durations of individual Taifa Kingdoms during their respective periods.
Examination of Fig. 5, a graph of the Taifa 1 data, represents a linear distribution of kingdom durations during this time. This distribution represents a random array of points and it is consistent with the form of the pre-Taifa data represented in Fig. 1. However, Figs 6 and 7 represent non-linear distributions of the same type of size-frequency data which can be represented by power functions, not linear equations. An event horizon does not simply exist between pre-Taifa and post-Taifa periods and somewhere within the total period of time where Taifa Kingdoms existed, but has been narrowed to the time between Taifa 1 and Taifa 2.
Discussion
When this study was first begun, there was an expectation of a Zipf-Pareto power function distribution of reign lengths during both the pre- and post-Taifa periods. That was not what was observed. It was quickly discovered that the linear distribution of pre-Taifa reign lengths could be modeled or rather was similar to a randomly generated set of points over the same range of points. While the linear regressions of the randomly generated set and the empirical set of actual reign lengths are not identical in Y-intercept and slope, they share the similar form, i.e. they are both linear and both have a negative slope. It is reasonable then as an initial hypothetical assertion to assume that the empirical distribution was established randomly; but with respect to what, i.e. with respect to what context? Further, since this period of Al Andalus, lasted for nearly 300 years, reign function must have been at least minimally successful. Also, the context and constraints on the rule of Al Andalus must have been different between the two periods of rule flanking the duration of the three Taifas.
If the post-Taifa graph is now given consideration, it is becoming clear that it is non-linear and logically developed under a different set of constraints and contexts. The power function describing this distribution is: Y = 975.7403X-1.9408, and the exponential decay function produced by the plotting software gives:
Y = .9018 + 39.8253e-t/5.6258, the latter with an R2 = .9740. Both distributions are given, first to recognize the mode of analysis provided by the graphing software, SciDAVis, and second to show that the data can be represented by a power function, the characteristic function of Zipf-Pareto distributions; both functions give a reasonably good fit to the data. This poses the question, what context and constraints will produce such data distributions and were those constraints and that context in place for Taifa 2 but not Taifa 1 and prior to that, the pre-Taifa distribution. It will be preliminarily suggested here that competition between Taifa Kingdoms led to such distributions; competition suggests scarcity of resources. A further suggestion to be addressed is under what context might the pre-Taifa reigns of Al Andalus not have been subject to the sort of resource limitations of Taifa 2 onwards.
Specifically, how can competition lead to a form of self-organization that manifests itself in Zipf-Pareto distributions? Without going into detail, competition will establish a hierarchy of entities, one or a few at the top of the hierarchy, then those of intermediate success and finally those of marginal success. The distribution of this hierarchy can then be described as a size-frequency (power function) distribution. A short parenthetical note is worth making here regarding the notion of competitive exclusion as established by Gauss (1934). He suggested that the end result of competition between species was competitive exclusion, i.e. the elimination of all competitors except one. While it can be demonstrated both experimentally, by Gauss himself, and empirically (Bovbjerg 1970), competitive exclusion per se during the Taifa period may not have happened until the end of the period (if at all) when Al Andalus coalesced and operated in a much reduced territory, the reduction being caused by the expansion of northern Christian Kingdoms, for example Castille, Aragon, etc. Even then, competition was most probably a contributing factor, one among many, not the least of which was also predatory warfare.
During the pre-Taifa period a series of marchlands were established: an Upper, Middle, and Lower Marchland, each with a primary urban area. These marchlands acted as boundary buffers with respect both to incursions from hostile neighbors, in this case the Christian North, and as buffers also for reciprocal activity from Al Andalus; marchlands acted as common territory, borderland territory where combat from time to time took place. It is with respect to combat, i.e. warfare, within marchlands and the effect of that warfare on territory.
Andrey Korotayev et al. (2006) give a unique analysis of marchland function with respect to the coalescence of kingdoms into empires. They suggest that with empire formation there occurs the reduced loss of carrying capacity due to warfare, because of a scaling effect. They assume that marchland depth as a function of available technology is relatively constant and as a consequence of kingdoms occurs, the relative amount of territory required for marchlands is reduced. Simple mathematics provides a useful thinking tool on this problem:
1. For the sake of geometric simplicity, all polities are assumed to be square.
2. As previously stated, the marchland depth is at 1/3 of an arbitrary unit of length.
3. Given these conditions the following data may be generated:
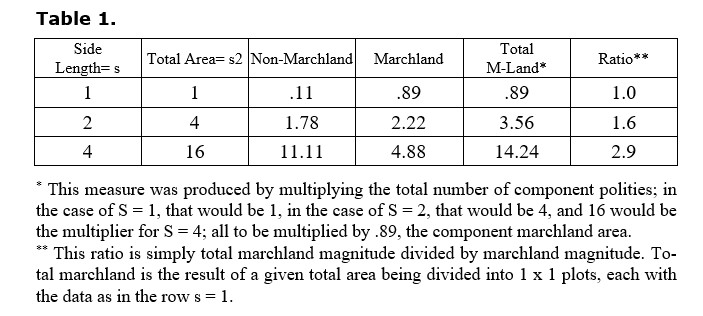
4. A power regression of Total Area versus Marchland area yields a sublinear exponent, i.e. Y ~ X.6138. This implies that as polity size increases, so does marchland size but at a slower rate, so that the total percentage of marchland decreases with increasing polity size and therefore a reduced effect on carrying capacity due to warfare will be observed.
5. If the smallest area, one unit of area, is fit into the two larger areas and the marchland area of the sum of the smaller areas is compared to the marchland area of the larger area, the ratio of these two for S = 2 and 4 is greater than 1. The implication here is two-fold; first, that the sum of the marchland areas of all the smaller units fitting into a larger unit does diminish but not as quickly as does the larger unit marchland area. In other words, the same area, when divided into smaller parcels, incurs greater cost to the carrying capacity of the occupied territory than if the territory were a single, larger polity. Secondly, if a larger polity were to fragment, then the resulting smaller polities would not be able to support the populace that the larger one did, as there would be great restriction on the carrying capacity in toto.
Where does this leave us with respect to the fractionalizations of pre-Taifa Al Andalus leading to the Taifa period, and how, if in any way, does this help in explaining the linear and therefore random distribution of reign lengths during the pre-Taifa period and kingdom durations during the first Taifa period? It would help to be able to show that certainly during the pre-Taifa period the population was never at carrying capacity and further that this was a function of perturbations affecting the carrying capacity size. A model of such a condition will be presented shortly showing that this is at least possible; empirical evidence is lacking at present. Further, resource limitations causing the Malthusian ceiling appear first to show up during the initial portion of the second Taifa period. Fewer Taifa Kingdoms are extant during the second and third Taifa periods; this is surely a function of Christian incursion from the North. Marchlands were eliminated during Taifa 1 and were never to be established (to the extent of their Pre-Taifa magnitude) again. By the time of the Nasrid Sultans what remained of Al Andalus was concentrated in the Kingdom of Granada, which surely must have been a resource limited condition.
For complete transparency, Andrey Korotayev suggested in a recent personal communication in 2020, on hearing of the hypothetical position taken in this paper that the changes in distributions of reign lengths and Taifa Kingdom durations were due to some change in polity governance. I am not a scholar of Medieval Al Andalusian Iberia and cannot comment on Andrey's very important suggestion; I can only say that Andrey's suggestion has merit and should be investigated.
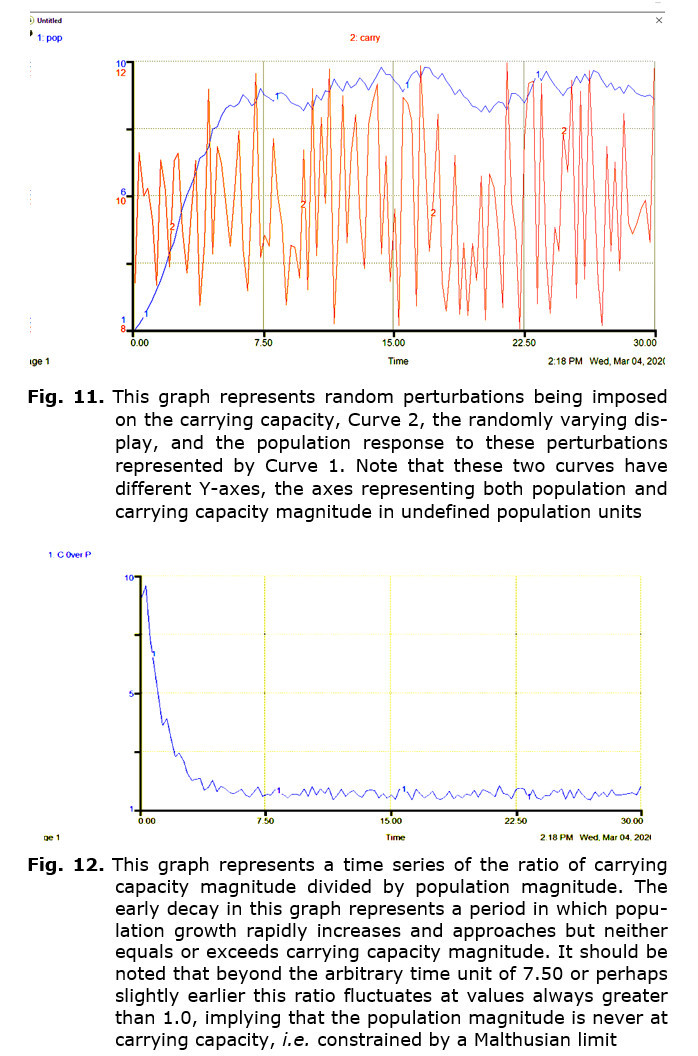
Now circumstances must be introduced which cause conditions in which resources per se are not limiting. This will be done by creating a computer model in which random perturbations of the carrying capacity are added to an otherwise standard model of the logistics equation, all done using STELLA software.
Examination of Fig. 11 will show that the carrying capacity fluctuates randomly and the population responds randomly. Note that neither display is smooth and that both curves mirror each other. A clearly sigmoid character of the early population curve is to be expected, however, there is no constant, stable condition that the population converges to; it responds to the oscillations of the carrying capacity. Further, if the scales of the Y-axis are considered, the magnitude of the population never exceeds that of the carrying capacity. This can be seen more clearly by considering the graph of Fig. 12. Here a ratio of carrying capacity magnitude over population magnitude is represented, and it can be observed that the value of the ratio never falls below 1. This verifies that the perturbations, imposed by the random component of the program, maintain a carrying capacity magnitude greater than that of the population.
Now consider the effects of warfare on the marchlands and the default effect on carrying capacity of that warfare, in this instance, of Al Andalus as a whole. If warfare were to have been relatively frequent, frequent enough to prohibit complete environmental recovery from the effects of previous warfare, then it is proposed here that such a condition would always result in carrying capacity never being equaled or exceeded.
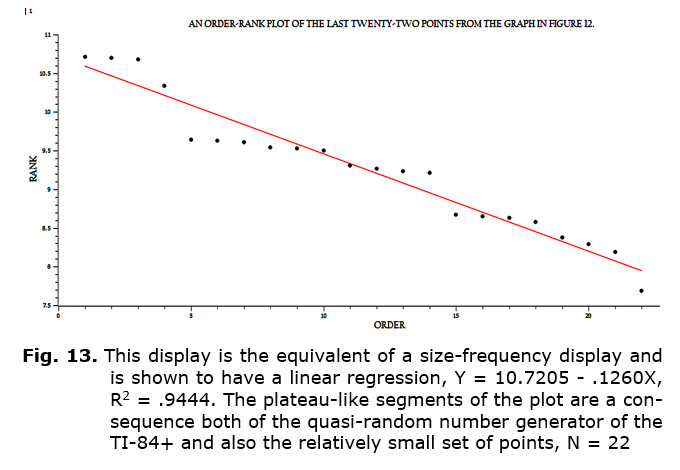
One can further note here; if the sequence of points taken from the relative plateau of points, in this case the last twenty-two points, is plotted as a size-frequency distribution (see Fig. 13), the linear regression yields a coefficient of determination of < R2 = .9444, a reasonably good fit. This implies that at least for a simulated population under the circumstances of random perturbations imposed on the carrying capacity of that population, the condition of linearity due to the absence of a Malthusian limit holds. It shows promise for more complex and, therefore, more real simulations and the potential for retrieving supporting empirical data.
Summary
1. Some of the most intriguing scientific research occurs when expectations are not met, i.e. when a given hypothesis is not supported. Such is the case with respect to the initial investigation of reign lengths of the Umayyad caliphs in Al Andalus.
2. The expectation of a power function distribution with a negative exponent was not met with respect to the distribution of Umayyad caliph reign lengths in the pre-Taifa period, circa 786 CE to 1083 CE. The ordered reign lengths from longest to shortest fit a linear distribution.
3. It is shown that such a linear distribution can be produced randomly and consequently it is not per se a product of self-organization.
4. The post-Taifa period Nasrid Sultan reign lengths, circa 1232 CE to 1492 CE, do exhibit the expected distribution, i.e. modeled by the general equation, Y = aX-b.
5. The inference of this finding is that the Taifa Periods themselves should be analyzed for evidence of this change.
6. There is a clear distinction between Taifa 1 and Taifa 2 with respect to the temporal duration of Taifa kingdoms; Taifa 1 exhibits a linear distribution, while Taifa 2 exhibits a power function distribution having a negative exponent. It isolates the transition period to the time between these two Taifa periods.
7. A hypothesis is proposed that the change from a random to a non-random distribution of reign lengths and kingdom durations is a consequence of the imposition of Malthusian limits on resource availability.
8. The role of marchland function and the conflict that occurred within that prescribed territory is considered as a buffer against Malthusian limits.
9. The model of empire formation by Korotayev et al. (2006) and its effect Summary point on environmental degradation is employed as a potential mechanism for such changes, in this instance in reverse, i.e. with the formation of Taifa Kingdoms resource limitations became a reality.
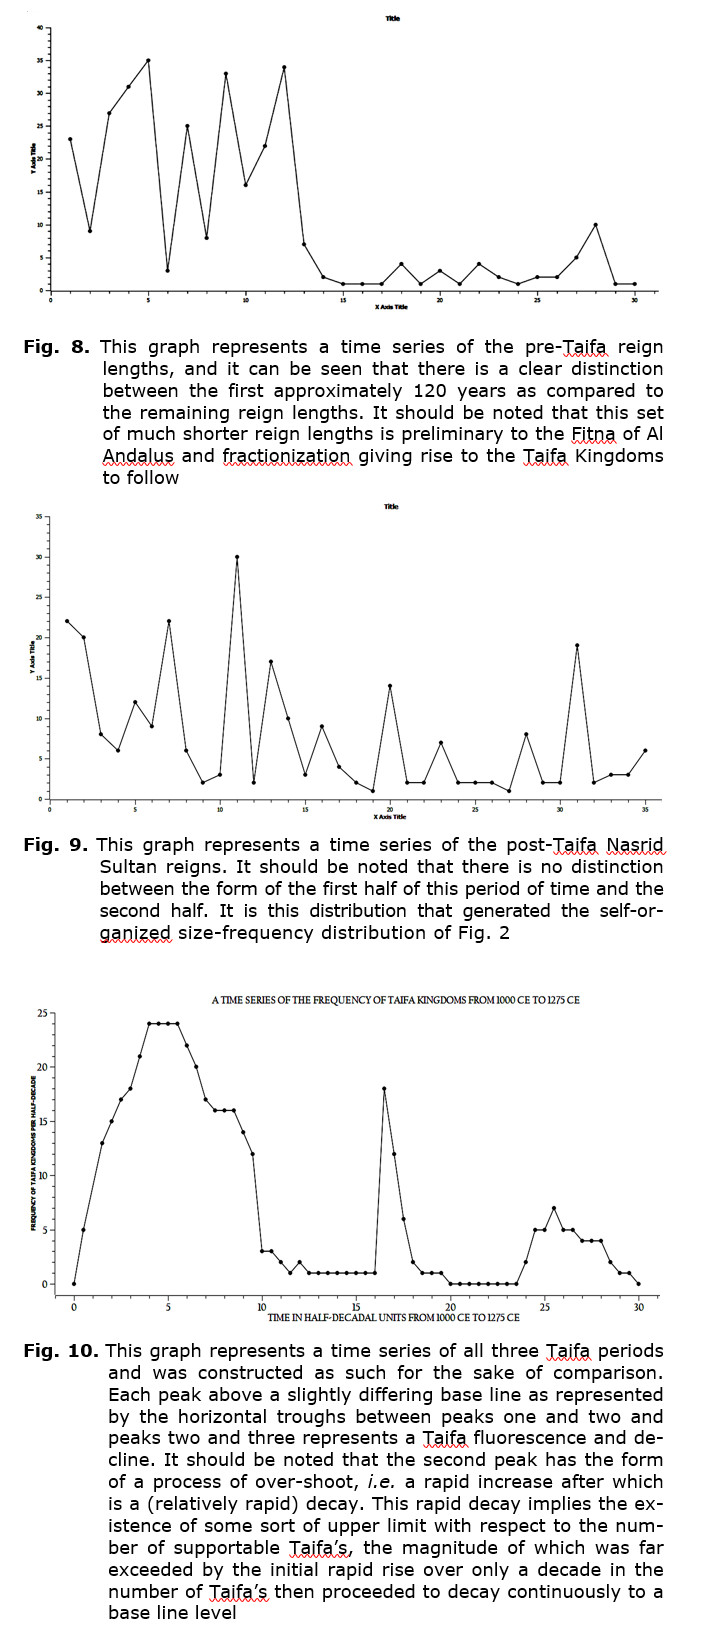
10. Inspection of the times series of Taifa Kingdoms reveals that the Taifa 2 portion of this series is similar to ecological overshoot; decay of the total of this portion of the curve occurs immediately on the curve achieving a maximum number of extant kingdoms.
11. A preliminary STELLA model of the relationship between a randomly fluctuating carrying capacity and the population response to that fluctuating carrying capacity reveals the continual existence of a sub-carrying capacity population magnitude.
12. The inference yielded by Summary point 11 suggests that perturbations to carrying capacity, in this case conflict in the marchland regions of Al Andalus, are a potential cause of the linear and random distribution of Umayyad Caliph reigns.
References
Bak P. 1996. How Nature Works: The New Science of Self-Organized Criticality. Copernicus.
Bovbjerg R. V. 1970. Ecological Isolation and Competitive Exclusion in Two Crayfish (Orconectes virilis and Orconectes immunis). Ecology 51(2): 225–236.
Catlos B. A. 2018. Kingdoms of Faith: A New History of Islamic Spain. New York. Basic Books.
Catton W. R. 1982. Overshoot: The Ecological Basis of Revolutionary Change. Champaign, IL: The University of Illinois Press.
Gauss G. 1934. The Struggle for Existence. Baltimore: Williams and Wilkins.
Korotayev A., Malkov A., and Khaltourina D. 2006. Introduction to Social Macrodynamics: Secular Cycles and Millennial Trends. Moscow: URSS. In Russian (Коротаев А., Малков А., Халтурина Д. Введение в социальную макродинамику: вековые циклы и тысячелетние тенденции. Москва: URSS).
Kuhn Th. 1970. The Structure of Scientific Revolutions. 2nd ed. Chicago: The Univeristy of Chicago Press.
MacArthur R., and Wilson E. O. 1967. Island Biogeography. Princeton: Princeton University Press.
Ormerod P. 2005. Why Most Things Fail: Evolution, Extinction, and Economics. New York: Pantheon Books.