A Toy Model Mechanism for Greater-Than-Exponential Human Population Growth

Almanac: History & Mathematics:Big History Aspects
Abstract
The term, exponential, has long been associated with the growth of organismal populations from microbial populations to the populations of complex multicellular eukaryotes. It can be shown, however, that human population growth occurs at greater-than-exponential rates. Von Foerster et al. (1960) but followed more elegantly by Korotayev et al. (2006a), have proposed models to more accurately represent this characteristic mode of human population growth. In this paper an underlying mechanism is proposed which generates this greater-than-exponential growth. The mechanism is represented by a toy model of two differential equations of interacting populations, the interactions of which enhance the reproductive abilities of the other population. The end result of this enhancement due to positive human interaction, a quintessential characteristic of our species, is a pattern of growth motivated by a greater-than-exponential rate of growth. It should be noted that the model being proposed is one of many potential models and not the sole, the only, possible model.
Introduction
In 1960 von Foerster et al. proposed a model of global population growth in which the form of the growth was greater than exponential. Korotayev, Malkov, and Khaltourina (2006a, 2006b) expanded on this model and showed clearly that the form of what they named hyperbolic growth fit the data of human population growth over the past ten thousand years quite well. Specifically, the integral form of the equation, dN/dt = aN2, gives Nt = a/(t0 – tn), where a is a fitted constant, tn represents some time before t0, and t0 represents what von Foerster et al. called Doom's Day, the time at which, to use a very appropriate Russian phrase, the population enters its ‘blow-up’ phase, i.e. hyperbolic growth reaches a critical point in finite time. Note also that a hyperbolic growth model is also recognized as a valid fit for human population data by Joel Cohen in his book How Many People Can the Earth Support? (Cohen 1995).
In light of the fact that Korotayev et al. (2006a, 2006b) have shown how important this form of growth, labeled hyperbolic growth, is to understanding human demography over time, it will be important to begin to understand the mechanism behind such growth. It should be noted here that Korotayev et al. (Ibid.) have shown that this form of growth applies over both short- and long-term views of human population change ranging from a period of ten thousand years to much shorter periods of a few hundred years. Interestingly, if growth form does not change with time scale, an implication of such growth is that it is (probably) scale-free in context. This form of growth also manifests itself above the population level of biological organization (Markov and Korotayev 2007). However, that will not be the focus of this short paper.
The focus of this paper is to present a mechanism for the type of population behavior giving rise to the blow-up phase or regime, or stated another way, to give rise to greater-than-exponential growth (GTEG). (The acronym, GTEG, will be used throughout this paper to represent all patterns of population growth that are greater than exponential growth including but not limited to bi-exponential and hyperbolic growth.) Exponential growth will be compared to GTEG, and it will be shown that while the growth of most animal populations can be represented by exponential growth, human population growth cannot and cannot because of a quintessentially human characteristic, that of human interaction which occurs at a much higher level than the interaction between members of other animal species. Specifically, the toy model will be used to show that total population growth within a set of interacting sub-populations is greater than total growth that is the sum of non-interacting sub-populations.
Alternative Models of Population Growth
Exponential population growth is recognized as a basic form of growth exhibited by a variety of organisms (e.g., Hutchinson 1978; Gotelli 2001). As noted previously, exponential population growth is given by the integral solution to the differential equation, dN/dt = rN, which yields, Nt = N0ert, with N0 = the initial size of the population, Nt = the size of the population at some future point in time, t, and r = a fitted constant which is the growth rate of the population. The log-transform of this equation is: ln Nt = lnN0 + rt. It should be noted that the form of this equation is linear, and therefore raw data plotted either on semi-log graph paper or log-transformed population data plotted against time must give a straight line plot.
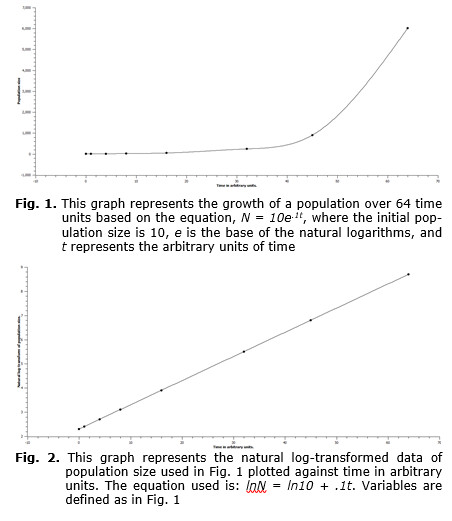
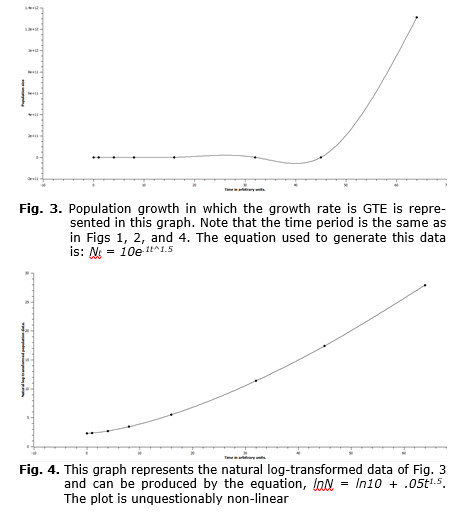
Both exponential growth and the log-transform of exponential growth are represented in the following graphs. In Fig. 1 one can see that the graph turns sharply upward and would continue to grow in that fashion if time units greater than 64 were used. In Fig. 2 the log-transformed population data are plotted against the same set of time values. Here the plot is linear, and this form is representative of all exponential growth models that are log-transformed. So, any log-transform of population data yielding a linear plot represents a log-transformation of data of an exponentially growing population. This would not be the case of population data of GTEG populations. In this case the log-transformation of the data would yield a curve similar in shape to the un-transformed exponential data. In Fig. 3 the raw data of a population growing at GTEG are represented, and in Fig. 4 the natural log-transformed data are plotted over the same time period.
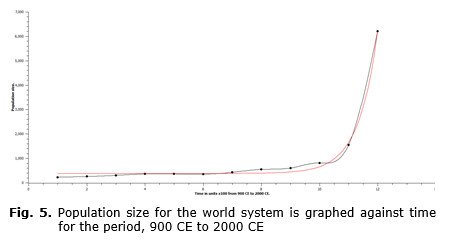
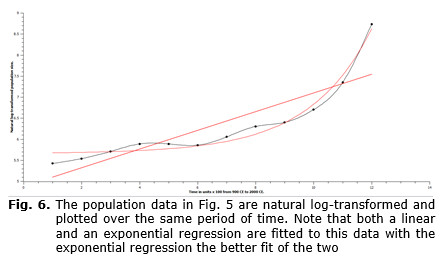
Using the previously defined types of growth, either exponential growth or GTEG, the data on population size over time for the world-system in toto can be evaluated to determine which of these two models more realistically represents the pattern of growth of an actual human population. In Figs 5 and 6 data for the world-system population from 800 CE through 2000 CE are plotted either as unaltered population size (see Fig. 5), or as natural log-transformed population size (see Fig. 6), in which both sets of data are plotted against time. Fig. 5 superficially resembles the curves represented in both Fig. 1 and Fig. 3. So, simply on visual inspection, it would be difficult to determine which of the two curves more appropriately matched that of Fig. 5. However, even casual inspection of the graph in Fig. 6 unquestionably shows that the log-transformed population data are not linear. In Fig. 6 both a linear and an exponential fit are represented, and even without the aid of formal statistical analysis, the exponential curve can be seen to be a much better fit. This implies that the rate of growth of the world-system population is GTEG. Interestingly, if the populations of other organisms are assessed, they are found to be exponential, so, what is there about the mechanism of human population growth that produces a GTEG pattern? This question will be addressed in the following section.
A Toy Model Mechanism for GTEG
Based on the information of the previous section a generalized equation representing GTEG has the form, Nt = Aet^b, and the question then becomes: What is the reality of the exponent, b, of the exponent, t or time? Why is it that animal populations other than human can be represented more simply by the equation, Nt = Aet? Clearly, the log-transform of both equations gives, ln Nt = lnA + t and ln Nt = lnA + tb respectively. The first transformed equation is linear, while the second one is exponential, and we need to consider what it is about humanity that gives the exponent of the exponent, b, its reality.
Humans are more closely connected with each other both locally and at distance, and I wish to propose that it is this higher level of interaction that is ultimately responsible for GTEG. Consider this simple model of interaction between two rural communities. One community is primarily devoted to farming, actually producing food for human consumption, while the second community is devoted to producing farming equipment. If both communities interact then the farming community with the aid of farming equipment, for example tractors, reapers, etc., will produce food for both communities, while the second community will, as noted, supply the first with farm equipment. This synergism will aid both communities, and without it, both communities will have to both produce their own farm equipment and raise their own food.
Mathematically with respect to population growth, the following set of differential equations is analogous to the synergism described in the previous pa-ragraph:
dN1/dt = (r1 + aN2)N1, (Eq. 1)
and dN2/dt = (r2 + bN1)N2, (Eq. 2)
where r1 and r2 are the growth rates of the respective populations, N1 and N2, and a and b are constants representing the degree of synergism between N1 and N2. As can be seen, the growth factor for each population includes their own rate of growth and a positive contribution from the other population, either aN2 or bN1. The contributions of each population to the other's growth is represented as a linear contribution only because linearity represents the simplest case. With further research into real cases, the component that each population gives to the other may in fact be non-linear, however, the focus of this paper is to provide a possible simple mechanism by which GTEG can be produced by synergism between populations and do so as simply as possible. Without this synergism, the above equations would simply represent exponential growth and would have the form: dN1/dt = r1N1, and dN2/dt = r2N2. But, what is the actual reality that the above coupled equations will produce GTEG?
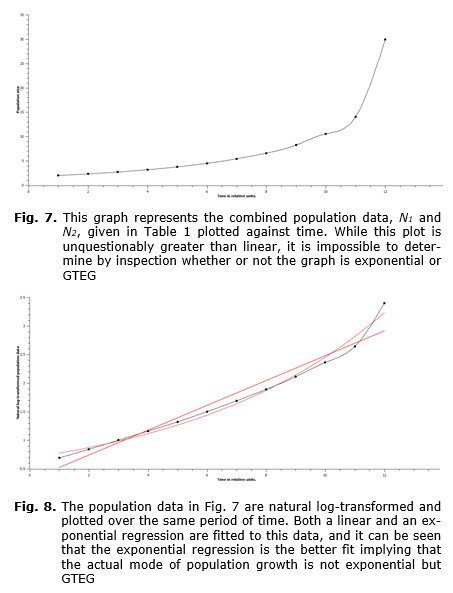
Inspection of the set of differential equations shows that the growth component of each equation, r + xN, contains a constant component, r, and a component that is not constant but increases. More explicitly, this component is xN, where x is a constant and N grows at least at a rate, dN/dt = rN, which on solution gives, Nt = N0ert. In other words, this component grows at least exponentially, and therefore the growth of the rate at which this population grows is at least exponential. However, since the contributing population is also growing at GTEG due to the contributions of the first population, then the first population must also grow at GTEG and vice versa. This can be shown numerically using the simulated data in Table 1. By graphing the data of the summed populations from the table, a graph of population over time is produced (see Fig. 7). If these same data are natural log-transformed, then if the growth is exponential a linear plot should be expected, while if the growth is GTEG, then a curve representing exponential growth of the growth rate should be expected. It is the latter type of graph that is produced, so the growth is GTEG and is due to the interaction components of the equations, i.e. the xN component of the growth component, r + xN. It should be noted here that without the xN components in each of the coupled differential equations, these differential equations would have the form, dN/dt = rN, which would, of course, yield exponential growth and not GTEG.
Table 1.
|
TIME |
1 |
2 |
3 |
4 |
5 |
6 |
7 |
8 |
9 |
10 |
11 |
12 |
|
N1 |
1 |
1.15 |
1.33 |
1.55 |
1.83 |
2.19 |
2.66 |
3.23 |
4.10 |
5.36 |
7.29 |
16.34 |
|
N2 |
1 |
1.17 |
1.38 |
1.63 |
1.93 |
2.30 |
2.77 |
3.36 |
4.14 |
5.20 |
6.74 |
13.57 |
|
N1 & N2 |
2 |
2.32 |
2.71 |
3.18 |
3.76 |
4.49 |
5.43 |
6.59 |
8.24 |
10.56 |
14.03 |
29.91 |
|
Ln N1 & N2 |
.69 |
.84 |
1.00 |
1.16 |
1.32 |
1.50 |
1.69 |
1.89 |
2.11 |
2.36 |
2.64 |
3.40 |
Summary
1. Von Foerster et al. (1960) and Korotayev et al. (2006a) have shown that human populations grow at a rate greater than exponential.
2. Exponential growth increases at a constant rate, and as a consequence the log-transformed population data give a linear plot against time.
3. Greater-than-exponential growth (GTEG) yields a curved plot in which the growth rate increases with increasing size of the population.
4. Real world-system data when log-transformed yield as expected an exponential curve.
5. A mechanism is proposed by which human interaction between groups yields GTEG.
6. This mechanism in its simplest form is represented by the following two differential equations: dN1/dt = (r1 + aN2)N1, and dN2/dt = (r2 + bN1)N2.
7. It is shown by numerical simulation that the combined growth of the populations represented by these two equations gives GTEG, suggesting that these coupled equations represent a model for human population growth.
References
Cohen J. 1995. How Many People can the Earth Support? New York: Norton.
Foerster H. von, Mora P., and Amiot L. M. 1960. Doomsday, Friday 13, November, 2026. Science 132: 1291–1295.
Gotelli N. J. 2001. A Primer of Ecology. Sunderland, MA: Sinauer Press.
Hutchinson G. E. 1978. An Introduction to Population Ecology. New Haven: Yale University Press.
Korotayev A., Malkov A., and Khaltourina D. 2006a. Introduction to Social Macrodynamics: Compact Macromodels of the World System Growth. Moscow: Uchitel.
Korotayev A., Malkov A., and Khaltourina D. 2006b. Introduction to Social Macrodynamics: Secular Cycles and Millennial Trends. Moscow: Uchitel.
Markov A. V., and Korotayev A. V. 2007. Phanerozoic Marine Biodiversity Follows
a Hyperbolic Trend. Paleoworld 16(4): 311–318.