Cycling in the Complexity of Early Societies

Almanac: History & Mathematics:Trends and Cycles
Abstract
Warfare is commonly viewed as a driving force of the process of aggregation of initially independent villages into larger and more complex political units that started several thousand years ago and quickly led to the appearance of chiefdoms, states, and empires. Here we build on extensions and generalizations of Carneiro's (1970) argument to develop a spatially explicit agent-based model of the emergence of early complex societies via warfare. In our model polities are represented as hierarchically structured networks of villages whose size, power, and complexity change as a result of conquest, secession, internal reorganization (via promotion and linearization), and resource dynamics. A general prediction of our model is continuous stochastic cycling in which the growth of individual polities in size, wealth/power, and complexity is interrupted by their quick collapse. The model dynamics are mostly controlled by two parameters, one of which scales the relative advantage of wealthier polities in between- and within-polity conflicts, and the other is the chief's expected time in power. Our results demonstrate that the stability of large and complex polities is strongly promoted if the outcomes of the conflicts are mostly determined by the polities' wealth/power, if there exist well-defined and accepted means of succession, and if control mechanisms are internally specialized.
Keywords: modeling, warfare, state, territory, rebellion.
Introduction
For most of humanity's existence people lived in small egalitarian bands or villages that were politically autonomous. However, a qualitative change happened roughly 10,000 years ago when villages began aggregating into larger and more complex, hierarchically-structured polities (a general term that includes not only states and empires but also smaller-scale independent political units, such as chiefdoms, acephalous tribes, and autonomous villages, see, e.g., Ferguson and Mansbach 1996). This process of aggregation first took place in Mesopotamia, East Asia, South America, and Mesoamerica, followed by secondary developments elsewhere (Service 1975). The process of aggregation led, over time, to the emergence of chiefdoms, states, and empires. Once established, these complex societies rose and fell over time, with centers of power and authority shifting from one location to another over the landscape, a process that has been described as cycling (Wright 1977, 1984; Cordy 1981; Kirch 1984; Marcus 1992, 1998; Anderson 1994, 1996; Earle 1997; Cioffi-Revilla and Landman 1999; Junker 1999; Hall 2001). The causes of this process have fascinated scholars and been the subject of speculation for centuries (Engels 1884; Lenin 1918; Childe 1950; Wittfogel 1957; Adams 1966; Fried 1967; Flannery 1972; Webster 1975; Wright 1977, 1984, 1986; Service 1975, 1978; Ferguson and Mansbach 1996; Earle 1997; Trigger 2003; Cioffi-Revilla 2005; Drennan and Peterson 2006; Turchin and Gavrilets 2009; Spencer 2010).
Here we are concerned with a set of influential theories that put special emphasis on warfare between different polities (starting with villages). When warfare first occurred in human (pre)history is controversial, although it is assumed to have been relatively small in scale and consequence until complex and presumably multicommunity societies emerged (Ferguson 1984; Haas 2004; Trigger 2003; but see Keeley 1997; Cioffi-Revilla 2000). Besides warfare, there are of course a number of additional prerequisites for the evolution of social complexity. One requirement, emphasized by Carneiro, is circumscription (environmental, due to the resource concentration, or social, due to the presence of other human groups nearby; see Carneiro 1970, 1981). Circumscription was the factor that precluded losing communities from moving away and thus separating themselves spatially and politically from victors. Other prerequisites include existence of agricultural potential capable of generating surpluses and significant variation in productive and/or demographic potential among local communities (Webster 1975). Equally important was ability to delegate power and the invention of hierarchically structured control mechanisms in which each superior directly controlled only a limited number of subordinates (Flannery 1972; Wright 1977, 1984; Turchin and Gavrilets 2009). The latter was also important for the subsequent growth of polities given what has been called ‘scalar stress’, a decrease in the ability of leaders to process information and maintain efficient control over subordinates as their number (herein, the number of subordinate villages) increased (Johnson 1982). The outcome of these processes and factors was the emergence of simple chiefdoms (Steponaitis 1978, 1981; Wright 1984) in which one village controlled (and received tribute from) several subordinate villages. More complex polities were characterized by greater numbers of subordinate levels, with complex chiefdoms, paramount chiefdoms, and state societies typically defined as those polities with two, three, and four or more administrative levels above the local or primary community, respectively (Flannery 1972; Wright and Johnson 1975; Steponaitis 1978; Wright 1984; Anderson 1994).
The paramount chief delegated power over a subset of his villages to somebody else (a subchief), often a relative (e.g., Cordy 1981). Sometimes the chiefs of vanquished groups were permitted to stay in power but had to pay tribute (e.g., Kurella 1998). The hierarchical nature of this organizing principle allows, in theory, for unlimited growth in the size and complexity of chiefdoms. However, in early chiefdoms, constituent communities could exist autonomously. Moreover, in these societies control was vested in one or a few individuals, and such absence of internal specialization meant that subchiefs had almost total control over their subordinate villages (Wright 1977, 1984; Earle 1987). Therefore rebellion and secession by subchiefs had a low cost and was relatively easy to organize, although not always successfully accomplished. As a result, the growth in the size and complexity of chiefdoms was counterbalanced by a tendency to fragment through rebellion and secession.
Although the argument just given is well accepted by anthropologists, historians, and political scientists, many questions remain. These concern the levels of complexity that can be achieved, its dynamic patterns and timescales, and the qualitative and quantitative effects of various parameters and factors. Here we use a stochastic spatially-explicit agent-based mathematical model to shed light on these questions. The analyses that follow encompass developments over large geographic and extended temporal scales, the processes that cause chiefdoms, states, and empires to emerge, persist, and collapse at the scale of decades to centuries, the longue durée of human history. Our approach is a generalizing one, sacrificing specific detail for a glimpse of the reasons behind the broad patterns recorded by archaeology and history. At the same time, however, our modeling approach aims to connect these broad processes to the finer scale historical events generating those patterns under examination.
Until recently there has been only a limited amount of modeling work directly addressing the evolution of large-scale polities (Dacey 1969, 1974; Bremer and Mihalka 1977; Cusack and Stoll 1990; Cederman 1997; Spencer 1998; Cioffi-Revilla 2005; Cederman and Girardin 2010). Most of this work has focused exclusively on polity size, was limited to a small number of simulation runs, and was primarily motivated by questions of interest to political scientists. Here, we build on earlier approaches by presenting a dynamic quantitative model exploring the origin and operation of early human complex society, focusing on both the size and complexity of emerging polities as well as their longevity and settlement patterns. We systematically examine the effect of parameters such as system size, the effect of polity power on the probability of winning a conflict, tribute level, variation in productivity between individual villages, span of control, and chief's average time in power. The polities in our model exhibit a strikingly fluid nature resembling so-called ‘chiefly cycles’. Unexpectedly, the largest effect on results is due to just two parameters: the scaling of the polity power to the probability of winning a conflict, and the chief's average time in power. At the end of the paper we discuss the implications of our results and some relevant empirical evidence. Some preliminary results of our model were presented in Turchin and Gavrilets (2009).
The Model
Here we describe the model informally; readers interested in the mathematical details will find them in the Mathematical Appendix. We consider a hexagonal array of initially autonomous local communities (villages), consistent with earlier hex-based models (e.g., Cusack and Stoll 1990; Bremer and Mihalka 1977). Each community is represented by a hexagon and has up to six neighbors (Haggett 1965), reflecting a more natural modeling abstraction than square cells. Time is discrete and the unit of time (‘year’) is the expected interval between two consecutive ‘decisions’ made by a community (explained below). Each community i is characterized by a constant base-line resource level f0,i which can be interpreted as a measure of the settlement's catchment size (Steponaitis 1981). The values f0,i are chosen randomly and independently from a (truncated) normal distribution with mean 1 and constant standard deviation σ. Parameter σ represents variation in productive/demographic potential between local communities due to environmental heterogeneity. Each community is also characterized by its actual resource level fi. Initially, for each community the actual resource level is set at the base-line level (i.e., fi = f0,i), but different actions in which the community takes part change its value (explained below).
Each community is a part of a polity (which can consist of a single community). The polities have a hierarchical structure. Each community in a polity except for the one at the top of the hierarchy (the ‘chief community’) has one superior community and may have up to L subordinate communities, where L is a constant parameter measuring the maximum span of control (i.e. the maximum number of subordinates; see Johnson 1982). Each polity is identified by its chief community (see Fig. 1). Each subordinate community pays tribute by transferring a fixed proportion θ of its total resources to its superior. The total resources of a community are the sum of the resources fi it produces and the tribute received from subordinates (Steponaitis 1981). The power (wealth) of a polity Fi is given by the total resources available to its chief community. The complexity of a polity ci is given by the number of levels of control above the level of individual villages.
Polities are engaged in warfare as a result of decision-making, similar to earlier agent-based models of polity systems. The polities grow, decrease in size, or disappear as a result of conquest, with the winner absorbing (all or a part of) the loser. New polities also appear, and old polities decrease in size, when a subordinate community secedes with all of its subordinates.
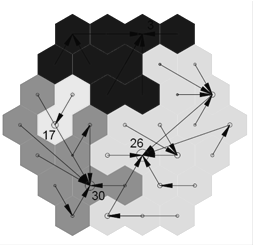
a)
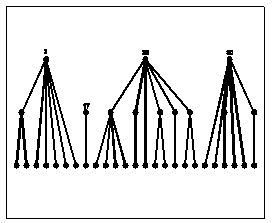
b)
Fig. 1. An example of a system with 37 villages and four polities. a) Spatial view. The arrows indicate the direction of the tribute flow. The circles are proportional to the polity power. The numbers are labels identifying the chief communities. b) A hierarchical representation of the polities. The complexity of polities 3, 26 and 30 is two while that of polity 17 is one
Each chief community and each of their direct subordinates make exactly one decision every year. For the chief community, the decision is whether or not to attack a neighboring polity. For a direct subordinate of a chief community, the decision is whether or not to attempt to secede. Warfare is modeled as follows. A polity selects its weakest neighbor and calculates the chance of success of an attack upon it (which increase the probability of attack), as well as the attack costs (which decrease the probability). The willingness to attack also decreases as the amount of resources available decreases. An attack of polity i on polity j succeeds or not with probabilities proportional to![]() and
and ![]() . Parameter α characterizes the importance of other factors (‘noise’) besides the polities' power in controlling the outcome of a conflict, with larger α implying less noise and more determinism. For example, let polity i be twice as strong as polity j. Then with linear scaling (i.e., with α = 1), the probabilities of polities i and j winning the conflict between them are in the ratio 2:1. However with quadratic scaling (i.e., with α = 2) this ratio becomes 4:1. That is, as α increases, polity strength becomes a better predictor of the outcome of conflict.
. Parameter α characterizes the importance of other factors (‘noise’) besides the polities' power in controlling the outcome of a conflict, with larger α implying less noise and more determinism. For example, let polity i be twice as strong as polity j. Then with linear scaling (i.e., with α = 1), the probabilities of polities i and j winning the conflict between them are in the ratio 2:1. However with quadratic scaling (i.e., with α = 2) this ratio becomes 4:1. That is, as α increases, polity strength becomes a better predictor of the outcome of conflict.
The aggressor attempts to conquer communities of the victim, starting with border ones, and proceeding in a series of ‘battles’ until either it suffers a defeat, or until the chief community of the victim polity is conquered. Thus, the aggressor either fails completely, seizes a part of the victim polity, or the whole victim polity is annexed.
Annexing communities may require reorganization of the successful aggressor polity (via linearization and promotion, see Flannery 1972), because of the limit L on the number of subordinates of any community. Thus, if one community is to become a subordinate of another, the latter must have at least one open control slot. When all open slots are exhausted, new ones are created by demoting some communities, that is moving them to a lower level in the hierarchy (Flannery 1972). The winning polity attempts to maximize the flow of tribute to the top, and therefore demotes poorer/smaller communities while keeping wealthier/larger ones at higher levels of the hierarchy.
A community subordinate to the chief polity will secede if it estimates that the attack of its old master will be successfully repelled and is willing to pay the price of rebellion. The chief polity attempts to suppress the rebellion immediately. If a successful rebellion results in spatial separation between different parts of the master state, all communities that become disjointed from their superiors secede as well. To account for a possibility of secession upon the death of the paramount chief as a result of a struggle among subchiefs (which is a major source of instability in chiefdoms, see Anderson 1994; Wright 1984; Cordy 1981; Kirch 1984), we introduce an additional parameter τ, the average time in power of the paramount chief. Upon the death of the paramount chief, a random number of subordinate communities become independent without war.
The cost of warfare is a reduction in the amount of actual resources available to participants, with less likely outcomes being costlier for all participants. Following conflict resolution resources are renewed at a fixed low rate.
Analysis
To develop an intuition about the model's behavior, we ran numerical simulations with all possible permutations of the following six parameters: system edge size S = 4, 5, and 6 villages (so that the total number of villages is 37, 61, and 91, respectively); α = 1 and 2 (i.e., linear and quadratic scaling of the polity power to the probability of a win); variation in productivity σ = 0.3, 0.4, and 0.5 (using data in Steponaitis 1981, σ can be estimated to be between 0.34 and 0.48), tribute θ = 0.1, 0.2, and 0.3 (in Steponaitis 1981 tribute level was estimated to be 0.16–0.22), span of control L = 5, 6, and 7 (Johnson 1982 argued that the most common value of the span of control is 6), and the chief's average time in power τ = 5, 10 and 20 years (for all model parameters, see Table 1). Numerous sources, from Polynesian chiefly genealogies to the so-called ‘king lists’ of many early states, indicate these are reasonable estimates of τ. Very few leaders in chiefly or even state-level societies lasted longer than 20–30 years, with most reigns appreciably shorter; rulers who held power for exceptionally long times are just that, unusual exceptions rather than the rule (Kamakau 1872; Beckwith 1977; Dodson and Hilto 2004).
Each simulation ran for 1,000 years, and the statistics were evaluated using the data from the last 800 years. Our focus was on the dynamics of the relative size of the largest polity smax (Fig. 2a), the mean ![]() (Fig. 2b) and maximum cmax complexity, and average ‘centrality’
(Fig. 2b) and maximum cmax complexity, and average ‘centrality’ ![]() (i.e., the ratio of the power of the chief village and the one immediately below, see Steponaitis 1981) (Fig. 2c). We also looked (see Supplementary Information) at the relationships between a polity's base-line productivity and actual power (Steponaitis 1981) and between settlement power and rank on a log-log scale (Johnson 1980; Wright 1984), and at the distributions of village power (Wright 1984).
(i.e., the ratio of the power of the chief village and the one immediately below, see Steponaitis 1981) (Fig. 2c). We also looked (see Supplementary Information) at the relationships between a polity's base-line productivity and actual power (Steponaitis 1981) and between settlement power and rank on a log-log scale (Johnson 1980; Wright 1984), and at the distributions of village power (Wright 1984).
Starting with a system of independent villages, we observe the rapid formation of polities of various size and complexity as a result of warfare. The system quickly (within 50–100 years) reaches a kind of equilibrium in which our focal characteristics smax, ![]() , cmax and
, cmax and ![]() are maintained at approximately constant values (see e.g., Fig. 2). However, this equilibrium is stochastic and is characterized by the dynamic instability of individual polities, with quick collapse characterizing chiefdoms reaching relatively large size and complexity.
are maintained at approximately constant values (see e.g., Fig. 2). However, this equilibrium is stochastic and is characterized by the dynamic instability of individual polities, with quick collapse characterizing chiefdoms reaching relatively large size and complexity.
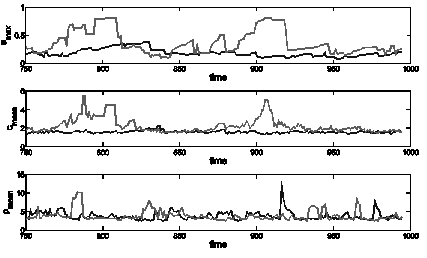
Fig. 2. Examples of the temporal dynamics of the relative size of the largest polity, the mean complexity, and the mean centrality. Black lines: S = 5, α = 1, σ = 0.4, θ = 0.2, L = 6, τ = 10; grey lines: the same but with α = 2
Table 1. Major model parameters and statistics
| S | System edge size |
| α | Scaling exponent (of the polity power to the probability of a win) |
| σ | Standard deviation of the baseline resource level |
| θ | Tribute level |
| L | Span of control (the maximum number of subordinate communities) |
| τ | The expected time in power of the paramount chief |
|
| Relative size of the largest polity |
|
| Mean complexity |
|
| Maximum complexity |
|
| Average centrality (i.e. the ratio of the power of the chief village and the one immediately below) |


To quantify this process, we identified all ‘significant complex chiefdoms’, that is polities with complexity c ≥ 2 and size s ≥ 10 villages. Note that only a small proportion of polities reaches this status. Fig. 3, illustrating the dynamics of such polities, shows their rapid growth and collapse.
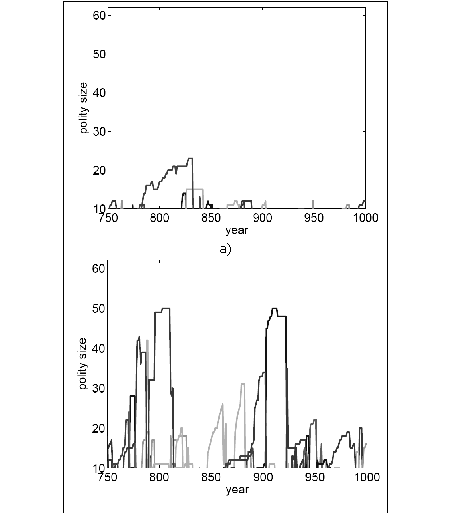
Fig. 3. The dynamics of polities that have achieved a size of at least s = 10 and complexity c = 2. Different curves correspond to different chief villages:
a) S = 5, α = 1, σ = 0.4, θ = 0.2, L = 6, τ = 10;
b) the same but with α = 2
Table 2. Results of the analysis of variance: the effects of the parameters and of their pairwise interactions on system properties
| Parameters and their combinations |
|
|
| T |
|
| S | 13.2 | 0.3 | 8.3 | 3.4 | 0.0 |
| α | 39.8 | 33.6 | 34.9 | 19.9 | 5.4 |
| σ | 0.8 | 1.6 | 0.7 | 0.7 | 25.0 |
| θ | 1.0 | 2.0 | 0.5 | 8.6 | 36.3 |
| L | 0.0 | 0.8 | 5.7 | 1.0 | 1.1 |
| τ | 33.8 | 40.8 | 38.9 | 55.5 | 10.4 |
| S×α | 0.3 | 0.1 | 1.5 | 0.1 | 0.0 |
| S×σ | 0.0 | 0.0 | 0.0 | 0.0 | 0.1 |
| α×σ | 0.0 | 0.2 | 0.0 | 0.0 | 2.0 |
| S×θ | 0.1 | 0.0 | 0.2 | 0.0 | 0.0 |
| α×θ | 0.2 | 0.7 | 0.6 | 0.2 | 0.0 |
| σ×θ | 0.0 | 0.1 | 0.1 | 0.1 | 0.3 |
| S×L | 0.0 | 0.0 | 0.1 | 0.0 | 0.1 |
| α×L | 0.0 | 0.1 | 0.1 | 0.1 | 0.3 |
| σ×L | 0.0 | 0.0 | 0.0 | 0.1 | 0.1 |
| θ×L | 0.1 | 0.1 | 0.1 | 0.2 | 0.5 |
| S×τ | 0.4 | 0.1 | 1.2 | 0.1 | 0.1 |
| α×τ | 7.0 | 12.9 | 1.8 | 0.1 | 0.4 |
| σ×τ | 0.1 | 0.3 | 0.1 | 0.0 | 2.1 |
| θ×τ | 0.3 | 0.9 | 0.5 | 2.5 | 0.1 |
| L×τ | 0.1 | 0.1 | 0.1 | 0.6 | 0.2 |
| error | 2.6 | 5.2 | 4.5 | 6.6 | 15.3 |
| total | 100.0 | 100.0 | 100.0 | 100.0 | 100.0 |
We studied the effects of parameters on system properties (see Table 2 and the Supplementary Information). The relative size of the largest polity smax increases most significantly with the success probability exponent α and with the chief's average time in power τ, but decreases with system size S (see Fig. 4 and Supplementary Information). With α = 2 (i.e., quadratic scaling of polity power to success probability) we occasionally observe cases when all villages are incorporated into a single polity. Such a state can last for up to 35 % of run time and is most likely with maximum values of both τ and θ.
Average complexity  increases most significantly relative to α and τ. It also increases with system size S, but decreases with increasing span of control L. Overall,
 ![]() stays below c. 2 and 3.3 for α = 1 and 2, respectively. Average centrality
stays below c. 2 and 3.3 for α = 1 and 2, respectively. Average centrality ![]() increases most significantly with variation in productivity σ and with tribute θ; it also increases with α, but decreases with τ.
increases most significantly with variation in productivity σ and with tribute θ; it also increases with α, but decreases with τ.
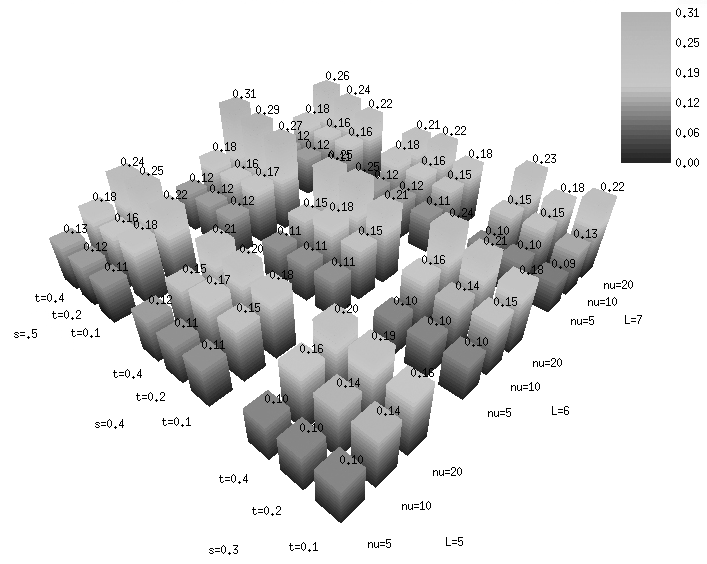
Fig. 4. The effects of parameters on the relative size smax of the largest polity. Each bar corresponds to a combination of four parameters: σ, θ, τ and L. The values of smax are simultaneously reflected in the bar's height and in the number shown next to it. Other parameters are S = 5, α = 2
Average lifetime of ‘significant complex chiefdoms’, T, increases with α and τ (most dramatically), while growing with tribute θ, but decreasing with system size S. Overall, the average lifetime of the ten most significant complex chiefdoms stays below 55 and 68 years for α = 1 and 2, respectively.
The rank-size curves describing the distribution of polity sizes (Haggett 1965; Johnson 1980; Wright 1986; Peterson and Drennan 2005; Drennan and Peterson 2006) are always convex (see Fig. 5), as expected; polity power declines approximately linearly with the logarithm of its rank indicating the presence of poorly integrated competing centers. The scatter plots for the relationships between the actual and base-line power of polities (Steponaitis 1981) do not show much clustering, suggesting that they are a poor indicator of the degree of complexity in the system (see Supplementary Information).
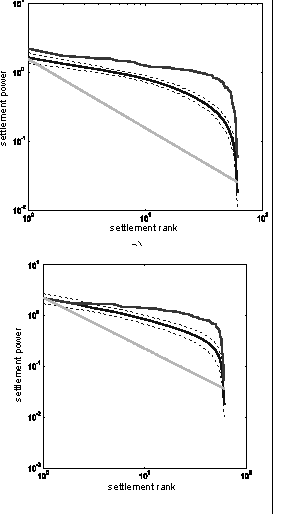
Fig. 5. Rank-size curves. Solid black lines: the time average. Dashed black lines: the time average plus minus one standard deviation. The light grey line gives the lognormal curve. Medium dark lines on top gives the rank-size curve at the final year of simulations. Parameters are as in Fig. 3
Discussion
Our model provides theoretical support for a view that the formation of complex polities is ‘a predictable response to certain specific cultural, demographic and ecological conditions’ (Carneiro 1970). Conditions explicitly accounted by our model include warfare, circumscription, variation in productivity between different local communities, ability to generate surpluses, ability to delegate power, and restrictions on the growth of polities due to scalar stress. Once these conditions are present within a particular geographic area, the model predicts rapid formation of hierarchically organized competing polities partitioning available space.
A striking feature of the model output is the fluid nature of ‘significant’ polities, which continuously go through stochastic cycles of growth (both in size and complexity) and collapse. Growth is driven by successful warfare whereas collapse results from defeat in warfare, rebellion of subchiefs, or fragmentation following the death of the paramount chief. The lifetime of chiefdoms observed in our simulation – a few generations – is comparable to those identified by archaeological studies (e.g., Anderson 1994; Wright 1984; Earle 1991; Hally 1996; Junker 1999; Blitz and Livingood 2004). The model suggests that the rapid collapse of chiefdoms can occur even without environmental perturbations (e.g., drought) or overpopulation.
While the characteristics of individual polities (such as size, complexity, power, and centrality) undergo continuous change, the average values of these characteristics across the whole system remain relatively stable. We have systematically studied how these characteristics are affected by the following six parameters: variation in productivity between local communities σ, probability of success in war exponent α, span of control L, tribute θ, system size S, and the average chief's time in power τ. Our results show that most variation in system behavior can be explained just by two parameters: α and τ, with higher values strongly promoting the existence of larger, more complex, and more stable polities. Only in the case of centrality were the effects of α and τ small, with most variation being explained by σ and θ.
The chief's expected time in power τ is one of the two most important parameters. This finding strongly supports arguments on the crucial importance of having well-defined and legitimate mechanisms of succession for the stability of polities (Anderson 1994; Wright 1984). Creating and maintaining complex polities thus requires effective mechanisms to deal with both internal and external threats. In both cases, leaders (paramount chiefs) must solve collective action problems to overcome challenges. Even a most abbreviated reading of human history shows how difficult this task has been.
The other critical parameter of the model is the probability of success in war (controlled by α), which sets the relative effectiveness of stronger (wealthier) polities in internal and inter-polity conflicts. In our model, the stronger of the two polities does not necessarily win a conflict between them. This is reasonable as there are many other factors besides wealth that can affect the outcome of conflict. However increasing α implies a stronger dependence of the outcome of the conflict on the polities' power (wealth). The degree of determinism in the conflict resolution (and thus, parameter α) is expected to increase with economic and political development (Carneiro 1970, 1981; Collins 1986). Note that in our simulations, polities conquering the whole simulation domain are observed only with α = 2.
Our model shows no qualitative differences between polities with a single level of control above the level of individual villages (‘simple chiefdoms’) and polities with two or more levels of control (‘complex chiefdoms’ or ‘states’). During each individual run, the number of control levels is not stable but changes dynamically and therefore cannot by itself serve as an indicator of the presence of ‘true’ states. Our results support Carneiro's (1981: 38) insight that ‘the transcending of local sovereignty and the aggregation of previously autonomous villages into chiefdoms was a critical step in political development – probably the most important one ever taken. It crossed a threshold, and once crossed, unlimited further advance in the same direction became possible. The emergence of chiefdoms was a qualitative step. Everything that followed, including the rise of states and empires, was, in a sense merely quantitative’.
In our simulations it was possible for polities to conquer the whole spatial domain, or a significant part of it. However, our analyses also show that such polities are relatively short-lived. A major reason for this is the relative ease of rebellion within larger polities. Additionally, our model explicitly assumes that any ‘internal specialization’ is absent and that all mechanisms for autonomous existence of a rebellious province are already in place. This model behavior thus further emphasizes, through the effect of its absence, the importance of ‘internal specialization’ for the emergence of large and stable polities (Flannery 1972; Wright 1977, 1984).
Implications for Archaeological Research
Due to temporal resolution limitations archaeological analyses of settlement hierarchies typically combine sites occupied over intervals of a half century to, sometimes, hundreds of years. The hierarchies reconstructed by archaeologists are commonly displayed as a series of maps showing site sizes during different periods, often separated by a century or more, or else histograms or rank size plots (Wright and Johnson 1975; Wright 1977, 1984, 1986; Johnson 1980; Hally 1996; McAndrews et al. 1997; Spencer and Redmond 2001; Liu and Chen 2003; Peterson and Drennan 2005; Drennan and Peterson 2006). These reconstructions suggest rigid formal hierarchies and static political landscapes. Our analyses, in contrast, indicate that at a finer temporal scale the various factors that produce these archaeological signatures are much more dynamic. This result is in agreement with written records of historical events (when available; e.g., Earle 1987, 1991).
Our estimates of chiefdom duration are comparable with those based on archaeological evidence. In studying Southeastern Mississippian chiefdoms, Hally (1993) examined the time periods when occupation and mound construction occurred at 47 mound centers in central and northern Georgia. He concluded that ‘paramount chiefdoms must have been unstable and short lived’ while ‘simple and complex chiefdoms endured for as much as a century or more’ (Hally 1993). The actual duration of phases, or periods of occupation and construction in his analysis (Ibid.: 145), however, could not be resolved much below 75–100 years. Hally extended this analysis in a second paper (Hally 1996) examining 45 mound centers, and including episodes of mound stage construction. Where evidence for numbers of internal mound construction stages was available, duration of occupation was estimated to be between 75 and 100 years, with the average number of years per stage ranging from 12 to 25 years at the best understood sites (Hally 1996). This span may represent the duration of a chiefly leader, or generation. At 29 of the 45 mound centers, only a single period of use is currently known, indicating most ‘chiefdoms’ locally lasted no more than 75–100 years, and perhaps appreciably less (Hally 1996).
In a follow up, Hally (2006: 27) argued that ‘as many as 47 distinct chiefdoms rose and fell’ in 27 locations during the Mississippian period in northern Georgia (some locations were occupied repeatedly, often with gaps in occupation of a century or more). The numbers of chiefdoms in his sample fluctuated between 8 and 17 during the period of 1000–1500 CE (Hally 2006). Many polities in the sample were single-mound simple chiefdoms (Hally 2006).
Blitz and Livingood (2004) used mound volume as an alternate means of measuring regional settlement hierarchies, using a sample of sites from across the southeast USA. For a sample of 35 mounds they recorded a mound volume index (basal length × basal width × height / 1000), the number of major mound-construction stages, the duration of mound use in years, and the number of mounds at the site where the sample mound was found (Ibid.: 293). Their analysis, while geographically broader than Hally's, yielded generally similar results, noting average mound center ‘duration of use range is 100–450 years, with a mean of 183 years and a median of 150 years. Also, there appears to be a rough periodicity in mound construction: the average occupation span per construction layer is 25–50 years’ (Ibid.: 296). They were able to demonstrate that mound stage construction might fall into two cycles, one of c. 12–18 years, and another of c. 25–50 year spacing (Ibid.: 297).
Our finding that the duration of a chief's reign is a significant parameter parallels that in the literature on state fiscal organization. In this literature, the discount rate of rulers (that is, their expected time in office) is shown to be a major determinant of the kind of taxation system employed, which in turn has various implications for society, for example, for political stability of the Roman state and Ptolemaic Egypt (Kiser and Kane 2007; Levi 1988; Monson 2007).
In our model individual villages differ only in their base-line productivity and geographic location but otherwise have equal ability to form complex societies. In human history some polities had a headstart, allowing them to achieve large size initially (e.g., San Miguel Mogote or El Mirador in Mesoamerica; Uruk and Susa in Mesopotamia; Aspero in South America; see Service 1975); but the strategies for complex polities buildup and maintenance would have spread quickly in a Darwinian fashion as a result of conquest and imitation. Therefore once chiefdoms appeared, their organizational form would itself have tended to spread, as neighboring societies adopted it for reasons ranging from emulation to self defense (Carneiro 1981; Anderson 1994).
Conclusion
The dynamics generated by our model, in which hierarchical societies tend to achieve at most medium levels of complexity, and only for relatively short periods of time, resembles the chiefly cycles observed prior to sustained Western contact in eastern North America, southern Central America and northern South America, Oceania, southeast Asia and the Philippines, and across large parts of sub-Saharan Africa (e.g., Wright 1984; Marcus 1992; Earle 1991; Anderson 1994; Cordy 1981; Junker 1999; Drennan and Peterson 2006).
The model developed here can be extended in a number of ways. For example, instead of a simple conquest mechanism, one can consider a more nuanced dynamic in which external threat of conquest (or raiding) induces a greater degree of cooperation between lower-level groups, which results in a more stable higher-level polity. According to Cioffi-Revilla's canonical theory (2005), such a (‘fast’) process is common for producing stronger institutions of government. One possible direction is to generalize the model to allow for the formation of coalitions between different polities (Carneiro 1998; see Gavrilets et al. 2008 for a possible dynamic approach). Also, to adapt the model for describing larger spatial scales (e.g., as necessary for modeling the origin of states and empires), changes in population densities need to be considered, as well as the propensity for cooperation (and, conversely, conflict) should be allowed to depend on cultural similarity/dissimilarity between the agents.
Over the past several decades mathematical methods and techniques have become very important in life sciences and social sciences (Spencer 1998; Cioffi-Revilla 2002; Bentley and Maschner 2008; Costopoulos 2008; Kohler et al. 2005). In particular, mathematical and computational modeling are powerful tools for better understanding the origins of new species (Gavrilets 2004) and of general rules of biological diversification (Gavrilets and Losos 2009). Agent-based simulation modeling efforts like those advanced here offer fruitful avenues for future research on general patterns in historical dynamics and on the emergence and diversification of human societies (Turchin 2003, 2006, 2009).
Adams R. M. 1966. The Evolution of Urban Society. Chicago, IL: Aldine Press.
Anderson D. G. 1994. The Savannah River Chiefdoms: Political Change in the Late Prehistoric Southeast. Tuscaloosa, AL: University of Alabama Press.
Anderson D. G. 1996. Fluctuations between Simple and Complex Chiefdoms: Cycling in the Late Prehistoric Southeast. Political Structure and Change in the Prehistoric Southeastern United States / Ed. by J. F. Scarry, pp. 231–252. Gainesville, FL: University Press of Florida.
Beckwith M. W. 1977. Hawaiian Mythology. Honolulu, HI: University of Hawaii Press.
Bentley R. A., and Maschner H. D. G. 2008. Complexity Theory. Handbook of Archaeological Theories / Ed. by R. A. Bentley, H. D. G. Maschner, and C. Chippindale, pp. 245–270. Lanham, MD: AltaMira Press.
Blitz J., and Livingood P. 2004. Sociopolitical Implications of Mississippian Mound Volume. American Antiquity 69(2): 291–301.
Bremer S. A., and Mihalka M. 1977. Machiavelli in Machina: Or Politics Among Hexagons. Problems of the World Modeling: Political and Social Implications / Ed. by K. W. Deutsch, B. Fritsch, H. Jaquaribe, and A. S. Markovits, pp. 303–337. Cambridge: Ballinger Publishing.
Carneiro R. L. 1970. A Theory of the Origin of State. Science 169: 733–738.
Carneiro R. L. 1981. The Chiefdom: Precursor of State. The Transition to Statehood in the New World / Ed. by G. D. Jones, and R. R. Kautz, pp. 37–79. Cambridge: Cambridge University Press.
Carneiro R. 1998. What Happened at the Flashpoint? Conjectures on Chiefdom Formation at the Very Moment of Conception. Chiefdoms and Chieftaincy in the Americas / Ed. by E. M. Redmond, pp. 18–42. Gainesville, FL: University Press of Florida.
Cederman L.-E. 1997. Emergent Actors in World Politics. Princeton, NJ: Princeton University Press.
Cederman L.-E., and Girardin L. 2010. Growing Sovereignty: Modeling the Shift from Indirect to Direct Rule. International Studies Quarterly 48: 27–48.
Childe V. G. 1950. The Urban Revolution. The Town Planning Review 21: 3–17.
Cioffi-Revilla C. 2000. Ancient Warfare: Origins and Systems. Handbook of War Studies II / Ed. by M. I. Midlarsky, pp. 59–89. Ann Arbor, MI: University of Michigan Press.
Cioffi-Revilla C. 2002. Invariance and Universality in Social Agent-based Simulations. Proceedings of the National Academy of Sciences 99: 7314–7316.
Cioffi-Revilla C. 2005. A Canonical Theory of Origins and Development of Social Complexity. Journal of Mathematical Sociology 29: 133–153.
Cioffi-Revilla C., and Landman T. 1999. Evolution of Maya Polities in the Ancient Mesoamerican System. International Studies Quarterly 43: 559–598.
Collins R. 1986. Weberian Sociological Theory. New York: Cambridge University Press.
Cordy R. H. 1981. A Study of Prehistoric Social Change. The Developmnent of Complex Societies in the Hawaiian Islands. New York: Academic Press.
Costopoulos A. 2008. Simulating Society. Handbook of Archaeological Theories / Ed. by R. A. Bentley, H. D. G. Maschner, and C. Chippindale, pp. 273–281. Lanhan, MD: AltaMira Press.
Cusack T. R., and Stoll R. J. 1990. Exploring Realpolitik. Probing International Relations Theory with Computer Simulation. Boulder, CO: Lynne Rienner Publishers.
Dacey M. F. 1969. A Probability Model for the Rise and Decline of States. Peace Research Society Papers 14: 147–153.
Dacey M. F. 1974. A Model of Political Integration and Its Use in the Reconstruction of a Historical Situation. Locational Approaches to Power and Conflict / Ed. by K. R. Cox, D. R. Reynolds, and S. Rokkan, pp. 213–230. New York: SAGE Publications.
Dodson A., and Hilto D. 2004. The Complete Royal Families of Ancient Egypt: A Genealogical Sourcebook of the Pharaohs. New York: Thames and Hudson.
Drennan R. D., and Peterson C. E. 2006. Patterned Variation in Prehistoric Chiefdoms. Proceedings of the National Academy of Sciences 103: 3960–3967.
Earle T. K. 1987. Chiefdoms in Archeological and Ethnohistorical Perspective. Annual Review of Anthropology 16: 279–308.
Earle T. K. 1991. Chiefdoms: Power, Economy and Ideology. New York: Cambridge University Press.
Earle T. K. 1997. How Chiefs Come to Power. Stanford, CA: Stanford University Press.
Engels F. 1884. Origins of the Family, Private Property, and the State. Selected Readings in Two Volumes. Vol. 2 / Ed. by K. Marx, and F. Engels, pp. 185–326. Moscow: Foreign Languages Press.
Ferguson R. B. 1984. Warfare, Culture, and Environment. Orlando, FL: Academic Press.
Ferguson Y. H., and Mansbach R. W. 1996. Polities: Authority, Identities, and Change. Columbia, SC: University of South Carolina Press.
Flannery K. V. 1972. The Cultural Evolution of Civilizations. Annual Review of Ecology and Systematics 3: 399–426.
Fried M. H. 1967. The Evolution of Political Society. New York: Random House.
Gavrilets S. 2004. Fitness Landscapes and the Origin of Species. Princeton, NJ: Princeton University Press.
Gavrilets S., Duenez-Guzman E. A., and Vose M. D. 2008. Dynamics of Alliance Formation and the Egalitarian Revolution. PLOS ONE 3(10): e3293.
Gavrilets S., and Losos J. 2009. Adaptive Radiation: Contrasting Theory with Data. Science 323: 732–737.
Haas J. 2004. The Anthropology of War. Cambridge: Cambridge University Press.
Haggett P. 1965. Locational Analysis in Human Geography. London: Edward Arnold.
Hall T. D. 2001. Chiefdoms, States, Cycling, and World-Systems Evolution: A Review Essay. Journal of World-Systems Research 7: 91–99.
Hally D. J. 1993. The Territorial Size of Mississippian Chiefdoms. Archaeology of Eastern North America Papers in Honor of Stephen Williams. Archaeological Report No. 25 / Ed. by J. B. Stoltman, pp. 143–168. Jackson, MS: Mississippi Department of Archives and History.
Hally D. J. 1996. Platform Mound Construction and the Instability of Mississippian Chiefdoms. Political Structure and Change in the Prehistoric Southeastern United States / Ed. by J. F. Scarry, pp. 92–127. Gainesville, FL: University Press of Florida.
Hally D. J. 2006. The Nature of Mississippian Regional Systems. Light on the Path: The Anthropology and History of the Southeastern Indians / Ed. by T. J. Pluckhahn and R. Ethridge, pp. 26–42. Tuscaloosa, AL: University of Alabama Press.
Johnson G. A. 1980. Rank Size Convexity and System Integration. Economic Geography 56(3): 234–247.
Johnson G. A. 1982. Organizational Structure and Scalar Stress. Theory and Expla-nation in Archaeology / Ed. by C. Renfrew, M. Rowlands, and B. A. Segraves, pp. 389–421. New York: Academic Press.
Junker L. L. 1999. Raiding, Trading, and Feasting: The Political Economy of Philippine Chiefdoms. Honolulu: University of Hawaii Press.
Kamakau S. M. 1872. Ruling Chiefs of Hawaii. Honolulu: Kamehameha Schools Press.
Keely L. H. 1997. War before Civilization: The Myth of the Peaceful Savage. New York, NY: Oxford University Press.
Kirch P. V. 1984. The Evolution of the Polynesian Chiefdoms. Cambridge: Cambridge University Press.
Kiser E., and Kane D. 2007. The Perils of Privatization: How the Characteristics of Principals Affected Tax Farming in the Roman Republic and Empire. Social Science History 31(2): 191–212.
Kohler T., Gumerman G., and Reynolds R. 2005. Simulating Ancient Societies. Scientific American 293(1): 76–82.
Kurella D. 1998. The Muisca. Chiefdoms in Transition. Chiefdoms and Cieftaincy in the Americas / Ed. by E. M. Redmond, pp. 189–216. Gainsville, FL: University Press of Florida.
Lenin V. 1918. The State and Revolution. Collected Works. Vol. 25, pp. 381–492. Moscow: Progress Publishers.
Levi M. 1988. Of Rule and Revenue. Berkeley, CA: University of California Press.
Liu L., and Chen X. 2003. State Formation in Early China. London: Duckworth.
Marcus J. 1992. Political Fluctuations in Mesoamerica. National Geographic Research and Exploration 8(4): 392–411.
Marcus J. 1998. The Peaks and Valleys of Ancient States an Extension of the Dynamic Model. Archaic States / Ed. by G. Feinman and J. Marcus, pp. 59–94. Santa Fe, NM: SAR Press.
McAndrews T. L., Albarracin-Jordan J., and Bermann M. 1997. Regional Settlement Patterns in the Tiwanaku Valley of Bolivia. Journal of Field Archaeology 24: 67–83.
Monson A. 2007. Rule and Revenue in Egypt and Rome: Political Stability and Fiscal Institutions. Historical Social Research 32(4): 252–274.
Peterson C. E., and Drennan R. D. 2005. Communities, Settlements, Sites, and Surveys: Regional-scale Analysis of Prehistoric Human Interaction. American Antiquity 70(1): 5–30.
Service E. R. 1975. Origins of the State and Civilization. The Process of Cultural Evolution. New York: Norton and Company.
Service E. R. 1978. Classical Theories of the Origin of Government. Origins of the State / Ed. by R. Cohen, and E. R. Service, pp. 21–34. Philadelphia, PA: Institute for the Study of Human Issues.
Spencer C. S. 1998. A Mathematical Model of Primary State Formation. Cultural Dynamics 10(1): 5–20.
Spencer C. S. 2010. Territorial Expansion and Primary State Formation. Proceedings of the National Academy of Sciences of the United States of America 107(16): 7119–7126.
Spencer C. S., and Redmond E. M. 2001. Multilevel Selection and Political Evolution in the Valley of Oaxaca, 500–100 B.C. Journal of Anthropological Archaeology 20: 195–229.
Steponaitis V. P. 1978. Location Theory and Complex Chiefdoms: A Mississippian Example. Mississippian Settlement Patterns / Ed. by B. D. Smith, pp. 417–453. New York: Academic Press.
Steponaitis V. P. 1981. Settlement Hierarchies and Political Complexity in Nonmarket Societies: The Formative Period of the Valley of Mexico. American Anthropologist 83: 320–363.
Trigger B. G. 2003. Understanding Early Civilizations: A Comparative Study. Cambridge: Cambridge University Press.
Turchin P. 2003. Historical Dynamics: Why States Rise and Fall. Princeton, NJ: Princeton University Press.
Turchin P. 2006. War and Peace and War: The Life Cycles of Imperial Nations. New York: Pi Press.
Turchin P. 2009. A Theory for Formation of Large Empires. Journal of Global History 4: 191–207.
Turchin P., and Gavrilets S. 2009. Evolution of Complex Hierarchical Societies. Social Evolution and History 8(2): 167–198.
Webster D. 1975. Warfare and the Evolution of the State: A Reconsideration. American Antiquity 40: 464–470.
Wittfogel K. A. 1957. Oriental Despotism: A Comparative Study of Total Power. New Haven, CT: Yale University Press.
Wright H. T. 1977. Recent Research on the Origin of the State. Annual Reviews of Anthropology 6: 379–397.
Wright H. T. 1984. Prestate Political Formations. On the Evolution of Complex Societies. Essays in Honor of Harry Hoijer / Ed. by W. Sander, H. T. Wright, and R. M. Amams, pp. 41–77. Malibu, CA: Undena Press.
Wright H. T. 1986. The Evolution of Civilizations. American Archeology Past and Future / Ed. by D. J. Meltzer, pp. 323–365. Washington: Smithsonian Institution Press.
Wright H. T., and Johnson G. A. 1975. Population, Exchange, and Early State Formation in Southwestern Iran. American Anthropology 77: 267–289.
Mathematical Appendix
Here we provide some additional details on the model and simulations. The model was implemented in the Matlab.
Attacks. A polity may attack only its weakest neighbor. The attack of polity i on polity j is successful with probability
![]() , (Eq. 1)
, (Eq. 1)
where Fi is the power of polity i, and α is the success probability exponent. Polity i will attack polity j only if it estimates that the attack will be successful, is willing to pay the cost of warfare, and is not too devastated by previous warfare. Specifically, the probability of attack is set to
![]() . (Eq. 2)
. (Eq. 2)
Here the first term is the probability of winning (estimated by the potential aggressor via ‘scenario building’). The second term accounts for a negative effect of costs of warfare, cij (defined below), on the willingness to attack; β > 0 is a parameter. The third term accounts for a reduction in the willingness to attack caused by recent conflicts (and ensuing drop in available resources); Fi,0 is the maximum possible power of the i-th polity (observed at maximum possible level of resources; i.e., if all fi = fi,0). If attack is not successful, a war ends in a draw.
We assume that attacks proceed through one or more stages. At the first stage, the target is the wealthiest border community of the weakest neighbor. The victim repels the attack successfully with probability Qij = 1 – Pij. If the attack was successful, the aggressor proceeds to attack the superior of the target. Now the probability that the victim repels the attack successfully is reduced to (1 – γ)Qij, where 0 ≤ γ <1 is a parameter characterizing the ‘loser effect’ (e.g., due to demoralization). If the second attack is successful, the aggressor proceeds to attack the superior of the superior of the target and so on. The process stops when an attack is repelled or when the chief community of the victim po-lity is conquered. In the former case, the aggressor seizes a part of the victim polity that was subordinate to the community attacked at the last successful attack. In the latter case, the whole victim's polity is seized.
Linearization and promotion. Polity i attempts to maximize the flow of tribute by the processes of linearization and promotion, after Flannery (1972), subject to geographic restrictions and restrictions on the number of subordinates. If the chief community i has an open control slot, it will control polity j directly. If there are no open control slots, then the chief community will control directly the L wealthiest communities chosen (i.e., promoted) from the set of its L subordinates and the newly conquered polity j. The remaining (i.e., the poorest) community will be demoted and reattached to its geographically closest neighbor of the higher rank (i.e., by-passed in a process akin to linearization). If this neighbor has already filled all its control slots, further rearrangements will follow according to the same strategy.
Costs. Different actions (i.e., attack, defense, rebellion, or suppression of rebellion) reduce the actual resource level for all participants by a factor (1 − c) where the cost c of an action is equal to a constant δ times the probability of loss for the winner (0 < δ ≤ 1). That is, if Pij is the probability that an attack of polity i on polity j is successful, then the cost of a successful attack is
![]() , (Eq. 3a)
, (Eq. 3a)
whereas the cost of an unsuccessful attack is
![]() . (Eq. 3b)
. (Eq. 3b)
This simple model captures the idea that more likely outcomes are less costly to all participants. For attacks involving several stages, costs are combined multiplicatively.
Resource dynamics. Each year the actual resource level fi grows towards its baseline level fi,0 at an exponential rate. Specifically, we define the half-life of resource recovery r measured in years so that it takes r peaceful years for the resource to grow from 1 − δ to 1 − δ/2.
Implementation rules. We use a ‘parallel’ implementation of the model in which different actions happen simultaneously rather then sequentially. To handle multiple events potentially involving the same polity we use the following rules: 1) A polity that is subject to a rebellion does not attack other polities. 2) A polity that is subject to a rebellion is not attacked by other polities. (The justification: since dealing with the rebellion will make the polity weaker, potential attackers would prefer to wait and attack later.) 3) If there are multiple rebellions within a polity, the polity's power is divided proportionally and multiple suppression attempts occur simultaneously.
Supplementary information
1. Sample movies with α = 1 and α = 2. Other parameters are at the midpoints of the ranges used (S = 6, σ = 0.3, θ = 0.2, L = 6, τ = 10).
The movies are currently available at http://neko.bio.utk.edu/~sergey/ chiefdoms/chiefdoms.html.
2. Detailed simulation results for S = 4, S = 5, S = 6.
The files are currently available at http://neko.bio.utk.edu/~sergey/chief doms/chiefdoms.html.
3. Effects of parameters on the properties of the system.
The files are currently available at http://neko.bio.utk.edu/~sergey/chief doms/chiefdoms.html.
Acknowledgement
We thank the reviewers for valuable comments and suggestions. This research was supported by a Guggenheim Fellowship (SG) and by the National Science Foundation Grant NSF-HSD SES-0527720 (PT).