Dynamical Generalizations of the Drake Equation: The Linear and Non-linear Theories

Almanac: History & Mathematics:Economy, Demography, Culture, and Cosmic Civilizations
Abstract
The Drake equation pertains to the essentially equilibrium situation in a population of communicative civilizations of the Galaxy, but it does not describe dynamical processes which can occur in it. Both linear and non-linear dynamical population analyses are built out and discussed instead of the Drake equation.
Keywords: SETI, the Drake equation, linear population analysis, non-linear population analysis.
Introduction
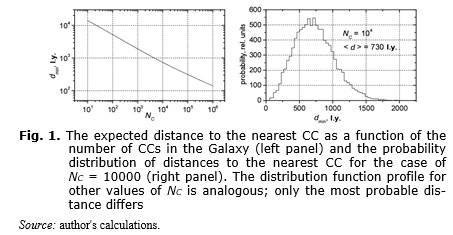
Communicative civilizations (CCs) are the ones which tend to send messages to other civilizations and are able to receive and analyze messages from other civilizations. The crucial question of the SETI problem is how far the nearest CC from us is. Its answer depends on the number of CCs existing in the Galaxy at present. Fig. 1 shows how the distance between the Sun and the nearest CC depends on the number of CCs in the Galaxy. The calculation was made by us by the Monte Carlo method with the use of a realistic model of the distribution of stars in the Galaxy (Allen 1973) and the actual location of the Sun in the Galaxy (8.5 kpc from the center of the Galaxy).
The best known way to answer the question about the number of CCs is the formula by F. Drake
![]() ,
,
where R∗ is a star-formation rate in the Galaxy averaged with respect to all time of its existence, fp is the part of stars with planet systems, nе is the average number of planets in systems suitable for life, fl is the part of planet on which life did appear, fi is the part of planets on which intelligent forms of life developed, fc is the part of planets on which life reached the communicative phase, L is the average duration of the communicative phase. The Drake equation gives the number of CCs only in a rather rough approximation. According to the formula, NC does not depend on time. Meanwhile, it is evident that formerly there were no CCs in the Galaxy at all. Then there was a transition period when its number was increasing somehow. In fact, the Drake formula describes only the essentially stable situation, which can be very remote from the truth.
Linear Population Analysis
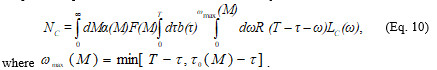
In the linear theory it is supposed that the CCs develop independently from each other and that they cannot affect the star formation rate and evolution of life on other planets in the Galaxy. The following model functions and parameters are used in the linear theory. R(M,T) is the star formation rate as a function of star mass M and galactic time T. The star lifetime is determined by the survival probability LS(M,τ) of the star mass M on the Main Sequence at the moment τ reckoned from the moment of its birth. В(М,τ), determines the density of the probability that a CC appears in the time τ after formation of a star of the mass M. The function B(M,τ) is normalized by òB(M,τ)dτ = a(M), where a(M) gives a probability that conditions suitable for origin of a CC near the star of the mass M will be implemented someday having infinitely long lifetime for the parent star. The duration of the communicative phase of CC evolution is determined by the function LC(M,ω) that gives the probability of maintenance of the communicative phase in the time ω after its origin. The population of stars is described by distribution nS(M,τ,T) specifying the number of stars by their mass M and age τ with the galactic time T. The population of CCs is described by distribution nC(M,τ,ω,T) specifying the number of communicative civilizations of the age ω at the galactic time T which appeared near the star having the mass M and the age τ. The total number of civilizations NC is:
The choice of L0 practically does not limit the generality of results (due to linearity).
It is important to note that though the relations in Fig. 4 (left panel) are constructed for a very limited set of parameters, they can be used to estimate within the context of many other scenarios. So, the curve amplitude will be proportional to the average CC lifetime (the parameter L0) and the curve amplitude will also be proportional to the maximum probability of realization of suitable conditions (the maximum value in α(M) function, see above).
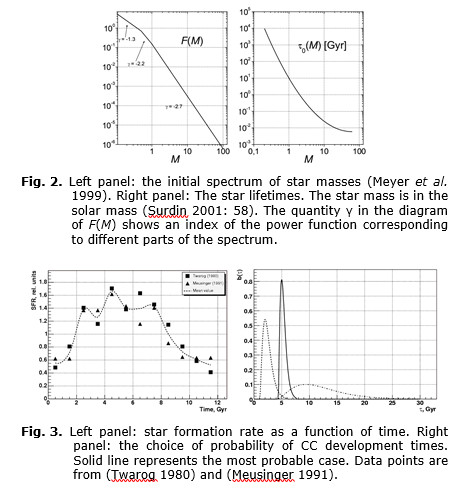
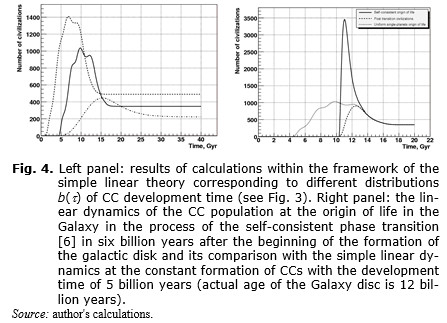
Up to this point the conditions leading to the origin of a CC have been supposed to be unchanged during the history of the galactic disk. Actually, variations of them are possible for a number of reasons (variable background of cosmic rays, etc.). The conditions change for sure if the hypothesis about the self-consistent galactic origin of life and related phase transition (Panov 2011) is true. In this case a great ‘Big Bang’ of life origin took place in the history of the Galaxy and if the development time to CC is more or less standard (like b(t) presented by solid line in Fig. 3, left panel – about five billion years), then ‘Big Bang’ of CCs origins should be followed as well. The theory describing this phase demographic peak may be deduced from the described above linear theory (we omit the details) and the results of calculation are presented in Fig. 4 (right panel). It was supposed that the ‘Big Bang’ of life origin to be six billion years after the start of formation of the Galaxy disk and the average time of development for CC to be five billion years in this calculation. The dashed line in Fig. 4 (right panel) shows the partial distribution for planets with the origin of life after the ‘Big Bang’ of life origin (as Earth). One can see that we can live both before and after the phase peak.
Thus, the population analysis based on the linear theory and real astrophysical data predicts no-trivial dynamical patterns of evolution of CCs like the linear demographic wave and the phase peak (see Fig. 3). Non-linear generalization of the formalisms leads to even more interesting picture.
Non-linear Population Analysis
In the linear theory given above the distributions B(M, τ) and LC(ω) describing the origin and life of communicative civilizations were supposed to be independent on the number of available civilizations. The function R(M,T) describing the ‘natural’ star formation rate was also considered to be independent of the CC population. This is true until civilizations have no effect on one another, nor on conditions of origin of other civilizations, nor on conditions of origin of stars. The theory accounting for this effect ceases to be linear.
The first possibility for a non-linear theory is related to the influence on the function R(M, T) – ‘the artificial creation of stars’. The second possibility –
the influence on the distribution B(M, τ) – must imply some sort of directed panspermia of life or intelligent life. The third kind of non-linear phenomena related to the changes of the probability LC(ω) by a mutual influence of civilizations through contacts by communication channels. We thoroughly study only the last possibility here. Other options can be studied by similar methods.
Without loss of generality, the CCs may be divided into three categories:
1) the CCs for which the contact is ‘harmful’, because it reduces the duration of the communicative phase; 2) the neutral CCs; and 3) the CCs for which the contact is ‘useful’, because it prolongs the communicative phase. We will call the last category extrovert communicative civilizations and will denote them as ECCs. In the following we will consider the dynamics of the subpopulation of the extrovert civilizations only.
It can be supposed additionally that one of the most important properties of ECCs is an increase in efficiency of search for partners and establishment of communication under the influence of the already established contacts (we call it civilization range). This circumstance will be substantially used below.
It is important that if ECCs do exist, then a process with a positive feedback can begin. The larger is the number of ECCs in the Galaxy, the higher is the contact probability. The contact increases the lifetime of the ECC and its civilization range, which leads to increasing the ECC population, which raises the contact probability again, and so on. The positive feedback loop can lead to an avalanche-like phase transition in the Galaxy-scale accompanied by a powerful burst of the number of ECCs. ECCs become prevailing in the Galaxy even if the situation was different before the transition. Some details of this phenomenon are described by the formalism proposed below.
In the linear theory the current state of a separate civilization was described only by age of the communicative phase w, which, in combination with the star lifetime and the moment of the civilization origin, made it possible to statistically predict the fate of a civilization. To account for the mutual influence through communication channels they should be described in greater details. We will consider that every civilization is described by age w and by a vector of parameters q that will be called ‘a quality’. This is a set of characteristics of ECCs which affects, first of all, an expected duration of the communicative phase and civilization range. It is supposed that the contact increases the ECC quality in a sense, and thanks to that the communicative phase prolongs and civilization range increases. Thus, the probability of civilization survival should be considered as dependent on its quality which must be also one of the arguments of the civilization distribution function:
Equations (3–5) for the star distribution function and equations (6–8) for the civilization distribution function remain valid in non-linear dynamics. Only a new term appears in it describing ‘the current’ of the civilization quality in the q-space due to interaction between them. Besides, now the edge condition must describe weights of ECCs quality starting the communicative phase. The total system of equations for the distribution function nC(M, τ, q, ω, Т) is written in the following way:
The civilization quality will be considered to be presented by the only scalar parameter q. It is supposed that the average value of the quality for an isolated civilization (without any contacts) is q = 1. We transfer from the detailed description of a civilization by its quality and age to the average value of quality upon the whole lifetime of the civilization and averaged upon all star masses. Further, we will consider the number of civilizations per unit of volume of a uniform galaxy. That is, instead of the exact distribution nC(M,t,q,w,T) we consider averaged distribution r(q,T) such that VG òr(q,T)dq = NC(T). We consider the civilization origin rate normalized per galaxy volume unit to be a given function of the galaxy time f(T), and the distribution density of the parameter q for isolated civilizations to be fo(q) such that òfo(q)dq = 1 and the mean value of fo(q) is equal to 1. Then Eqs. 12–14 can be transcribed in the form of a single equation
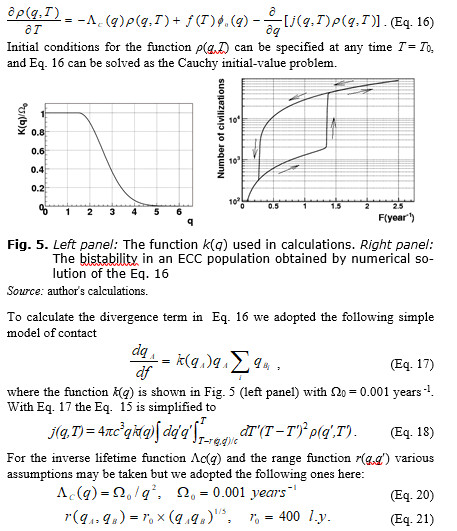
Some results of calculations are shown in Fig. 5 (right panel). Let us elucidate the computing technique and sense of the obtained results. It was supposed that at the initial time T = 0 there were no civilizations, r(q,0) = 0. After that the civilization origin rate F begins increasing slowly, so that at any time an almost complete equilibrium is achieved in the population of ECC. Fig. 5 (right panel) shows the relation between the number of civilizations and F (both normalized to the volume of our Galaxy). The equilibrium number of civilizations increases along with F. In the process, first a point in the diagram moves along the lower branch of hysteresis loop from left to right and the number of civilizations is still small (less than 2,000). This is the silence epoch, the probability P to find a partner to contact for any civilization is P << 1.
However, due to the increasing number of civilizations, the situation becomes unstable, and when F achieves a value of about 1.35 civilizations per year, and P » 0.05, then the equilibrium is broken. Due to the positive feedback between the number of contacts, civilization ranges and lifetimes, the number of civilizations and the probability of their interaction start increasing as an avalanche. As this takes place, the number of civilizations increases sharply by about an order, and the average number of partners per one civilization achieves 10. This phase transition ends because the possibility of ‘improving’ is exhausted at large values of the quality q (see Fig. 5, left panel). The saturation of contacts epoch starts (F > 1.4).
Then, in calculation, the civilization origin rate stops increasing (at F = 2.5 yeas –1) and begins to slow down. First, a point in the diagram moves backwards, repeating the trajectory of F growth. However, when reaching a critical value of F = 1.35 per year, the reverse transition does not occur. This is prevented by the positive feedback ‘number of contacts – lifetime and range’. The contact saturation epoch continues. Here two different stable states of the civilization population correspond to every value of F: one on the lower branch of hysteresis loop, the other on the upper branch. This is the bistability phenomenon. Only when P approaches a value of about 0.5, the positive feedback already cannot keep the contact saturation phase from destruction, the number of civilizations sharply fall, and the silence epoch returns.
We neglected the fluctuations of distribution density of civilization in the Galaxy. Fluctuations can create the saturation of contacts phase locally with subsequent growth.
References
Allen C. W. 1973. Astrophysical Quantities. London: University of London, The Athlone Press.
Meusinger H. 1991. Interpretation of the Frequency Distribution of Isochrone Ages of Nearby F and G Stars. Astrophys. Space Sci 182 : 19–34.
Meyer M. R., Adams F. C., Hillenbrandt L. A., Carpenter J. M., and Larson R. В. 1999. The Stellar Initial Mass Function: Constraints from Young Clusters and Theoretical Perspectives. arXiv:astro-ph/9902198.
Panov A. D. 2011. Prebiological Panspermia and the Hypothesis of the Self-Consistent Galaxy Origin of Life. Evolution: From Big Bang to Nanorobots / Ed. by L. E. Grinin, and A. V. Korotayev, pp. 151–155. Volgograd: Uchitel.
Surdin V. G. 2001. Birth of Stars. Moscow: URSS. In Russian (Сурдин В. Г. Рождение звезд. М.: УРСС).
Twarog B. A. 1980. The Сhemical Evolution of the Solar Neighborhood. II – The Age-metallicity Relation and the History of Star Formation in the Galactic Disk. Astrophys. J. 242: 242–259.