Energy, K-Waves, Lead Economies, and Their Inter-pretation/Implications

Almanac: Kondratieff Waves: Dimensions and Prospects at the Dawn of the 21st Century
Abstract
One approach to interpreting Kondratieff waves, associated with the leadership long cycle research program, emphasizes the role of intermittent but clustered technological innovations primarily pioneered by a lead economy, with various significant impacts on world politics. This approach is further distinguished by asserting that the K-wave pattern is discernible back to the tenth century and the economic breakthrough of Sung Dynasty China. While K-wave behavior has many widespread manifestations, the question raised in this essay is whether explanatory power is improved by giving a greater role to energy and energy transitions in the K-wave process(es). Eight specific implications are traced, ranging from the interaction of technological innovations and energy to cosmological interpretations. In general, the answer to the question raised is affirmative, with one caveat on whether emphasizing new fuels and engines is a hallmark of the hydrocarbon era or a new and evolving feature of K-waves.
Keywords: Kondratieff waves, long cycle, energy, energy transitions, technological innovation, lead economy, evolutionary processes.
One sign of a ‘progressive’ research program is whether its key assumptions are occasionally re-examined and revised as seems appropriate. The leadership long cycle program focuses on questions of informal governance in world politics but, unlike most other similar programs, emphasizes the role of technological innovation in lead economies, leading sectors, and Kondratieff waves. There is no need to jettison this emphasis. The lead economy-long wave should remain crucial to the program's explanatory infrastructure. However, a case can be made for further elaborating how and why lead economies, technological innovation, and leading sectors are important and can best be interpreted. Elsewhere, I have argued (Thompson 2010) that technological innovation should not be divorced historically from interactions within a larger context of demographic changes, climate and disease factors. That is, technological innovation and the innovators are embedded in a larger socioeconomic fabric to which it and they respond. New technology is not an isolated, stand-alone driver. I would like to elaborate this type of argument further by incorporating energy considerations more explicitly as well. Rather than only emphasizing technological innovation in leader sectors per se, I suggest we consider the interactions of energy demands/consumption and technological innovation. It is not an either/or situation. Changes in energy sources need to be integrated with technological innovation and the technological innovation that is most important needs to be interpreted in terms of its significance for energy consumption (Goldstone 2002; Allen 2006; Griffin 2010). If we make this adjustment in core perspective, some things do not change. For instance, the indicators of technological innovation on which the research program has relied in the past do not need to change. But how they are viewed may require some adjustment. Moreover, there are also some interesting implications for speculating about future systemic leadership transitions.
In this paper, eight implications are highlighted. First, it is possible to argue that innovations in energy convertors or fuels are fundamental to the clusters of economic innovation that have been critical to long wave pro-cesses. This argument does not mean that the clusters of innovation are exclusively about energy factors but that energy considerations are closely linked to successive waves of innovation. A second implication pertains to the question of how far back in time one can trace K-waves. The leadership long cycle program finds evidence for K-waves activity back to the tenth century in the form of technological innovations in Sung Dynasty China. But it is clear that the evidence is stronger after the late 18th century British industrial revolution than before. One good reason is the two energy transitions that took place between the late 18th and early 20th centuries. The consequences of combining clustered technological innovation with energy transitions led to economic changes that are even more pronounced than in earlier centuries.
Third, one of the main foci of the leadership long cycle research program are long waves of economic growth which come in pairs or ‘twin peaks’ of clustered growth spikes. Energy considerations suggest reasons for these paired clusters of growth to be uneven in impact. The first peak should be less revolutionary in impact than the second because the first innovation wave must work within the prevailing economic landscape but the second wave has the advantage of building on the first wave's innovation set.
Since the leadership long cycle research program has focused primarily on the advent of technological innovation, adding energy considerations to the mix encourages an expansion of the focus to encompass resource acquisition and transportation activities as a fourth implication. Another implication of giving more attention to energy is the distinction between relative decline in production and export shares and achieving steady states in energy consumption. The steady state focus, in which periods of non-expansion of energy consumption predominate, may be more useful than focusing on, and debating, relative decline questions. This observation leads to a sixth implication in underlining the role of lead economies in leading the way through periods of energy transition and the development of reliance on new fuels. Steady states in energy consumption suggest that the gains from energy conversion processes have been maximized. New types of energy sources are needed to expand energy consumption. The next lead economy is likely to lead the way to the new types of energy sources.
Interpreting these processes in terms of energy acquisition and consumption makes it possible to link systemic leadership to ancient processes of development which helps to generalize the nature of the activities being examined. Further help in this regard is provided by a cosmological argument that energy consumption is the common denominator of the evolution of all natural processes. These last two implications reinforce the centrality of the pro-cesses focused upon and should help make the leadership long cycle research program seem less unorthodox overall – even while it proceeds from assumptions that are not widely accepted by scholars of world politics.
Before elaborating these implications further, it is probably helpful to first outline the leadership long cycle's perspective on Kondratieff waves (K-waves) and the role they play in the research program. Since they are an integral component to the overall theory, some of the associated components need to be introduced as well.
The K-Wave and the Leadership Long Cycle Argument[1]
Forty to sixty year Kondratieff waves (K-waves) are said to be driven by a host of different factors, including prices, technological innovation, energy transitions, demographic change, war, generational changes, investment, profits, and wages.2 No doubt, there is something to be said for all of these claims in that the rhythms of long-term economic growth tend to encompass multiple phenomena. We simply have failed to sort out all of the interrelationships adequately. Yet it is difficult to proceed on the assumption that everything is related to everything else (even if it is). The leadership long cycle argument makes a number of assertions about how hierarchy is established in global politics – one of which privileges clustered, radical innovations in technology as the principal driving force of the K-wave.3 This first set of assertions revolves around leading sectors which are industries built on radical innovations which have some potential of revolutionizing the way the economy is structured. Long-term growth is discontinuous and dependent on spurts in the development of these radical innovations. Radical innovations, in turn, generate new technology and industries characterized by high growth rates and alter the way old industries (characterized by slow growth rates) perform or, alternatively lead to their disappearance through Schumpeter's ‘creative destruction’ processes. Rapid growth on the part of the aggregate economy depends, of course, on the new, high growth sectors outperforming and more than offsetting the drag of the older, slow growth sectors.
It should be noted that these radical innovations are not simply a matter of the appearance of new hardware (Modelski 2001). Actors must learn how to cope with the implications of new technology and this takes time. Eventually, however, the effects become more routine as the new developments are assimilated, albeit unevenly around the world. Just how long this combination of hardware and perception process requires to work itself out, no doubt, is somewhat variable but probably approximates a generation. One generation is first exposed to the new technology and the following generation increasingly regards it as a routine way of doing things.
Initially, these leading sector trajectories were viewed as long waves or undulations of accelerated and slow economic growth. We have moved away from that conceptualization and now embrace the notion of a sequence of S-shaped growth curves. New sectors are introduced, grow quickly at first and then level off. Long-term economic growth is still subject to sequences of fast and slow growth but the underlying mechanism is the iterative introduction of new industries to replace old ones. Each new cluster of radical technological changes possesses an S-shaped trajectory that gradually flattens as its activities are perceived to become routine or even obsolete.
The introduction of radical innovations is monopolized by a single lead economy situated at or near the top of a global technological gradient on which the world's economies are organized hierarchically. At the bottom of the gradient, subsistence activities predominate. At the top, pioneering innovations for a time produce efficiency, productivity, and monopoly profits. The very frontiers of technology are extended with each radical innovation in the ways in which commodities are produced. Technological innovation, imitation, and highly uneven diffusion makes movement up and down the gradient conceivable, but not necessarily all that likely. But as some other economies catch up eventually in harnessing the new technologies, the lead economy loses its lead.
Lead economies experience at least two waves of innovation in a process referred to as the ‘twin peaks’ phenomenon. The first wave (ascent) pushes a new economy to the top of the technological gradient. This highly destabilizing outcome encourages increased conflict and global warfare fought primarily among the states with economies situated near the top of the gradient. Thanks in part to the surpluses gained in the ascent wave and the consequent ability to organize a winning coalition, the lead economy's victory in the ensuing conflict is made more probable. Its resources are applied to funding capabilities of global reach (naval power later supplemented by air and space power) and coalitions of land and sea powers to defeat the most threatening adversaries.
The innovation lead in the first wave, intensive mobilization during the intensive conflict, and global war victory all combined to facilitate the lead economy's development of a second wave of clustered innovations. Most allies and rivals that participated in the global warfare emerge exhausted. The exception is the lead economy that actually profits from the conflict and extend its predominance as the premiere commercial-industrial and power with global reach. After the global war has ended, the coalition leadership in the global war has increasingly segued into something resembling systemic leadership. Yet, it is also in this immediate postwar era that other advanced economies narrow the gap with the economic leader's position. If the leader's first wave is one of ascent, the second wave of the pair is thus a catch up wave. As the system leader's capability foundation experiences relative decline after a few decades, so too does its opportunity to lead systemically.
Two other distinctive assumptions of this Kondratieff wave interpretation are that: 1) the perspective is evolutionary and 2) the K-wave pattern began to emerge faintly as early as 10th century Sung China. No one argues that Kondratieff waves have been with us throughout recorded history. At some point, though, the long economic fluctuations with 40–60 year periodicity emerged. Only gradually were such processes likely to assume a shape that became easier to identify. In this case, the argument is that the first appearance of a paired K-wave pattern in economic innovations is found in the 10th century in Sung China which is sometimes credited with developing the first economy with modern, industrialized features. Most importantly, the expansion of maritime trade in the South China Sea and the Indian Ocean, as well as the revived use of the Silk Roads on land, facilitated the transmission of long term, paired growth impulses to the other end of Eurasia via Venetian and Genoese intermediaries. Many of the economic innovations that later characterized western commercial and industrialized successes can be traced back to Chinese practices (Modelski and Thompson 1996; Hobson 2004). It is possible, therefore, to analyze 9 twin peaked processes or 18 K-waves encompassing some one thousand years between 930 and 1973 (Modelski and Thompson 1996). Obviously, the claim that there have been as many as 19 k-waves, counting the one that still seems to be in progress, is a major departure from K-wave convention. But there is no insistence that each set was as fully manifested as more recent ones. The K-wave process emerged only gradually and became most evident only in the past few centuries – a subject to which we will return.
No assumption is made that either technological change or capitalism suddenly emerged after the British industrial revolution. Both were amply exhibited for thousands of years, especially in activities involving long-distance commerce. But it was necessary to break free of economies dominated by relatively slow-moving agricultural dynamics fixated on interactions between climate, resource endowments, and population size. Early Chinese industrialism and commerce took a step in that direction. The process was aided and abetted subsequently by trading state behavior conducted by small Italian city-states and Portugal after the early Chinese experiment failed.4 Dutch, British, and U.S. innovations in commerce and industrialization of the past three to four centuries have contributed further to the increasing strength of long-term technological change rhythms.
Table 1 lists the lead economy history. Two Chinese (Northern and Southern Sung), two Italian (Genoa and Venice), a Portuguese, a Dutch, two British, and at least one U.S. set of paired innovation spurts are claimed. The radical innovations initially were largely focused on the development of the Chinese ‘national’ economy but not exclusively because trade's significance rose in the Southern Sung era. Thereafter, the emphasis shifted to commercial innovations through the 14th K-wave and industrial innovation courtesy of the British Industrial Revolution. The intention of the table is not to capture comprehensively everything that changed in each iteration but to draw attention to some of the more illustrative and profound changes around which each K-wave was focused.
Table 1. Leading sector timing and indicators, 15th to 21st centuries
|
Lead Economy |
Leading Sector Indicators |
Start-up Phase |
High Growth Phase |
|
1 |
2 |
3 |
4 |
|
Portugal |
Guinea Gold |
1430–1460 |
1460–1494 |
|
|
Indian Pepper |
1494–1516 |
1516–1540 |
|
|
|
|
|
|
Netherlands |
Baltic and Atlantic Trade |
1540–1560 |
1560–1580 |
|
|
Eastern Trade |
1580–1609 |
1609–1640 |
|
|
|
|
|
|
Britain I |
Amerasian Trade (especially sugar) |
1640–1660 |
1660–1688 |
|
|
Amerasian Trade |
1688–1713 |
1713–1740 |
|
|
|
|
|
|
Britain II |
Cotton, Iron |
1740–1763 |
1763–1792 |
|
|
Railroads, Steam |
1792–1815 |
1815–1850 |
Table 1 (continued)
|
1 |
2 |
3 |
4 |
|
United States I |
Steel, Chemicals, Electronics |
1850–1873 |
1873–1914 |
|
|
Motor Vehicles, Aviation, Electronics |
1914–1945 |
1945–1973 |
|
|
|
|
|
|
United States II? |
Information Industries |
1973–2000 |
2000–2030 |
|
|
? |
2030–2050 |
2050–2080 |
One outcome of this pattern of economic leadership, seemingly new to the last millennium, is the development of a global system increasingly focused on the operations and management of long distance or inter-regional trade. This global system, initially Eurasian in scope and eventually planetary wide, functioned simultaneously with the more delimited foci of various regional systems. At the head of the global system (but not necessarily any of the various regional systems) is the lead economy that surges ahead of its competitors and rivals in an ascent K-wave only to find itself in an intensive bout of global warfare of generation length. Interestingly, while periods of conflict are found in the earlier paired sets of K-waves, successive rounds of global warfare only emerged halfway through the millennium in the 1490s. Western Europe was both multipolar and characterized by repeated and unsuccessful attempts, unlike most other regions, to acquire regional hegemony that were seen as being renewed in the 1490s.5 As a consequence, global wars have combined and fused attempts of continental powers to assume European hegemony with disputes over leadership at the global level. This process presumably ended in 1945 but could be transplanted to East Asia in the 21st century.
Ultimately, the K-wave process does not establish world hegemony for the state possessing the lead economy. Rather, it propels the lead economy into the status of being the leading political-military-economic actor of a global system focused on long distance transactions, in marked distinction to regional power structures and attempts at territorial expansion in the home region. There is no need to equate the systemic leadership of Portugal in the 16th century with that of the United States in the second half of the 20th century beyond the minimal standard that both states established themselves as the leaders in global (i.e. interregional) economic innovation in their respective eras. The U.S. lead in 1945 was much greater in scope than the lead established by Portugal in 1517. Therefore, it is hardly surprising that the United States had a much stronger impact on shaping the postwar institutions of world order (as symbolized by the Bretton Woods package of the Generalized Agreement on Trade and Tariffs [GATT], the International Monetary Fund [IMF], and the United Nations [UN]) than did Portugal in the early 16th century.6 In neither case was the system leader hegemonic. In both cases, the system leader had variable opportunities to shape the rules governing global system transactions.
The tripartite systemic leadership platform – leading sector growth (growth rates of leading sectors in the lead economy), leading sector share concentration (the lead economy's share of leading sector production among global powers), and global reach capability concentration (naval capability share) – is interrelated reciprocally. Leading sector growth leads to leading sector share concentration and global reach capabilities. Higher levels of global reach capabilities facilitate leading sector growth and leading sector share concentration. Yet, leading sector growth and share concentration also lead to military mobilization on land as well as at sea.
We have shown empirically (Reuveny and Thompson 2001, 2004) that the system leader's leading sector growth has been a systematic driver of the system leader's aggregate or national economic growth. Both of these variables, in turn, affect world economic growth positively while world economic growth influences the system leader's leading sector and national growth negatively. In some respects, then, the system leader is negatively affected by its own success. Its innovations contribute to world economic growth but as other economies improve their technological development, the advantageous position of the system leader is reduced.7
Eight Implications
Given the perspective outlined above, what might increasing the role of energy issues offer? Examining energy flows more closely should have payoffs for studying long economic waves or, more accurately, successive ‘S’-shaped technological growth trajectories. This is the first implication of incorporating energy into the leadership long cycle perspective. Smil (1994; see also Marchetti 1977), for instance, observes a close correspondence among Mensch's (1979) innovation cluster peaks, Schumpeter's peaks and troughs, and the introduction of new prime movers and fuels. Outlined in Table 2, Smil notes that each Kondratieff upswing was strongly influenced by the introduction of either new engines and new fuels, or both. The timing of these same early adoptions match the peaks of Mensch's (1979) innovation clusters (i.e. 1828 vs. 1830, 1880 vs. 1882, and 1937 vs. 1945) and the timing of Schumpeterian long wave trough centerpoints (1827 vs. 1828 and 1830, 1883 vs. 1882 and 1880, 1937 vs. 1945 and 1937). The midpoints of the Schumpeterian upswings are also roughly the midpoints of the prime mover/fuel eras. Smil regards this particular correspondence as more support for Mensch's argument that economic depressions stimulate new innovation waves.8
Table 2. Energy shifts and economic long waves, 1775–1990
|
Mensch Innovative Clusters Peaks |
Schumpeterian Troughs |
New Prime Movers and Fuels |
Schumpeterian Peaks |
|
|
|
Stationary Steam Engines 1775–1830 [coal] |
1800 |
|
1828 |
1827 |
|
|
|
|
|
Mobile Steam Engines 1830–1882 [coal] |
1856 |
|
1880 |
1883 |
|
|
|
|
|
Steam Turbines and Internal Combustion Engines 1882–1945 [coal and crude oil] |
1911 |
|
1937 |
1937 |
|
|
|
|
|
Gas Turbines 1945–1990 [coal, crude oil, and natural gas] |
1962 |
|
|
1990 |
|
|
Source: Columns 1, 2, and 4 are based on Smil (1994: 240) who, in turn, drew on Mensch (1979) and Schumpeter (1939) for the peak and trough dates.
Finally, Smil also notes that a large number of the leading corporations in each prime mover era specialize in producing the new prime movers and associated fuels. Thus, the correspondences observed in Table 2 are hardly mysterious. Corporate activity provides the agency that links technological innovation and economic contraction and expansion. It is interesting to note, moreover, that Table 2 implicitly addresses the earlier implication about varied beats of the paired Kondratieffs. Focusing on the first column, the 1775–1830 period emphasized stationary steam engines while the 1830–1882 period stressed mobile steam engines, as found in trains and ships. The 1882–1945 period introduced internal combustion engines and steam turbines while the 1945–1990 period ushered in gas turbines. Note that engine power is substantially greater in the second period as compared to the first period when we look at these four eras as two sets of paired upswings.9
Nakicenovic (1991) sees these shifts (see Table 3) as substitution waves, with new technologies initially emerging in one era and becoming dominant in the next only to be supplanted by something else in a subsequent period. Precisely what comes next remains unclear. Natural gas sources of energy seems the most likely candidate at present but some mix of different sources will no doubt prevail. Which ones (or which mix) are selected will depend ultimately on changes in technology that make these alternative sources more reliable, safer, and less expensive.
Table 3. Clusters of pervasive technologies and substitution waves
|
Period |
1750–1820 |
1800–1870 |
1850–1940 |
1920–2000 |
1980–2060 |
|
Dominant Systems |
Water power, sails, turnpikes, iron castings, textiles |
Coal, canals, iron, steam power, mechanical equipment |
Railways, steam ships, heavy industry, steel, dyestuff, telegraph |
Electric power, oil, cars, radio, TV, durables, petro-chemicals |
Gas, nuclear, aircraft, telecomm., information, photo-electronics |
|
Emerging Systems |
Mechanical equipment, coal, stationary steam, canals |
Steel, city gas, indigo, telegraph, railways |
Electricity, cars, trucks, radio, roads, oil, telephone, petrochemicals |
Nuclear power, computers, gas, tele-communication, aircraft |
Biotech., artificial intelligence, space industry and transport |
Source: Based on Nakicenovic (1991: 486).
The Smil and Nakicenovic tables, however, are suggestive about the role of energy transitions in the K-wave process. An energy transition is ongoing but not all that well advanced. It may take place later in the century and we think the hydrocarbon era is coming to an end but what will replace it remains vague. Substitution is ongoing slowly. No new fuels or engines (unless computers are seen as engines of a different kind) are yet evident either. If these generalizations are accurate, several possibilities are conceivable. If energy shifts have become a necessary part of the Kondratieff wave and have stalled for various reasons, does that portend parallel distortions to the shape of the current K-wave? The Sussex school (see, e.g., Freeman and Perez 1988) argues that economic depressions result when there are delays in moving from one phase to the next due to the need to overcome resistance or obstacles to the next cluster of innovations. The current, protracted energy transition ultimately may come to be seen as such a delay.
Alternatively, it may be that two energy transitions (first to coal and then to petroleum) were part of the K-wave history with fairly profound implications but that did not mean that energy shifts, at least in terms of fuels and engines, has become absolutely necessary to substitutions in clustered technology. Information technology, widely presumed to underlay contemporary technological changes, represents a different type of energy shift that may prove to be as difficult to assess while it is still ongoing as the shifts to coal and petroleum no doubt were.
The second implication follows from the first one. We discern 19 K-waves going back to the 10th century and Sung China. Roughly, most of the first two-thirds of this process was caught up in making use of wind for long-distance oceanic voyages which were carried out by relatively small states located on the fringe of Europe (Genoa, Venice, Portugal, the Netherlands, Britain). The voyages were profitable but harnessing wind was hardly new. The real innovations were focused on ship building (Venice, the Netherlands), improving navigations skills, or finding new routes (the Netherlands) to the Spice Islands. As impressive, profitable, and revolutionary for their time as these Asian and American trade connections were, they still seem to suffer in comparison with the revolutionary implications of new ways to manufacture products that were developed in the second half of the 18th century. One obvious explanation for this disjuncture is that an energy transition began in the late 18th century that substantially reinforced the impact of the Kondratieff process. From an evolutionary perspective, constant relationships are unlikely. Instead, they evolve over time, with some growing stronger and others becoming weaker. In this case, major energy transitions in the late 18th through early 20th centuries served to intensify the effects and consequences of clustered technological innovations.10 The technological frontier was extended even more radically than in the past.
Another implication of giving more emphasis to the energy-technological innovation nexus is the nature of the twin peak phenomena. System leaders have tended to experience leads in innovation in sequential bursts of two upsurges, depicted in Table 4, that are separated by periods of global warfare. Hitherto, we have treated these paired innovation upsurges as equal. But in the context of interactions with energy, it takes time to transform the nature of energy conversion practices. As a consequence, the first burst in innovation tends to work within the prevailing economic landscape. The innovations may be radical but they are less likely to transform the economy to the full extent imaginable. The second one has the benefit of the earlier surge's changes and should be more revolutionary in its implications for how economic production is accomplished. Hence, the anticipated beat should not be 1–1 but, perhaps, something more like 1–1.5–2, with the second wave having a greater impact than the first.
Table 4. The twin peak timing of leading sector growth surges and global war
|
First High Growth Surge |
Global War |
Second High Growth Surge |
|
Portugal |
|
|
|
1460–1494 |
1494–1516 |
1516–1540 |
|
Netherlands |
|
|
|
1560–1580 |
1580–1609 |
1609–1640 |
|
Britain |
|
|
|
1660–1688 |
1688–1713 |
1713–1740 |
|
1763–1792 |
1792–1815 |
1815–1850 |
|
United States |
|
|
|
1873–1914 |
1914–1945 |
1945–1973 |
This differential beat rhythm is not a fact – merely a hypothesis taken and generalized from Griffin (2010: 123) who argues for a slow start for the British industrial revolution given the organic environment in which it began. She notes that the initial innovations relied on organic resources (horses, charcoal, and water) and then came to depend increasingly on inorganic resources (coal extracted from under the soil) with greater productivity as a result in a second surge. It may be that this differential beat is more discernible in more recent innovation surges. Nonetheless, the logic might well fit earlier growth surges too. Consider the Portuguese first growth surge based on West African pepper, slaves, and silver. Only in the second wave did the Portuguese enter the Indian Ocean. Or, the first Dutch growth surge was focused on its traditional Baltic trade. It is the second wave that is linked to the Dutch penetrating the Indian Ocean and the Spice Islands.11 The initial 18th century British lead was predicated on its transportation of Asian products while the second wave was more focused on American production (e.g., sugar and tobacco). It does not seem unwarranted to regard the first surge in the set to be more constrained by the environment in which the innovations occur in comparison to the second surge which can build on the first.
Incorporating energy obviously expands the focus on what lead economies need to do. This fourth implication is sketched in fig. 1. Energy must have a source that can be tapped in some systematic matter.12 Extraction and transportation from the source to production sites, therefore, becomes an important set of routines for the system leader either directly or indirectly. The focus on production sites (and commercial entrepots) is long standing and has been manifested in looking at sequences of pioneering and monopolizing leading sectors for periods of time. More storage and transportation of goods to their respective markets is the next step, followed by consumption, market share considerations, and waste associated with consumption.
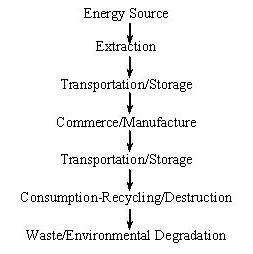
Fig. 1. Energy flows
The leadership long cycle research program has focused primarily on the middle of this energy flow process, although the stress on naval power underlines the need for coercive protection of the two transportation links in the flow. Moreover, naval navigation hardware (compasses, rudders, and so forth) have also been standard foci (Devezas and Modelski 2008). But, fortunately, Bunker and Cicantell (2005, 2007) have already analyzed the extraction-transportation and manufacture-transportation links. They do not look at what is manufactured; rather, they stress obtaining raw materials and building a transportation infrastructure. What is needed then is a synthesis of their model, perhaps subject to modifications, into the leadership long cycle perspective. Waste is not exclusively a function of lead economy manufacture and consumption but it is likely to be a major, if not the major, source of problems associated with waste and, its corollary, environmental pollution. Were we to combine the production and consumption efforts of the lead economy and its main rivals, a lion's share of the generation of global wastes can be attributed to a small number of elite economies. Certainly, the lead economy is also a leader in waste and pollution production. Waste disposal and environmental degradation thus also become grist for the extended analytical mill.13
A fifth implication of giving more emphasis to energy is that some of the uncertainties of assessing relative decline may be eliminated. There are at least two problems that are affected. One is that it is remarkably difficult for most observers to distinguish between absolute and relative decline. Seeing no or little absolute decline, the popular reaction is what decline? Per capita income, for instance, falls in absolute decline phases but it is likely to improve in periods of relative decline. Without a clear impact on the quality of life, the notion of relative decline seems highly abstract. Relative decline is also difficult to gauge and even more difficult to assess in terms of its meaning. System leaders can enter into relative decline almost from the onset of their periods of predominance. Even so, any initial relative decline is apt to move very slowly and only pick up speed much later as competitors manage to catch up and perhaps surpass the former leader. When other states and economies do transit past the incumbent leader, the relative decline becomes obvious. Before the point of transition, it is more nebulous even when many indicators point in the same direction.
The second problem lies with interpreting relative decline once it is recognized. How much decline makes a significant difference? If a system leader's lead diminishes by 10 percent, is that huge, modest, or minor? Of course, that assessment must be contingent on the size of the gap between a leader and its followers. The greater is the size of the gap, the more room there is for relatively insignificant decline. But we have no practice in working out a metric that tells us when relative decline has reached significant proportions and when it has yet to pass some threshold mark. That has been especially the problem with interpreting U.S. relative decline. Its initial lead was quite commanding. Its rate of decline has been slow. It continues to possess a number of advantages over its rivals. Thus, it is not surprising that observers disagree contemporaneously about whether any decline has occurred.
One of the advantages of inputting more energy into the technological innovation box is that there is less emphasis on decline and more stress on attaining a steady state phase. Ascending economies tend to increase their consumption of energy. But at some point their increasing consumption levels off due to a combination of greater energy efficiency practices and reaching a point of optimal production given the types of energy sources that are available. The attainment of the phases of steady state energy consumption are quite clear in the British and U.S. cases.
Fig. 2 charts British consumption per capita as reported in Humphrey and Stanislaw (1979).14
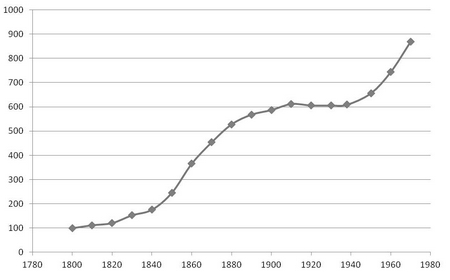
Fig. 2. British energy consumption per capita, 1800–1970
Not shown in Fig. 2 are estimates for the 18th century that suggest that energy consumption roughly doubled between 1700 and 1800 (47 to 100 on the index). Between 1800 and 1900, the increase in consumption per capita was nearly five fold (100 in 1800 to 587 in 1900). The series peaked around 1910 and then went flat through World War II before beginning to ascend once again. The more contemporary (post-World War II) ascent, however, is associated with changes in fuel sources in a second energy transition. The flattening in the first half of the 20th century (and de-accelerating in the latter 19th century) presumably reflects the waning years of coal dependence as the principal fuel source, along with declining manufacturing activity.
Fig. 3 plots U.S. energy consumption per capita in million BTUs.15 Between 1950 and 1975, there was a 47 percent increase (227 in 1950 to 333 in 1975). The series peaks in 1980 at 344 and stays flat through 2005, before declining in 2009. This last decline presumably reflects the global financial meltdown and losses in economic production and is thus likely to be temporary. Yet, overall, the series appears to have flattened from the 1970s on. As in the British case, there are multiple factors at work, including declining manufacturing demands and increased efficiency, but the combination of the two figures suggests that the flattening in Fig. 3 probably also reflects the waning years of the petroleum energy regime and the attainment of a steady state status in terms of energy consumption.16
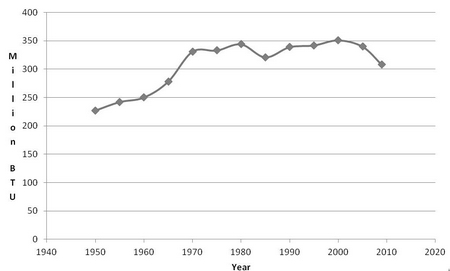
Fig. 3. U.S. energy consumption per capita, 1950–2009
In this vein, LePoire (2008: 215) suggests that a transition to Chinese leadership is a long way off. Chinese energy consumption is very large but on a per capita basis is only about 10 percent of the U.S. usage. That would imply that any plot of Chinese per capita consumption would show a positive trend perhaps for a number of years into the first half of the 21st century, other things being equal, but still not catching up to the leader. The other interesting facet of Chinese consumption is that has been heavily dependent on coal and will probably continue to be reliant on coal through at least 2050.
From these observations, one might infer that U.S. relative decline may easily be exaggerated, as are concerns about a transition to Chinese leadership in the near future. The real question from an energy perspective is which economy or economies will lead the way in replacing petroleum, especially in terms of automobile propulsion. Since we are in the very early stages of that movement, it is probably much too soon to tell – but it hints at what we might pay most attention.
The sixth implication is that leadership and energy transitions appear to have become increasingly intertwined. It makes sense that if lead economies are the vanguard of new and increased energy supply and consumption, they would also be an important agent in ushering in new eras of energy use. This tendency did not emerge full-blown with the advent of lead economies. Only the last two lead economies, Britain and the United States, have been involved so far in the transitions depicted in Fig. 4.
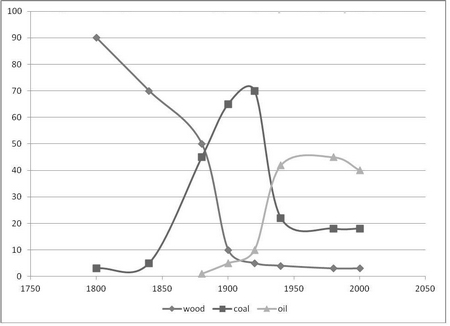
Fig. 4. Energy transitions in the United States
Britain led the shift to coal and competed intensely with the United States for control of petroleum reserves in the interwar years (Hugill 2011). By the beginning of World War II, the United States controlled some 50 percent of the world's then known petroleum sources (Thompson 2007a).
It follows then that when we are speculating about leadership transition, it is not enough to simply look for innovation in a new wave of gadgets. We should also be looking for leadership toward a new era of energy use in which movement away from reliance on hydrocarbon sources is part of the pattern. In other words, the next lead economy will probably be the vanguard of employing alternative sources of energy – whether it be nuclear, solar, wind, natural gas, or some combination. It may also be that one reason for leadership transition is some inherent disadvantage in making the transition to the next era. Britain, for instance, was heavily committed to coal, did not possess large petroleum reserves at home, and was slow to make the switch to electricity. Given the pronounced U.S. reliance on petroleum, we may find that economies that are less dependent thanks to a lower level of development will encounter less inertia and resistance in the movement toward new energy sources.17 Alternatively, the next lead economy is likely to need to have ample access to relatively inexpensive energy resources. The question may then hinge on the distribution of resource endowments.
Recognizing systemic leadership as a vanguard of new energy consumption practices creates opportunities to link contemporary processes to both ancient and cosmological processes. Early centers of ‘civilization’ developed similar resource acquisition networks and innovated novel ways to expand the supply of energy by building and maintaining irrigation canals and other ways to control water use. Sumer, the initial lead economy, is the example par excellence. What lead economies do is a more modern extension of older and even ancient political-economic practices and processes. We need to appreciate the continuity and to build on it analytically.
If a stronger connection to ancient developments is the seventh implication, an eighth is an intriguing link to a cosmological argument. Chaisson (2001: 120) contends that the ‘emergence, growth, and evolution of intricately complex structures’ is keyed to energy flows and governed by thermodynamic principles:
Nature's many ordered systems can now be regarded as intricately complex structures evolving through a series of instabilities. In the neighborhood of a stable (equilibrium) regime, evolution is sluggish or nonexistent because small fluctuations are continually damped; destruction of structure is the typical behavior wherein disorder rules. By contrast, near a transition (energy) threshold, evolution accelerates and the final state depends on the probability of creating a fluctuation of a given type. Once this probability becomes appreciable, the system eventually reaches a unique though dynamic steady state, in which construction of structure wherein order rules is distinctly possible. Such states are thereafter starting points for further evolution to other states sometimes characterized by even greater order and complexity (Chaisson 2001: 78).
This argument (see also Adams 1975, 1982, 2010; Spier 2005, 2010) reflects a general theory of the evolution of complexity in all processes predicated on energy consumption. All ‘natural entities’, spanning physical, biological, and cultural phenomena, extract energy for survival, maintenance and reproductive purposes or, alternatively, put for resisting entropy. Greater complexity is achieved by tapping into greater quantities of matter and energy. Table 5 offers a representative list of the ‘free energy rate density’ – an index of the amount of energy available per unit of mass – of various types of structures. All of these entities take energy from their environment to continue functioning. We are most familiar with our own participation in this fundamental process. Food allows us to live. Without food energy, we die. So it is with all other entities.18
Table 5. Some representative, estimated free energy rate densities
|
Structure |
Average Densities |
|
Galaxies |
0,5 |
|
Stars |
2 |
|
Planets |
75 |
|
Plants |
900 |
|
Animals |
20,000 |
|
Human brains |
150,000 |
|
Society |
500,000 |
Note: The densities are expressed in erg units of energy per time per mass.
Source: based on Chaisson (2001: 139).
The attractiveness of this interpretation for our own purposes is that it provides a different way to view human efforts to improve their existence and quality of life. The basic process is one of energy acquisition and the expansion of how much energy is acquired. One way to look at the evolution of technological innovation, then, is the development of ways to convert various types of matter into successively greater amounts of energy to fill sails, to spin cotton or to drive automobiles and air conditioners. This process, over time, has moved along at different rates but is similar from the expansion of Sumer's resource acquisition network in the fourth millennium BCE to contemporary competitions to find ways to move automobiles by electricity or to convert solar energy into electricity. Political economies become successively more complex as energy densities are increased. But the process of acquiring and harnessing more and more sources of energy is not characterized by widespread innovation. It tends to occur first in one place and diffuse unevenly to other places that are in a position to emulate and, often, to improve on the initial innovations.19
This basic pattern of pioneering innovations subject to uneven diffusion has structured long-term economic growth and is most clearly discernible in the Sung-Genoa-Venice-Portugal-Netherlands-Britain-United States succession in pioneering lead economies in the modern era of the last millennium. But it is not just successive clusters of innovation that is involved but also successive increases in the flow of energy acquired and energy density. The ability to convert sources of energy into successive advances in transportation and production is what long-term economic growth is all about.20 Lead economies are thus principal agents in generating new drivers for economic development and growth. We should expect each successive leader to be associated with increased free energy rate densities. The leadership long cycle research program is organized very fundamentally around this insight. If the core process being examined also fits into a larger picture of parallel patterns in growth and development from the Big Bang on, so much the better. It reinforces the belief that the research program is on the right track. At the same time it also broadens and helps to justify lengthening the track on which the research program proceeds.
Technological innovation is about many things. The argument here is not that we scrap what has been said previously about the linkages between innovation and world politics. Rather, we need to broaden the nature of the inquiry by integrating energy considerations into the long cycle weave. The two perspectives are complementary because technological innovation and energy have been highly interdependent. Greater integration should enhance our understanding of both energy, the K-wave phenomenon, and processes of world politics.
References
Adams R. N. 1975. Energy and Structure: A Theory of Social Power. Austin, TX: University of Texas Press.
Adams R. N. 1982. Paradoxical Harvest: Energy and Explanation in British History, 1870–1914. Cambridge: Cambridge University Press.
Adams R. N. 2010. Energy, Complexity and Strategies of Evolution: As Illustrated by Maya Indians of Guatemala. World Futures 66: 470–503.
Allen R. C. 2006. The British Industrial Revolution in Global Perspective: How Commerce Invented the Industrial Revolution and Modern Economic Growth. URL: http://www. Nuffield.ox.ac.uk/users/allen/unpublished/econinvent-3.pdf.
Boswell T., and Chase-Dunn C. 2000. The Spiral of Capitalism and Socialism: Toward Global Democracy. Boulder, CO: Lynne Rienner.
Bunker S. G., and Ciccantell P. S. 2005. Globalization and the Race for Resources. Baltimore, Md: Johns Hopkins University Press.
Bunker S. G., and Ciccantell P. S. 2007. East Asia and the Global Economy: Japan's Ascent, with Implications for China's Future. Baltimore, Md: Johns Hopkins University Press.
Chaisson E. J. 2001. Cosmic Evolution: The Rise of Complexity in Nature. Cambridge, Ma: Harvard University Press.
Chaisson E. J. 2005. Epic of Evolution: Seven Ages of the Cosmos. New York: Columbia University Press.
Chase-Dunn Chr., and Hall Th. D. 1997. Rise and Demise: Comparing World-Systems. Boulder, Co: Westview Press.
Devezas T. C., and Corredine J. T. 2001. The Biological Determinants of Long-Wave Behavior in Socioeconomic Growth and Development. Technological Forecasting and Social Change 67: 1–57.
Devezas T. C., and Modelski G. 2008. The Portuguese as System-Builders: Technological Innovation in Early Globalization. Globalization as Evolutionary Process: Modeling Global Change / Ed. by G. Modelski, T. C. Devezas, and W. R. Thompson, pp. 30–57. London: Routledge.
Freeman Chr., and Louca F. 2001. As Time Goes By: From the Industrial Revolution to the Information Revolution. Oxford: Oxford University Press.
Freeman Chr., and Perez C. 1988. Structural Crises of Adjustment, Business Cycle, and Investment Behavior. Technical Change and Economic Theory / Ed. by G. Dosi, Chr. Freeman, R. Nelson, G. Silverberg, and L. Soete, pp. 38–66. London: Pinter.
Freeman Chr., and Soete L. 1997. The Economics of Industrial Evolution. 3rd ed. Cambridge, Ma: MIT Press.
Goldstein J. 1988. Long Cycles. New Haven, Ct: Yale University Press.
Goldstone J. A. 2002. Efflorescences and Economic Growth in World History: Rethinking the ‘Rise of the West’ and the British Industrial Revolution. Journal of World History 13(2): 323–389.
Griffin E. 2010. A Short History of the British Industrial Revolution. New York: Palgrave-Macmillan.
Hobson J. M. 2004. The Eastern Origins of Western Civilization. Cambridge: Cambridge University Press.
Humphrey W. S., and Stanislaw J. 1979. Economic Growth and Energy Consumption in the UK, 1700–1975. Energy Policy 7(1): 29–42.
Hugill P. J. 2011. The World Struggle for Oil: The Type II Transition Struggle between Britain and America. Paper presented at the annual meeting of the International Studies Association. Montreal, Canada, March.
Keohane R. O. 1984. After Hegemony: Cooperation and Discord in the World Political Economy. Princeton, NJ: Princeton University Press.
Korotayev A. V., and Tsirel S. V. 2010. A Spectral Analysis of World GDP Dynamics: Kondratieff Waves, Kuznets Swings, Juglar and Kitchen Cycles in Global Economic Development, and the 2008–2009 Economic Crisis. Structure and Dynamics: eJournal of Anthropological and Related Sciences 4(1): 1–55.
LePoire D. J. 2009. Exploration of Connections between Energy Use and Leadership Transitions. Systemic Transitions: Past, Present, and Future / Ed. by W. R. Thompson, pp. 205–222. New York: Palgrave-Macmillan.
Marchetti C. 1977. Primary Energy Substitution Models: On the Interaction between Energy and Society. Technological Forecasting and Social Change 10: 345–356.
Mensch G. 1979. Stalemate in Technology. Cambridge, Ma: Ballinger.
Modelski G. 2001. What Causes K-Waves? Technological Forecasting and Social Change 68: 75–80.
Modelski G., and Thompson W. R. 1996. Leading Sectors and World Powers: The Coevolution of Global Politics and Economics. Columbia, SC: University of South Carolina Press.
Nakicenovic N. 1991. Diffusion of Pervasive Systems: A Case of Transport Infrastructure. Diffusion of Technologies and Social Behavior / Ed. by N. Nakicenovic, and A. Grubler, pp. 483–510. Berlin: Springer-Verlag.
Perez C. 2002. Technological Revolutions and Financial Capital: The Dynamics of Bubbles and Golden Ages. Cheltenham: Elgar.
Rasler K., and Thompson W. R. 1994. The Great Powers and Global Struggle, 1490–1990. Lexington, KY: University Press of Kentucky.
Rennstich J. K. 2008. The Making of a Digital World: The Evolution of Technological Change and How It Shaped Our World. New York: Palgrave Macmillan.
Reuveny R., and Thompson W. R. 2001. Leading Sectors, Lead Economies, and Their Impact on Economic Growth. Review of International Political Economy 8(4): 689–719.
Reuveny R., and Thompson W. R. 2004. Growth, Trade and Systemic Leadership. Ann Arbor, MI: University of Michigan Press.
Schumpeter J. A. 1939. Business Cycles: A Theoretical and Statistical Analysis of the Capitalist Processes. New York: McGraw-Hill.
Smil V. 1994. Energy in World History. Boulder, Co: Westview.
Spier F 2005. How Big History Works: Energy Flows and the Rise and Demise of Complexity. Social Evolution & History 4(1): 87–135.
Spier F. 2010. Big History and the Future of Humanity. London: Wiley-Blackwell.
Thompson W. R. 1990. Long Waves, Technological Innovation, and Relative Decline. International Organization 44: 201–33.
Thompson W. R. 2007a. Global War and the Foundations of U.S. Systemic Leadership. America. War and Power, 1775–2000 / Ed. by J. Fuller, and L. Sondhaus, pp. 146–168. New York: Routledge.
Thompson W. R. 2007b. The Kondratieff Wave as Global Social Process. World System History, UNESCO Encyclopedia of Life Support Systems / Ed. by G. Modelski, and R. A. Denemark. Oxford: EOLSS Publishers. URL: http://www.eolss.net
Thompson W. R. 2010. Synthesizing Secular, Demographic-Structural, Climate, and Systemic Leadership: Moving toward Explaining Domestic and World Politics in the Last Millennium. Cliodynamics: The Journal of Theoretical and Mathematical History 1(1): 26–57.
Thompson W. R., and Reuveny R. 2010. Limits to Globalization and North-South Divergence. London: Routledge.
Vries J. de, and Woude A. van der. 1997. The First Modern Economy: Success, Failure and Persistence of the Dutch Economy, 1500–1815. Cambridge: Cambridge University Press.
2 See, for instance, Goldstein (1988) and Thompson (1990) for a discussion of the multiple Kondratieff wave interpretations. More recent variations include Devezas and Corredine (2001), and Rennstich (2008).
3 It shares the Schumpeterian emphasis on clustered, radical innovations with the Sussex school (Freeman and Louca 2001; Freeman and Perez 1988; Freeman and Soete 1997; Perez 2002) and Boswell and Chase-Dunn (2000).
4 Part of China's problem was its distinctive threat environment and long struggle with nomadic attacks. The Mongols were able to defeat Sung China in part by using some of its technological innovations against the Chinese.
5 Rome, of course, had successfully unified most of what later became Western Europe but this early success was more a product of Mediterranean politics than it was ‘European’ politics. That is, Rome conquered the Mediterranean world and, in the process, peripheralized much of Europe to its empire centered in Italy.
6 Portugal essentially created a protection racket regime in the western end of the Indian Ocean in which traders paid taxes to the Portuguese to be allowed to trade. The Portuguese could aspire to little more since their technological edge resided in ocean-going ships with cannon, as opposed to commodities that could be exchanged for Asian goods.
7 There are a number of other generalizations that can be made and that have been validated empirically about how the systemic leadership foundation influences other systemic processes, ranging from protectionism to the North-South cleavage (see Rasler and Thompson 1994; Reuveny and Thompson 2004; Thompson and Reuveny 2010).
8 See as well Freeman's Sussex School emphasis (e.g., Freeman and Perez 1988) on the key ingredients that will drive successive long waves. Most have an energy basis. At the same time, it should be noted that there is no standardization of K-wave periodicity as yet. Authors put forward approximations that sometimes overlap and sometimes do not. For instance, the Schumpeterian peaks in 1800 and 1856 in Table 2 do not exactly correspond to the relevant leadership long cycle high growth phases of 1763–1792 and 1815–1850. The 1911 and 1962 Schumpeterian peaks, though, do correspond with the 1873–1914 and 1945–1973 phases.
9 Of course, each successive era also represents an expansion of engine power over the preceding era as well.
10 A number of efforts to model K-waves based on aggregate data have been made without a great deal of success. Part of the problem is relying on the aggregate data but another part may be that the K-wave activity simply becomes more regular and therefore empirically discernible as we move toward the current period (see, e.g., Korotayev and Tsirel [2010]).
11 However, there are also strong incentives to re-examine Dutch energy utilization of peat and windmills. De Vries and Van de Woude (1997) make a good case for calling the 17th century Netherlands the first modern economy.
12 Keohane (1984: 32) argues that hegemons must control raw materials in addition to capital, markets, and competitive advantages in production. Once I thought a definitional emphasis on resource control was wrong but as long as the raw materials are focused on energy sources, I would now agree.
13 Dealing with environmental degradations could well become a leading sector of the 21st century. See as well Chase-Dunn and Hall's (1997) iteration model and subsequent revisions that include environmental degradation as a function of economic productivity.
14 Humphrey and Stanislaw focus on mineral fuels and hydro-power and normalize their series in terms of 1800 = 100.
15 The data are taken from the U.S. Energy Information Administration's Annual Energy Review, 2008 – see table 1.5 (Energy Consumption, Expenditures, and Emissions Indicators, Selected Years, 1949–2009), URL: http://www.eia.doe.gove/aer/pdf/pages/sec1_13pdf.
16 A related issue is the quite significant extent to which U.S. trade deficits are expanded by petroleum imports.
17 One area worth more exploration are the implications of the system leader's dependence on weapons platforms developed in earlier global warfare but also reflecting a dependence on the prevailing energy regime. The commitment to petroleum fueled, 20th century ships, tanks, and planes well into the 21st century would seem to be a good example.
18 One interesting hypothesis is whether each successive lead economy is associated with significant improvements in the free energy rate density.
19 There are certainly exceptions to this pattern. Agriculture, for instance, was invented independently in multiple places.
20 LePoire (2009: 217) offers an interesting frame on this problem by arguing for viewing history as a complex adaptive process in which succeeding phases of energy intensification over time have led to greater complexity. He thinks the succeeding phases are recognizable in five-fold expansions in energy intensity and dates them as follows: civilization (3000 BCE–400 CE), commerce (700–1720), industrialization (1720–1950), and knowledge-based (1950–?).