Ethnic Transformation of European Societies by Immigration

Almanac: History & Mathematics:Political Demography & Global Ageing.
Abstract
This article discusses the implications of recent trends and projections of the ethnic or foreign-origin populations of selected European countries. If their composition continues to change as projected, a radical and irreversible ethnic and social transformation will take place by the end of the century. The consequent displacement of the original population from numerical predominance, and its possible relegation to a minority status, would have far-reaching implications and should be regarded as a ‘third demographic transition’. Other populations within Europe, and those outside it with similar combinations of sub-replacement fertility and high immigration rates, may expect similar outcomes. Migration assumptions are more important than fertility assumptions in determining this outcome. The projected transformations are not inevitable but depend in part on political events and policy decisions on migration.
Keywords: ethnic groups, Europe, fertility, migration, demographic transition.
BackgroundThe populations of the developed countries are moving into an unknown world of few babies, longer lives, aged populations, diverse family structures and more immigrants. In many Western European countries the population growth of the first demographic transition in the 19th century made possible and in some ways drove a great outflow of emigrant population to destinations outside Europe. Some went to more sparsely populated areas in the Americas and Antipodes, also to settlement in North and Southern Africa and the East Indies. About 54 million Europeans crossed the Atlantic between 1815 and 1914, very likely delaying the onset of fertility transition in much of Europe by relieving its population pressure. Now, many of those populations which Europeans colonised are in the middle of their own demographic transitions. This mismatch of the timing of transition means that population pressure is now reversed.
Many people from origins previously rare or unknown in Europe and the English-speaking world have now settled in the developed world. The motivations and processes of migration flows from poor countries are very diverse, influenced by all kinds of social, economic and political changes, not the least policy in the receiving countries. The path of recent net flows into some European countries is consequently volatile (Fig. 1). For example, the peak year of flows into Germany in 1990 arose from a transient combination of forced migration from former Yugoslavia, inflows of aussiedler of German origin after the fall of the Iron Curtain and asylum seekers before the reform of the German Basic Law. By 2004 it had become briefly negative.
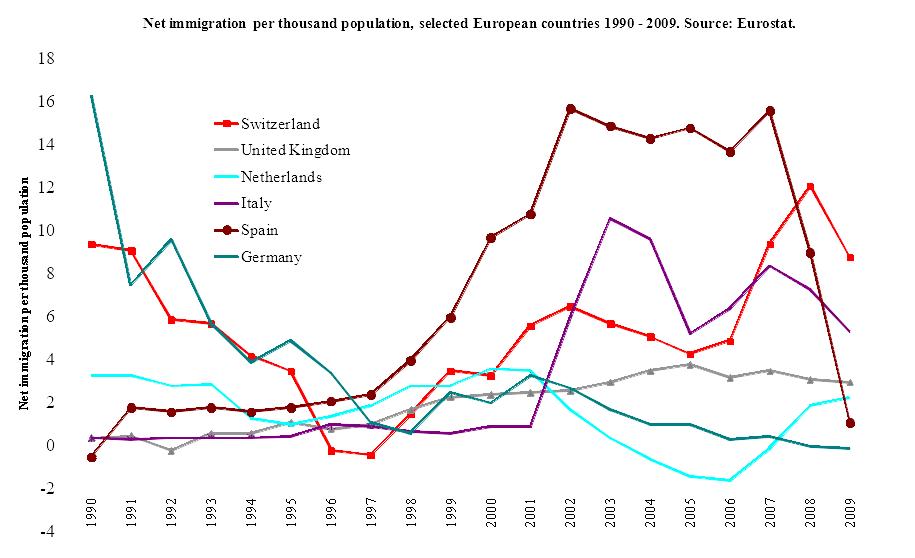
Note: Data from Eurostat (URL: http://ec.europa.eu/eurostat/data/database).
Initially, much of that migration, especially to Germany and the Netherlands, was ‘guest-worker’ migration of relatively low-skilled migrants recruited, or entering, to work in factories and foundries and mills in the rapidly expanding European economies of the late 1950s and 1960s. To begin with, most came from the poorer fringes of Southern Europe and North Africa; later from Croatia and Turkey. Little thought was given to the consequences. It was supposed, at least in Germany, that they would return when their contracts ended or when the economy periodically turned down. Some did. Many did not, even when the need for their low-skilled labor withered with the rust-belt industries in which many were employed. In the Western liberal economies, it became impossible to resist claims for family re-union in Europe, a complication not initially envisaged at all. Dependants and spouses, old and new, came to dominate migration flows, augmented from the 1980s by the growth of asylum claiming and illegal inflows and over-staying. Table 1 below shows gross inflows to France in 2009 illustrating the percentage of migrants entering for diverse purposes. That is typical of a number of European countries. More recently, changes of government, in the UK in 1997–2010, and in Sweden, and new labour needs, have renewed labor migration flows. Since 2010, however, the UK now has a more restrictive policy following a change of government. The huge increases in Spain, and to a lesser extent in Italy, reflect in part the statistical recognition (through regularization) of very large inflows of illegal immigrants previously unrecorded. In the English-speaking countries overseas, whose governments adopt a more consistent policy in favour of managed migration, inflows have been more substantial and more regular since post-war restrictions were lifted, as in the US in 1965. Even then, the consequences were often unintended. Those who promoted the US 1965 Immigration Act claimed that they never expected, or intended, the very large inflows of family and dependants that have followed it (Graham 2004).
|
Table 1. Percentage of migrants entering for diverse purposes. France 2005. | ||||||
|
|
|
|
|
|
|
Percent |
|
|
Student |
Worker |
Family |
Other |
All |
By area |
|
EEA |
3 |
37 |
10 |
50 |
100 |
21 |
|
Non-Europe |
26 |
5 |
50 |
19 |
100 |
79 |
|
All |
21 |
11 |
42 |
25 |
100 |
100 |
|
Other includes inactive, retired, refugees. Percent by purpose excludes minors, about
| ||||||
|
Switzerland and Turkey omitted. 12 % of total, mostly Turkey. Entry 39 % for family reasons. | ||||||
Source: URL: http://statistiques_flux_immigration.site.ined.fr/fr/admissions/
The attitudes of elites, many longer rooted in a confident concept of national identity or worth, indifferent to religion, careless or ignorant of national history, tend to be open also to pluralistic ideas of nation and culture, favouring or at least tolerant of alien cultures and their values which previously would have been regarded as problematic or unacceptable. Open and uncertain attitudes to immigration, an inclination towards a multicultural not an assimilationist outcome for cultural diversity, collide with much more clear-cut and confidently held traditional attitudes in immigrant cultures from the developing world, especially among Muslims. Many from such societies remain untouched by ‘progressive’ attitudes and respond strongly and violently when they arise in their own communities – for example, opposition to an arranged marriage.
The Influence of Migration on Population Dynamics in Western Countries
In many of the countries of the developed world, international migration now dominates the dynamics of population. In some countries in recent years
(see Table 2) the volume of migration has approximated (e.g., in Switzerland, Italy) or exceeded (e.g., in Spain) the number of live births in each year and has been much greater than their natural increase. Some of the latter will be, in any case, births to immigrants.
|
Table 2.
| ||||||||||||||||||||||||||||||||||||||||||||||||||||||||||||||||||||||||||||||||||||||||||||||||||||||||||||||||||||||||
Sources: Eurostat, Australian Bureau of Statistics, Statistics Canada, Statistics New Zealand, US Census Bureau, National Center for Health Statistics, US Department of Homeland Security.
Note: US data refer to 2006, Australia, Canada and New Zealand to 2007. Net immigration data not available for US. Admission for permanent settlement in 2006 was 1,266,264. Figure reduced by 1/3 to 844,000 to allow for return emigration.
In many Western European countries, population increase is thus driven primarily by international migration, not natural change (the difference between births over deaths). In Central and Eastern Europe, the effects of very low birth rates and high mortality still predominate. Where natural increase has ceased (e.g., in Germany, Greece, Italy) or become negative, net immigration has prevented, or slowed, population decline (Fig. 2).
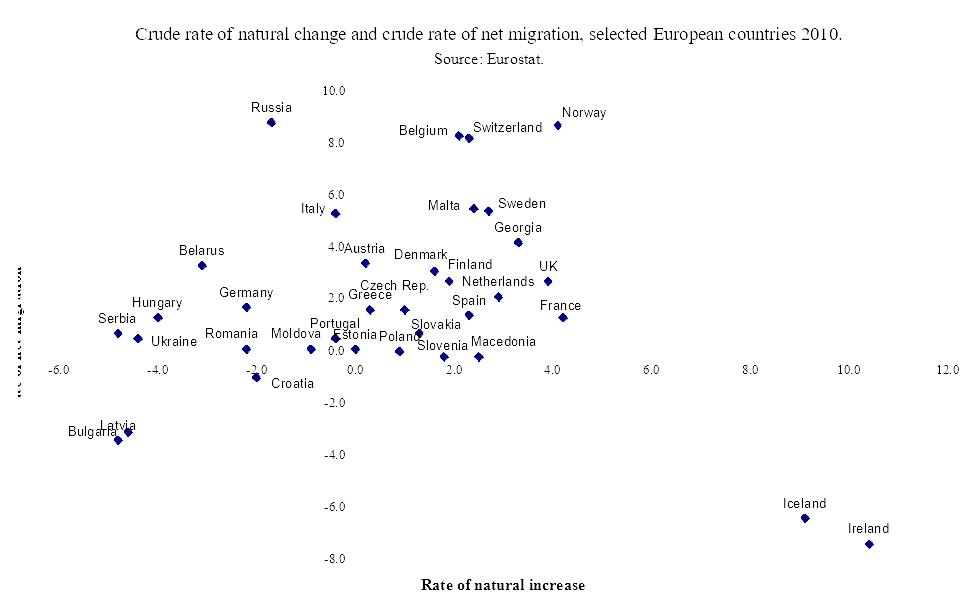
European countries 2010
Source: Eurostat.
The Future Demographic Effects of Migration on Developed Countries
With the residual effects of population momentum running out of steam in most developed countries (Lutz et al. 2003), and in the absence of major increases in fertility, the impact of migration on population is very likely to increase further in the future (Table 3).
Table 3. European and other developed countries projected to 2060 with, and without, migration, ranked according to percent change with migration by 2060
|
|
|
Percent change | |||
|
With migration |
Without migration |
With migration |
Without migration | ||
|
|
2010 |
2060 |
2060 |
2060 |
2060 |
|
Ireland |
4.5 |
6.6 |
5.5 |
46.5 |
23.5 |
|
Norway |
4.9 |
6.6 |
5.2 |
35.6 |
7.2 |
|
UK |
62.0 |
78.9 |
63.8 |
27.3 |
2.8 |
|
Belgium |
10.8 |
13.5 |
10.3 |
24.1 |
–5.3 |
|
Sweden |
9.3 |
11.5 |
9.3 |
23.4 |
–0.1 |
|
Switzerland |
7.8 |
9.3 |
6.5 |
19.6 |
–16.0 |
|
France |
62.6 |
71.8 |
68.2 |
14.7 |
8.9 |
|
Spain |
46.0 |
52.3 |
37.6 |
13.7 |
–18.3 |
|
Denmark |
5.5 |
6.1 |
5.3 |
9.7 |
-4.7 |
|
Italy |
60.3 |
65.0 |
45.1 |
7.7 |
–25.3 |
|
Finland |
5.4 |
5.7 |
5.0 |
7.3 |
–6.0 |
|
Austria |
8.4 |
8.9 |
6.6 |
5.8 |
–21.7 |
|
Netherlands |
16.6 |
17.1 |
15.7 |
3.0 |
–5.2 |
|
Slovenia |
2.1 |
2.1 |
1.6 |
0.5 |
–20.0 |
|
Greece |
11.3 |
11.3 |
8.9 |
–0.1 |
–21.3 |
|
Czech Republic |
10.5 |
10.5 |
8.5 |
–0.4 |
–19.3 |
|
Portugal |
10.6 |
10.3 |
8.1 |
–3.5 |
–24.1 |
|
Slovakia |
5.4 |
5.1 |
4.6 |
–5.7 |
–16.0 |
|
Hungary |
10.0 |
8.9 |
7.4 |
–11.5 |
–26.0 |
|
Estonia |
1.3 |
1.2 |
1.2 |
–12.7 |
–13.4 |
|
Poland |
38.2 |
32.7 |
31.6 |
–14.3 |
–17.3 |
|
Germany |
81.7 |
66.4 |
58.1 |
–18.8 |
–28.9 |
|
Romania |
21.5 |
17.3 |
16.7 |
–19.3 |
–22.3 |
|
Lithuania |
3.3 |
2.7 |
2.8 |
–19.5 |
–15.9 |
|
Latvia |
2.3 |
1.7 |
1.7 |
–25.8 |
–26.7 |
|
Bulgaria |
7.6 |
5.5 |
5.7 |
–26.9 |
–24.7 |
|
Australia |
20.4 |
34.0 |
|
66.6 |
|
|
Canada |
33.7 |
52.6 |
30.6 |
56.1 |
–9.1 |
|
United States |
313.2 |
439.0 |
323.0 |
40.2 |
3.1 |
Source: Eurostat and national statistical offices; Eurostat 2010-based projections, Australian Bureau of Statistics (2008), Statistics Canada, CANSIM table 052-0005 (2010)1, US Census Bureau (2008).
Note: Populations under 1 million excluded. Australia 2006–2051, Canada 2010–2061, US 2010–2050. Canada zero immigration scenario does not exclude emigration.
The Eurostat projections, on which the Table 3 is based, assume that total fertility will converge slowly towards a value of 1.84. By 2060, however, the level of migration in most cases is assumed to have fallen to between about 60 and 80 % of its level in 20102 and for emigration to have ceased from countries such as Bulgaria.
According to these assumptions, even with migration, 14 out of the 26 European countries in Table 3 are projected to have lost population by 2060, by up to about a quarter of the 2010 level. All except Germany are in Southern or Eastern Europe. Most population growth is driven by migration. Without migration, only four European countries (Ireland, France, Norway and the United Kingdom) are projected to have higher populations in 2060 than in 2010. A few Central European countries, for example the Czech Republic and Slovenia, have attracted immigration enough to moderate what would otherwise be a large projected decline in numbers. In most of the other countries emigration and immigration are more or less balanced. Countries such as Poland, Latvia, Bulgaria and Romania would lose between 14 and 25 % of their population by 2060 with or without migration, due to their low birth rates and lack of positive demographic momentum.
In the latest UN 2010-based medium variant projections (United Nations 2011), which all include the assumptions about migration, all the Eastern European countries except the Czech Republic will lose population by 2050 – Russia by 12 % and Ukraine by 21 %, as do almost all the Balkan countries. The English-speaking countries overseas continue their headlong growth: Canada by 28 %, US and New Zealand by 30 %, Australia by 41 % from 2010 to 2050.
With migration, the US population was projected to increase from 310.2 million in 2010 to 439.0 million in 2050. Without migration, the population would only have reached 323.0 million by 2050 and would have begun to decline. The direct and indirect effects of migration increased the projected population by 36 % (US Census Bureau 20093). For Australia, the ABS series B projections of 2008 take the 2006 population of 20.4 million to 34.0 million in 2051, an increase of 66.5 %. In Canada, the other great immigration country, the medium population projection from Statistics Canada (2010) assuming a TFR of 1.7, takes the population from 33.7 million in 2009 to 50.74 million in 2051, an increase of 50.6 % (Statistics Canada 2010, Table 17). Without immigration, the population of Canada in 2061 would be 9 % smaller than in 2010 – reflecting the lower total fertility in Canada.
All East Asian developed countries are projected by the UN to have lost population by 2050. In Japan, migration is too slight to moderate that decline. Until recently, net migration to Korea, Singapore and Taiwan had also been modest. While increasing in recent years, it would need to become very large to reverse the projection of decline in overall numbers.
Effects upon the Ethnic Composition of the Population
As a consequence of these migration flows populations of immigrant origin in European countries have risen to proportions not seen before in recent historical times (Table 4). The proportion of foreign-background population in Germany is now 19 %, and one in three of those aged under 5. In France, 23 % of births are to immigrant women, in England and Wales 25 % in 2009, and 25 % to foreign women in Germany.
Table 4.
|
Foreign-origin population (various definitions) selected
| |||||
|
|
All foreign background |
Western background |
Non-Western background |
Year |
|
|
Denmark |
9.5 |
3.1 |
6.4 |
2009 |
Statistics Denmark 2009 |
|
Germany |
18.7 |
7.7 |
11.3 |
2008 |
Statistisches Bundesamt 2010 |
|
Netherlands |
19.6 |
8.8 |
10.8 |
2008 |
Garssen and de Coin 2009 |
|
Norway |
10.6 |
3.8 |
6.8 |
2009 |
Brunborg pers comm 2010 |
|
Sweden |
15.9 |
9.7 |
6.3 |
2002 |
Statistics Sweden 2003 |
|
Sweden |
18.6 |
|
|
2009 |
Statistics Sweden 2009 |
|
England |
15.2 |
3.5 |
11.7 |
2007 |
ONS 2009 |
|
Canada |
|
|
13.4 |
2001 |
Belanger and Malenfant 2007 |
|
New
|
|
|
12.7 |
2001 |
Statistics New Zealand 2005 |
|
US |
|
|
21.0 |
2010 |
US Census Bureau 2008 |
Note: In Continental European projections, ‘foreign backround’ populations comprise foreigners born abroad plus persons born in the host country with one or two foreign-born parents. Third generation regarded as ‘native’ (i.e. Danish, etc.). ‘Western backround’ refers to origins in European countries and English-speaking world overseas. ‘Non-Western’ backround refers to origins in developing world, or in low and medium Human Development Index countries.
UK: ethnic minorities. ‘Western backround’ is ‘Other White’. Germany: W/NW author's estimate. Canada: data only for ‘visible minorities’ not including ‘First Nations’. New Zealand; ‘European’ and ‘Maori’ populations not counted as ‘foreign origin’. USA: White non-Hispanic, Black and Native American not counted as ‘foreign origin’.
No comparable data exist for Сentral and Eastern European countries, although the ‘nationality’ category in Russian official statistics, analogous to ethnicity, allows estimates to be made. In most of those countries, international migration has been more modest, and was negligible before the fall of the communist regimes except with fraternal socialist countries. The situation in Russia is different; it has always had a highly diverse set of indigenous populations. These have been augmented more recently by inflows of persons from the former republics of the Soviet Union. Although immigrant minorities are growing, diversity in some Central and Eastern European countries arises more from the growth of indigenous minorities through differential fertility, and the emigration of the majority population. The most rapidly growing indigenous minority is the gypsy (Roma) population of between 6 and 8 million people in the Central and Eastern European countries (Liégeois 2008). Their fertility rate, little touched by the post-1990 downturn, can be double that of the population average, as in Hungary in the 1990s (Meszaros 1999).
Due to its obvious policy importance, some national statistical offices have made formal projections of the future sizes and composition of the new populations (Coleman 2006). Others come from academic sources (Wohland et al. 2010; Coleman 2010; Lebhart and Münz 2003) or from think-tanks. Most European countries do not have the long experience of significant racial diversity of the United States. Nonetheless the European countries are catching up fast with the US in terms of racial diversity. Projections are not available for all countries. France's constitution effectively forbids the collection of official statistics on ethnic origin, race or religion.
The projections from Continental Europe cannot employ the self-ascribed ethnic or racial categories familiar in the English-speaking world. Instead, projections are based upon the concept of ‘foreign origin’ or ‘foreign background’ constructed from register data on citizenship and birthplace. The national-origin categories are usually grouped into larger ‘Western’ and ‘Non-Western-categories, or ‘high, medium and low Human Development Index (HDI) countries’. Those populations are based on two generations (foreign immigrants, plus persons born locally but with one, or both, foreign parents. After the second generation, all persons of immigrant descent are assumed to become part of the indigenous population, and to be henceforth Dutch, Danish etc., and thus statistically invisible. Between one third and one half of the foreign origin populations in European countries around 2000 were themselves of ‘Western’, origin, mostly European. But the projected increases are mostly in the ‘non-western’ groups. Given the size, stability, segregation and self-sufficiency of some of those populations, reinforced by the immigration of new spouses and dependents, and the weak level of integration in the third generation may be optimistic.
Continued growth of those populations has increased their share of the national total and diminished that of the indigenous population, bringing with it the long-term prospect of its displacement as the majority. In theory any population with sub-replacement fertility, with a regular net inflow of population of different origin, must diminish as a proportion of the total, and eventually be replaced by the new population (Steinmann and Jaeger 2000), except for persons of mixed ancestry. These are likely to become numerous. Most Western countries have sub-replacement total fertility and positive immigration and therefore face that outcome unless birth or migration rates change. With replacement fertility, the indigenous population would persist, but continued migration would diminish its share of the total.
In the projections of the foreign-background population, fertility rates are generally assumed to converge towards the national average, with the locally-born exhibiting lower fertility than immigrants. Despite that, some projections (e.g., Statistics Sweden 2003) assume that fertility of the non-Western immigrants will remain higher. Net immigration is assumed to be constant in the long run, except for the projections for Norway where it is assumed to diminish over time (Statistics Norway 2010). Most projections except those of Wohland et al. (2010) assume a uniformly falling mortality across all groups, for want of better information.
The projections for the United Kingdom from 2006–2081 are based on the ethnic population distributions in the 2001 census. They assume constant migration, near-convergent fertility and uniformly declining mortality across all groups. The twelve standard official ethnic categories are projected separately but presented here grouped into three major divisions; the ‘indigenous’ British, Scottish and Irish, the non-British white population, and the non-white ethnic minorities (Fig. 3). Four variants assume different levels of migration. The standard projection assumes overall migration as in the ONS 2008-based Principal Projection. By 2051, non-white minorities would comprise 31 % of the UK population, and the white non-British – 10 %. Persons of mixed origin comprise an increasing proportion of the total. These UK projections were constrained to the same overall total fertility (1.84), net immigration (long-term 180,000) and mortality trends as the ONS 2008-based Principal Projection (ONS 2009a). The overall projected population totals were correspondingly similar. Other variants lead to lower totals and lower proportions of ethnic minority population (Coleman 2010).
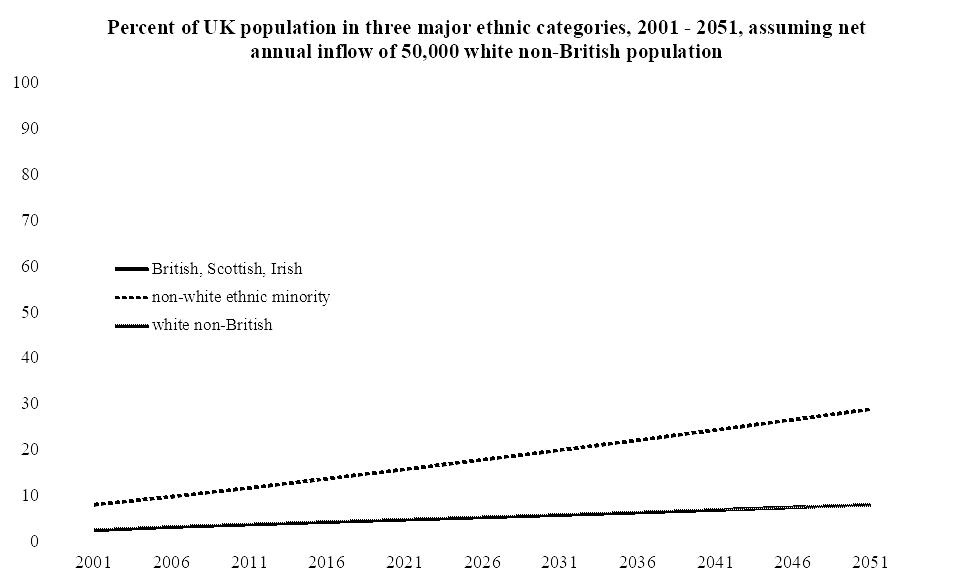
Fig. 3. Projection of UK populations 2001–2051, combined into three major groups. Assumptions: overall fertility, constant migration, mortality as in GAD 2008-based Principal Projection
Source: Coleman 2010.
The Continental projections assume that there is no ‘foreign-origin’ third generation, all of that is assumed to become part of the national population would lead to lower estimates of ‘ethnic’ change (Fig. 4). In all projections of foreign-origin population for European countries growth rates are roughly linear, although at different levels, with a similar slope. Projected linear growth continues, in most cases, unchanged up to the end of the projection periods. In the Dutch (e.g., Alders 2006) and Danish projections successive revisions have reduced the projected population of foreign origin following tightening of immigration and asylum rules.
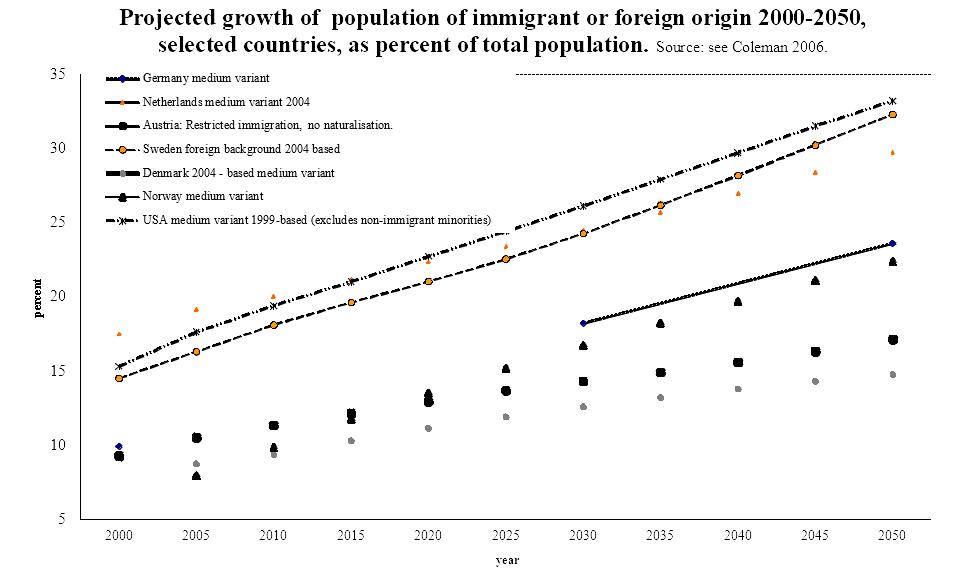
Fig. 4. Comparison of results of European foreign-origin projections
Sources: Coleman 2006.
Similar processes are in train throughout Western Europe. New measures of population reproduction incorporate the contribution of net migration as well as that of natural change. These permit an estimation of the immigrant contribution to future population sizes, enabling a ‘time to half-replacement’ (THR) (Ediev et al. 2007) to be calculated: the number of years that will elapse for 50 % of the population to be of post-2001 immigrant origin. Half-replacement times for Spain and Switzerland were about 45 years. Cyprus, Italy, and Malta – about 50–80 years, slightly longer for Austria (between 65 and 90 years). The US is the first major population in the modern world to have forecast officially a peaceful transfer in the dominant population group. The US 2008 projections expect that the formerly numerically dominant white non-Hispanic population will become a numerical minority in 2046 (US Census Bureau 2009).
The 50 % benchmark has no special demographic significance, but it does have considerable psychological and political impact and attracts media attention. If total population is on the cusp of being majority ethnic, then a substantial majority will already have become so among schoolchildren and urbanites. At local level throughout Europe, transitions in the balance between indigenous and immigrant populations are becoming more common. At the bottom of the age-pyramid the position already looks transformed. In London (with population of 7 million) in 2007, 60 % of all births were to foreign-born mothers (not the same as non-white ethnic minority), and in 24 out of 32 boroughs such births comprised more than half the total, in some cases over 70 %. In Europe, major cities such as Rotterdam, Amsterdam, The Hague are on the edge of this transition.
The Faces of the Future?
So far ethnic groups have been discussed as though membership of them was unambiguous; whether defined bureaucratically by the register statistics of Continental European countries or by the individually self-ascribed racial or ethnic descriptions of the US and UK. Natural human inclinations are beginning to erode that neat picture. They may end up, in the very long run, destroying it altogether. That is because, if minority populations become more integrated into the educational system and the labour market and more dispersed geographically, the opportunities for sexual unions across ethnic or racial lines become more numerous. Adherence to patterns of arranged marriage, and strong preferences for marriages within closely defined religious, ethnic clan or kin lines keep inter-ethnic unions at a low level in, for example, Asians and Turks in Europe, especially Muslims, and some North African populations. But in general, more and more children are born with mixed parentage as time goes on. They may identify, or be identified, as members of either parental group. But many are content, or even anxious, to describe themselves as of mixed or multiple ancestry.
Responses
Initially politicians and public in the Western world were baffled to find an appropriate response to an apparently permanent mass immigration, increasingly driven by chain migration that was not planned, intended or desired. Initial assumptions about inevitable assimilation have not been born out by events. In the 1980s, multicultural policies, proposing the formal recognition of cultural diversity as a permanent new feature of Western Society, became formally established in some European countries (e.g., The Netherlands in 1980) or became established gradually by default of any clear or strongly argued alternative as in the UK. There, it became pervasive in all aspects of central and local government activity, with specifically recognized ethnic groups enshrined in law and official statistics.
More recently, statements by, for example, the head of the Equality and Human Rights Commission Trevor Phillips (in a Times interview in April, 2004) and by the Prime Minister David Cameron at the Munich Security Conference, 4 February 2011, have distanced themselves from the multicultural ideal but its assumptions are deeply entrenched now in local government and other organizations, and law. Countries such as Germany, which for long maintained a jus sanguinis principle on citizenship, refused to acknowledge that they were, in practice, ‘countries of immigration’ until the 1990s. There also, the multicultural ideal has now been rejected forcefully as a failure by German Chancellor Angela Merkel in a speech to a CDU rally in Potsdam on 17 October, 2010.
The growing opposition to immigration among many European electorates has changed policy in some Western countries. The governments of the UK, France, Denmark and Netherlands have renewed attempts to limit immigration. But migration for poor countries is easier to permit, or to encourage, than to restrict, in liberal democracies (Freeman 1994). Economies can become distorted by it and dependent upon it, creating vested interests among employers, educational institutions and among the growing populations of immigrant origin themselves, to whom politicians increasingly need to appeal in order to assemble electoral majorities. It has been claimed that no US Presidential candidate can now support major restrictions on immigration because of the electoral influence of the Hispanic vote. As immigrant-origin populations grow, chain migration through arranged marriages and the inflow of dependants grow with them – the ‘cumulative causation’ described by Massey and Zenteno (1999). In Western Europe, governments have bound themselves to international conventions on asylum and human rights the scope of which tend to be widened further and further by activist judges in the European Court of Human Rights and, in the UK at least, by the domestic judiciary.
Countries with persistent low fertility and chain-migration connections with poor immigrant-sending countries with incomplete demographic transitions may therefore find themselves in a one-way street to ethnic change. The consequences would be irreversible. How inevitable? Directly, and indirectly through births to immigrants, immigration is the main engine of ethnic change. It is widely assumed that immigration into Western Europe, the US and elsewhere will continue at a high level, despite the current recession (Dobson et al. 2009). But immigration can still go down as well as up, often directly or indirectly in response to measures to restrict it and the effect of policies has been underestimated (Hollifield 2000).
The larger that immigrant-origin communities become, and the more numerically dominant they become in local areas, the less those communities need to adapt to local norms and use the national language except insofar as it is required to participate in the economic realm. Indeed they may change those local norms into their own, and local schools and facilities and labor market acquire and preserve an ethnic character. Foreign policy is affected too as immigrant lobbies press for favorable attitudes to causes of concern to their region of origin, not otherwise the concern of the country of settlement. Local politicians' chances of being re-elected may depend on their attitude towards controversies that strictly belong overseas: in the UK, for example, the status of Kashmir, of Punjab, Israel and Palestine, Kurdistan and other conflicts (Coleman 2009).
Some of the trends seen earlier in Western societies are now being re-played in East Asia. But Europe is not the global template for the future. Neither marriage, nor fertility, nor immigration seem likely merely to repeat European trends in a different setting to create a new-European clone. Although it seems inevitable that Asia and Europe will converge in some respects, their history and geography, their demography and their neighbors will keep them apart. The extreme level of ethnic transition in prospect for the Western developed world seems unlikely to be capable of being duplicated as an equivalently diverse society elsewhere (Ibid.).
References
Alders M. 2006. Forecasting the Population with a Foreign Background in the Netherlands. Joint Eurostat-UNECE Work Session on Demographic Projections, Vienna, 21–23 September 2005. Vienna: Statistics Netherlands Division for Social and Spatial Statistics Department for Statistical Analysis Voorburg.
Australian Bureau of Statistics. 2008. Population Projections, Australia, 2006 to 2101. Canberra: Australian Bureau of Statistics. URL: http://www.abs.gov.au/Auss tats/abs@.nsf/mf/3222.0.
Coleman D. A. 2006. Immigration and Ethnic Change in Low-Fertility Countries: A Third Demographic Transition. Population and Development Review 32(3): 401–446.
Coleman D. A. 2009. Divergent Patterns in the Ethnic Transformation of Societies. Population and Development Review 35(3): 449–478.
Coleman D. A. 2010. Projections of the Ethnic Minority Populations of the United Kingdom 2006–2056. Population and Development Review 36(3): 441–486.
Dobson J., Latham A., and Salt J. 2009. On the Move? Labour Migration in Times of Recession. What Can We Learn from the Past? London: Policy Network.
Ediev D., Coleman D., and Scherbov S. 2007. Migration as a Factor in Population Reproduction. Research Papers of the Vienna Institute of Demography 1: 1–57.
Freeman G. S. 1994. Can Liberal States Control Unwanted Migration? Annals of the American Association for Political and Social Sciences 534: 17–30.
Graham O. L. 2004. Unguarded Gates: A History of America's Immigration Crisis. Lanham, MD: Rowman and Littlefield.
Hollifield J. F. 2000. The Politics of International Migration: How Can We ‘Bring the State Back in’? Migration Theory: Talking Across Disciplines / Ed. by C. Brettell, and J. F. Hollifield, pp. 137–185. London: Routledge.
Lebhart G., and Münz R. 2003. Szenarien zur Bevölkerungsentwicklung in Österreich nach Staatsangehörigkeit. Forschungsbericht Nr. 26. Vienna: Vienna Institute of Demography.
Liégeois J.-P. 2008. Roma in Europe. Strasburg: Council of Europe.
Lutz W., O'Neill B. C., and Scherbov S. 2003. Europe's Population at a Turning Point. Science 299(5615): 1991–1992.
Massey D., and Zenteno R. 1999. The Dynamics of Mass Migration. Proceedings of the National Academy of Sciences 96: 5328–5335.
Meszaros A. 1999. The Gypsy Population in Hungary in the 1990s (Romske obyvatelstvo v Madarsku v 90. letech) in Czech with English Abstract. Demografie 41(2): 120–137.
ONS. 2009a. 2008-Based National Population Projections. London: Office for National Statistics.
ONS. 2009b. Population Estimates by Ethnic Group: 2001 to 2007 Commentary. London: Office for National Statistics.
Statistics Canada. 2010. Population Projections for Canada, Provinces and Territories 2009 to 2036. Ottawa: Statistics Canada. URL: http://www.statcan.gc.ca/pub/91-520-x/91-520-x2010001-eng.pdf.
Statistics Norway. 2010. Projection of Immigrants and Norwegian-born to Immigrant Parents 2010–2060. Oslo: Statistics Norway.
Statistics Sweden. 2003. Sveriges framtida befolkning 2003–2020: svensk och utländsk bakgrund. Demografiska rapporter 5. (Sweden's Future Population 2003–2020 – Swedes and Foreign Background).
Steinmann G., and Jaeger M. 2000. Immigration and Integration: Non-linear Dynamics of Minorities. Journal of Mathematical Population Studies 9(1): 65–82.
US Census Bureau. 2008. United States Population Projections by Age, Sex, Race and Hispanic Origin: July 1, 2000–2050. Washington, DC: US Bureau of the Census.
US Census Bureau. 2009. URL: http://www.census.gov/population/www/projections/ 2009comparisonfiles.html.
Wohland P., Rees P., Norman P., Boden P., and Jasinska M. 2010. Ethnic Population Projections for the UK and Local Areas, 2001–2051. Working Paper 10/02. Leeds: School of Geography, University of Leeds.
1 URL: http://www5.statcan.gc.ca/cansim/a26?lang=eng&id=520005.
2 See URL: http://appsso.eurostat.ec.europa.eu/nui/show.do?dataset=proj_10c2150a&lang=en.
3 URL: http://www.census.gov/population/projections/data/national/2009/2009comparisonfiles.html.