From Concept to Reality: Developing a Zoomable timeline for Big History

Almanac: Evolution: A Big History Perspective
Big History is proving to be an excellent framework for designing undergraduate synthesis courses. A serious problem in teaching such courses is how to convey the vast stretches of time from the Big Bang, 13.7 billion years ago, to the present, and how to clarify the wildly different time scales of cosmic history, Earth and life history, human prehistory and human history. Inspired by a series of printable timelines created by Professor Walter Alvarez at the University of California, Berkeley, a time visualization tool called ‘ChronoZoom’ was developed through a collaborative effort of the Department of Earth and Planetary Science at UC, Berkeley, and Microsoft Research. With the help of the Office of Intellectual Property and Industry Research Alliances at UC, Berkeley, a relationship was established that resulted in the creation of a prototype of ChronoZoom, leveraging Microsoft Seadragon zoom technology. Work on a second version of ChronoZoom is presently underway with the hope that it will be among the first in a new generation of tools to enhance the study of Big History.
In Spring of 2009, I had the good fortune of taking Walter Alvarez' Big History course at the University of California Berkeley. As a senior about to complete an interdisciplinary degree in Design, I was always attracted to big picture courses rather than those that focused on specifics. So when a housemate told me about Walter's Big History course, I immediately enrolled.
The course started with a bang, literally, as we toured the Cosmos, leaving our planet, our solar system, our galaxy and onward into the void. Walter used a combination of videos, along with images from the Hubble Ultra Deep Field to give us a sense of the scale of these things. The Cosmos was clearly vast and breathtaking.
But I had no way of understanding the concept of a billion years. Walter had told us that the Big Bang occurred 13.7 billion years ago. In my mind, practically everything prior to a few thousand years ago was ‘a long time ago’. I truly had no way of comprehending the length of a billion years.
As we moved into Earth history, the scale changed from billions of years to millions of years. The Earth timescale was more manageable because of the various divisions into eons, eras, epochs and more, but I still did not have an intuitive sense of what a century looked like compared to a million years.
Earth history was also easier to understand because of the various stories that could be told as one moved from older times to younger times. For example, the dinosaur impact-extinction event 65 million years ago, which Walter and his father discovered in the 1980s, helped to give a sense of how long the Earth truly had been around. I, like many other students, had once considered the age of the dinosaurs to be long ago distant time. But it quickly became apparent in the context of Big History that the age of the dinosaurs was relatively recent.
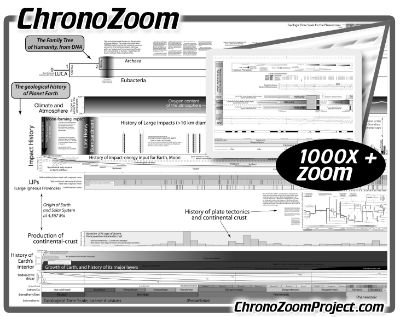
In order to tackle the Big History timescale problem, Walter had created a series of timeline handouts, some on logarithmic scales, some with diagrams of a linear-log hybrid and others that used a series of ‘zooming’ boxes. The fi-gures were drawn by Walter in Macromedia Freehand and later in Adobe Illustrator. Walter's handouts reminded me of magazine infographics – they were densely packed with all sorts of information, yet thoughtfully laid out to allow one to explore slowly all of the information.
Since the course was interdisciplinary in nature and open to all majors of various grade levels, the log-scale representations of time were understood naturally by some students, while foreign to others. One of the graduate student instructors created a custom version of the ‘Powers of Ten’ video using the UC Berkeley campus. The animation started with a given length shown on the campus map for which everyone had an intuitive understanding. The slide show then started to zoom out in factors of 10. Soon we went from campus to seeing the entire United States. Soon after, we left Earth all together and even our own galaxy too. Showing time on log scales was clearly impressive and convenient, but it did not show any details between the factors of ten.
Walter's other method used a series of boxes in which each successive box was understood to be a magnification of the last 10 % from the previous box. Another way to imagine this is as follows: if a single timeline ran from left to right, a second timeline drawn above it would be understood to be a magnification of the last 10 % of the first timeline.
This method solved the detail problem. Each additional timeline stacked above the original one showed more and more details, but as soon as the number of timelines exceeded more than three or so, it became increasingly difficult to remember that each successive box was only the last 10 % of each box that preceded it.
What lay in front of me was a perplexing but exciting challenge. As a design major, we had always been taught to seek out needs and meet them, rather than develop new ideas for which no real demand may exist. I was not an expert in graphical tools, video editing or web design, but I knew a little of each. I had often liked the aphorism: ‘Jack of all trades, Master of none’. But I liked the updated version of it by Discovery Channel's Adam Savage even better: ‘Jack of all trades, master of none, but often better than a master of one!’
So having some basic skills in graphic design, video and web design, I knew that modern computer technology could provide a solution to the timescale problem, lifting the timeline out from paper and into the digital world.
In Walter's Big History course, a semester-long project was assigned. Since I had identified the timescale problem, I elected to do my semester project on the history of timelines. Researching the history of timelines showed me the various attempts that had been made through time. My goal of creating an interactive timeline would merely be the latest attempt. In Cartographies of Time by Anthony Grafton and Daniel Rosenberg (Rosenberg and Grafton 2010), I read about everything from scrolls that ran hundreds of feet long to giant wall-sized posters that were intended to track the history of different civilizations and important people.
I eventually came across a TED (Technology Entertainment Design) presentation by Blaise Aguera y Arcas (2007) where he demonstrated a new kind of zoom technology called ‘Seadragon’. In Blaise's presentation, he explained that the purpose of Seadragon was to provide a very smooth zoom into images of extraordinary high resolution (images exceeding one gigapixel, or one thousand megapixels each). Seadragon made possible the kind of zoom previously reserved for specialized high-performance computers. In his TED talk, Blaise showed a series of vertical lines, explaining that each line was actually a chapter from Bleak House by Charles Dickens. With a flick of a scroll wheel on his mouse, Blaise zoomed from seeing every single chapter of Bleak House to a single letter.
During my initial presentation on the history of timelines for the Big History class, I included the Dickens clip from Blaize's presentation, asking if this technology could be applied to a next generation timeline. As part of my final presentation, I created a rough prototype using Microsoft PowerPoint to paint a picture of how Seadragon technology could be used to zoom into intricately nested timelines.
With support and encouragement from Walter, it was becoming clear that the Big History timescale problem could be solved.
Soon after my presentation, I began meeting with Walter to discuss ideas for our interactive timeline. We often exchanged drawings on the blackboard after class, or quick sketches during office hours. The project was clearly exciting, and Walter soon began using Adobe Illustrator to create mockups with limited zoom capability. As we quickly found out, even professional-level tools such as Adobe Illustrator and Adobe Photoshop have a zoom limit of 6400 %. While that number would seem large, for the purposes of creating a timescale that would zoom from a single day to a Big Bang, this zoom factor represented only a tiny fraction of what was needed.
When a free program that enabled anyone to create Seadragon projects became available, Walter and I were able to begin realizing our concept in actuality. The program was called ‘Deep Zoom Composer’ and allowed the nesting of photos within photos, creating a high resolution image that can take advantage of Seadragon's smooth zooming capability. It is for this reason that our early concepts of ChronoZoom was called ‘Deep Zoom Interactive Timeline’ but eventually – after writing out various words related to time and space – we connected the Greek god Chronos with zoom.
Deep Zoom Composer allowed Walter and I to create the first early versions of ChronoZoom. Cobbling together various drawings created using Adobe Illustrator, we were able to achieve a zoom from all of the Cosmos down to about the last 2 million years. Armed with a demonstration model, we sought to contact the company behind Deep Zoom Composer and Seadragon technology: Microsoft.
Walter and me had no idea how to go about contacting such a large company, so we turned to an office on the Berkeley campus called the ‘Office of Intellectual Property and Industry Research Alliances’ (IPIRA). We put together a description of the project and rehearsed a demonstration of the prototype that we had built. After showing it to the IPIRA group, Walter and I distinctively remembered one of the first reactions. It went something like this: ‘We are used to getting technical people such as chemists and biologists who come in and present their latest synthesized compound or chemical. Usually we just try to nod and pretend to share their excitement, but this is really cool!’
Spurred by this, the people at IPIRA helped us to arrange a conference call with Microsoft Research. Walter and I provided IPIRA with a tool to convey our idea. We produced a 7 minute video that explained both the Big History timescale problem as well as our initial prototype. Walter and I called our video the ‘ChronoZoom Movie’. We scripted, rehearsed, and recorded take after take, which would eventually form a short but complete video explaining the field of Big History, the timescale problem, and how the Seadragon technology could be applied to creating a next-generation timeline. This video was distributed throughout Microsoft Research, eventually putting us in contact with a smaller group called Microsoft Live Labs, who were actively developing Seadragon technology.
A small but highly dedicated team at Microsoft Live Labs would go on to produce the first version of ChronoZoom, capable of zooming from a single day to the Big Bang. This impressive accomplishment was achieved in time for Walter's Faculty Research Lecture, where ChronoZoom made its worldwide debut. Walter had been selected as one of two faculty members to give the annual talk to the UC Berkeley community in 2010. The complete one-hour video is also available on the ChronoZoom website.
Development of ChronoZoom continues now with a completely new version underway as of Spring 2011. The project has graduated from the smaller Microsoft Live Labs team to Microsoft Research which is presently developing ChronoZoom 2. We hope that ChronoZoom can be among the first of a new generation of tools to enhance the study of Big History.
References
Aguera y Arcas B. 2007. Blaise Aguera y Arcas demos Photosynth. [Video file.] URL: http://www.ted.com/talks/blaise_aguera_y_arcas_demos_ photosynth.html
Rosenberg D., and Grafton A. 2010. Cartographies of Time. New York: Princeton Architectural Press.
Resources and Links
ChronoZoom Project Homepage.
URL: http://www.ChronoZoomProject.com
Original ChronoZoom Proof of Concept Video.
URL: http://www.youtube.com/watch?v = 3ztX8PmLNKU
Microsoft Seadragon and Deep Zoom.
URL: http://www.microsoft.com/silverlight/deep-zoom/
Microsoft Research.
URL: http://research.microsoft.com
Technology Entertainment Design (TED).
URL: http://www.ted.com/
University of California, Berkeley Office of Intellectual Property and Industry Research Alliances (IPIRA).
URL: http://ipira.berkeley.edu/