Global Volcanism as It Impacts the Integrity of the World System

Almanac: Evolution: Development within Big History, Evolutionary and World-System Paradigms
Abstract
This paper investigates the relationship between the occurrence of global volcanic events (GVEs) and the integrity of the world system. Tree-ring data recording GVEs is used as a context for comparing the response of the world system one through four centuries after any given GVE. Data on changes in the ratio of rural to urban populations and changes in the log-transformed values of maximum urban area magnitude are compared with respect to the occurrence of GVEs. It is found that there is no significant effect of GVEs in the succeeding century, but two, three, and four centuries after, there is. Further, this effect is counterintuitive, as the world system became more urbanized, not less. Rank size-frequencies were constructed of each data set to show that effectively all changes fit within a linear series not uncharacteristic of systems exhibiting self-organized criticality. Finally, it is shown that a threshold effect with respect to the number of year equivalents of GVEs exists whereby reduction in world system urbanization does occur in the immediately succeeding century after such threshold events. These results are then put in the context of both physically induced and endemically induced societal collapses.
Keywords: global volcanic event, civilization, volcanism, world system, self-organized criticality.
Introduction
There has been considerable a debate regarding the negative influence of the environment on various civilizations over historic and in fact prehistoric time. Any number of researchers, Harvey Weiss and Raymond S. Bradley (2001) of Yale being among the most prominent, have argued for the primacy of environmental effects, for example, climate change induced drought, also viewed by Gill (1999) as the immediate cause of the Classic Mayan Collapse, earth quakes (Nur and Burgess 2007), disease (McNeil 1977), and volcanism, on the sustainability of civilizations. While there are also those who support the idea that the sustainability of civilizations is due to the choices those civilizations make, usually at some time depth. Consequently, the temporal persistence of a given civilization is a result of the inherent make up or structure of that civilization. Chief among the proponents of this view are Joseph Tainter (1988) and Jared Diamond (2005), however there are others. See, for example, the paper by Janssen et al. (2003) on the effects of sunk costs on the sustainability of southwest Native American civilizations; each position also has its liabilities.
Inherent social, economic, political, or cultural structure and processes have all been suggested as internal or endemic contributing factors to the demise of civilizations. The research and writings of Tainter and Diamond mentioned above and those of others have suggested that societies and civilizations make historic choices, choices without foresight, but with contemporary value regarding the time of the choice. These choices become burdening and then stifling with respect to the sustainability of the civilization making the choice. In analyzing such circumstances, cause and effect can be easily confused with correlation, and since the supporting data are historical, in time the biases of preservation surely play a role in the clarity of both that supporting data and the inferences that may be drawn from such supporting data. This time dependent bias then is surely (one of) the greatest liabilities that this particular research approach, that of assessing internal factors in the demise of civilizations, is subject to. What of external factors?
In order for an environmental effect to have a global impact on the world system the effect itself has to be global in nature. Earthquakes and even earthquake storms can be dismissed as their impact is far from global at least from a historic perspective. Disease has the potential for pandemic effect, and certainly epidemic disease has played a significant role in history, the plague of Justinian of the 6th century and the Black Death of the 14th century are such examples. However, it might be difficult to argue that either alone brought about the extinction of any contemporary civilization. Climate and climate change have had and are having a pronounced effect on our evolution and the evolution of our civilizations; however, with the current climatic predicament that the world system is now immersed in excepted, it is again difficult to point explicitly to a large scale reduction in the sustainability of civilizations due to external factors which are then attributable to civilizational demise, although Parker (2008) has strongly suggested that climate change has played a primary role in the global chaos of the 17th century. However, clearly the Vikings of Greenland were reduced to nothing as the climate of that large island became cooler, but as Diamond (2005) pointed out, the Viking demise on Greenland can be attributed to Viking choices on Greenland. With regard to the possible candidates for civilizational demise, volcanism remains a viable candidate both as a primary and a secondary cause.
Large scale or global volcanism may be defined as producing so much gas and ash that either or both become globally distributed to the extent that these products of volcanism leave a discernible global signature in the geologic record and with respect to the Quaternary also the tree-ring record. The research of Salzer and Hughes (2007) suggests that 12 of the last 50 centuries have experienced global volcanism. That is to say that one or more global volcanic eruptions occurred in 12 of the last 50 centuries. The total number of these eruptions is 26. This implies that there are 26 years represented by individual tree rings over the last 5,000 years that unquestionably exhibit the effects of global volcanism.
However, rather than focus on the demise and collapse of any civilization or sets of civilizations, it is the intent of this paper to investigate the impact of global volcanism on the organizational integrity of the world system in toto and to do so over the last 5,000 years of world system history. The specific status of any extant civilization over that period of time will not be considered. Further, it will be shown that the immediate effects of global volcanism have been equivocal with respect to the status of world system integrity. However, it will also be shown that when the effects of global volcanism are considered not just one century in the future but two, three, and four centuries beyond the occurrence of a globally significant eruption, then there does appear to be an effect on the integrity of the world system due to global volcanism, but a counterintuitive one. It will also be shown that above a given threshold of GVE effect, that of more than two year equivalents of GVE, then the world system does respond in a predictable way. Finally, it will be shown that the world system is subject to self-organized criticality, SOC, implying that the exhibited changes are all part of a single system's response.
Methods
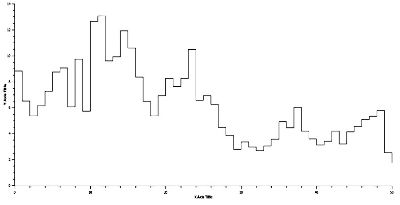
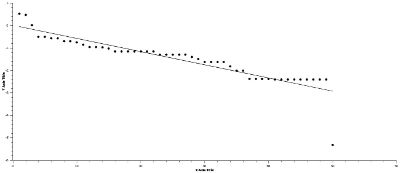
Various signatures of the status of the world system over time exist. One will be used here, the ratio of the rural population over the urban population, R/U = = (1 – C0γ – 1)/(a1-γ – 1) (Harper 2010a), which over time can be represented graphically as in Fig. 1. The plot in Fig. 1 is specifically designed to emphasize the change in values represented on the vertical axis, that is change in R/U. Note, that R/U is simply the reciprocal of U/R as defined in Harper (Ibid.). Data (see Table 1 to follow) on the occurrence of global volcanism will then be plotted on the graph in Fig. 1 and the relative risk (RR) will be computed for centuries immediately following those occurrences of global volcanism as well as two, three, and four centuries afterwards. Also, the RR will be computed for the response one century later for the number of volcanic events, as represented by the number of years documented by tree ring data that exhibit the effects of GVEs. Corroborative data will also be collected from a graph of the observed minus expected values of naturally log-transformed values for the magnitude of maximum urban areas, and a rank-frequency distribution will be constructed to demonstrate that the vertical changes represent a coherent pattern, further inference of the existence of a world system over this period of time. Also, the number of years per century in which GVEs occurred and having a threshold of greater than two per year will be investigated using the RR statistic.
All demographic data used in calculations were taken from Chandler (1987), Modelski (2003), and the U.S. Census Bureau, and all graphical analysis was done on SciDAVis software.
| | | | | | | | | | | | | |
| | | | | | | | | | | | | |
Note: Data from Salzer and Hughes (2007). GVEs = Global Volcanic Events.
Results
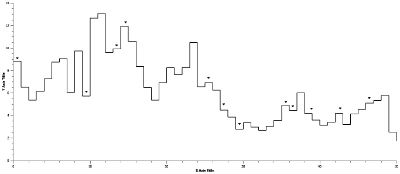
Fig. 2 shows the distribution of global volcanic events imposed on the graph of R/U as in Fig. 1. Twelve out of 50 centuries experienced globally significant volcanism (Salzer and Hughes 2007), and as has been previously mentioned, there were a total of 26 years in which those GVEs occurred. With regard to the trends represented by changes in the R/U ratio, during the century immediately succeeding each event, there is a total of 13 occurrences that are succeeded with decreases in the R/U ratio and 13 that exhibit increases. These numbers were computed by summing the number of actual events per century per increase or decrease in R/U. When the relative risk of a decrease in R/U succeeding a GVE the value is 1.0909, an equivocal value with respect to GVEs being associated with an R/U decrease. This datum along with the RR's for GVE effects two, three, and four centuries after are all given in Table 2. With regard to the effects of GVEs two and three centuries hence, the RR's for both are 3.5077 and for four centuries after the RR is 2.0769. These three RRs are high enough to suggest that GVEs did in fact have a significant effect on the R/U ratios. However, as will be treated in the discussion, this effect is counterintuitive to the effect one would expect from a GVE, since the R/U ratio decreased.
| | | | | | |
| | | | | | |
| | | | | | |
| | | | | | |
| | | | | | |
| | | | | | |
| | | | | | |
| | | | | | |
| | | | | | |
| | | | | | |
| | | | | | |
| | | | | | |
| | | | | | |
| | | | | | |
| | | | | | |
Note: ↓ represents a decrease in R/U, while ↑ represents an increase.
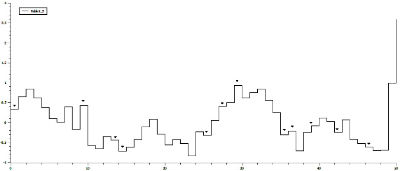
It would be helpful to have support for the previous data on GVE effects on the R/U ratio. As is shown in Fig. 3 and Table 2, imposing Salzer and Hughes's (2007) data on a graph of observed minus expected log-transformed maximum urban area data reveals essentially the same trend. Explicitly, the y-axis represents lnΔ[lnCmax O – lnCmax E], where lnCmax O is the log-transformed value of the maximum urban area as noted in Harper (2010a), and lnCmax E is calculated from the regression, lnCmax E = 10.2681 + .0904t, where t = time. In other words, if the same 12 centuries of GVEs are indicated and then if observed number of GVEs per increase or decrease with respect to the expected value are subjected to a Relative Risk (RR) analysis, a similar set of RR values is exhibited. Specifically, one century after a GVE the effect is equivocal, however two, three, and four centuries after, there is a clear positive effect (see Table 3). It should be noted here that an increase in the observed value of lnCmax is equivalent to a decrease in R/U. As a consequence of this the computation of RR is done to reflect this emphasis.
| | | | | | |
| | | | | | |
|
3000 BCE – 2900 BCE | | | | | |
|
2100 BCE – 2000 BCE | | | | | |
|
1700 BCE – 1600 BCE | | | | | |
|
1600 BCE – 1500 BCE | | | | | |
|
500 BCE – 400 BCE | | | | | |
|
300 BCE – 200 BCE | | | | | |
|
100 BCE – 1 CE | | | | | |
|
500 CE – 600 CE | | | | | |
|
600 CE – 700 CE | | | | | |
|
800 CE – 900 CE | | | | | |
|
1200 CE – 1300 CE | | | | | |
|
1600 CE – 1700 CE | | | | | |
|
TOTAL | | | | | |
| | | | | | |
Note: ↑ represents an increase in O – E, while ↓ represents a decrease.
The RRs for the effect one century later of the number of GVEs prior to that century were also computed. Using the following threshold, > 2 GVEs and ≤ 2, the RR for the increase of the ratio, R/U, is 2.8571, and the RR for decrease in the log-transformed observed minus expected magnitudes of maximum urban areas is 2.8571.
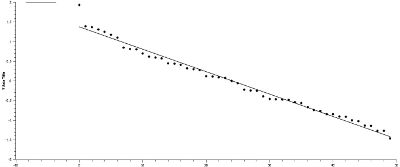
If a rank size versus natural-log change in R/U graph is constructed (see Fig. 4.), the distribution is linear with a negative slope, and if a linear regression is computed, the equation is lnΔR/U = 1.3723 – .0569s, where s represents the rank of each log-transformed change in R/U. With the exception of the outlier and largest Y-value point, all the remaining points form a tight linear array. R2 for this regression is .9823. It should be noted that the outlier is associated with the position of the world system during 2000 BCE. The significance of this linearity will be treated in the Discussion, as will the significance of the outlier.
If the natural logarithms of differences between consecutive values of the natural logarithms of the observed minus the expected values of maximum urban areas is plotted against rank, the graph in Fig. 5 is produced, and a linear regression of this distribution yields the following equation: lnΔ[lnCmax O – – lnCmaxE] = .0021 – .0585s. It should be noted that the slope of this rank size distribution is approximately that of the rank size distribution in Fig. 4. Also, it should be clear that the distribution in Fig. 5 also has a single, pronounced outlier, the significance of which will again be treated in the Discussion. This outlier is associated with the natural log difference in lnCmax from 1700 CE to 1800 CE. One further aspect of Fig. 5 should be mentioned, that repeated sequences of points appear, plateaus in fact, one of which appears to consist of 13 points, actually nine at .0904 and four at .0191, which are not clearly resolved graphically. Other repeated sequences are shorter, but pronounced in their occurrence, and these repeated sequences of Y-axis will be discussed in the next section.
Discussion
With respect to the 5000 years of world system history as reflected by either the R/U, rural over urban population ratio, or the corroborating data of log-transformed observed minus expected values of maximum urban area populations that this study covers, global volcanic events (GVEs) occur over the entire span and in no particular apparent pattern. The longest duration between GVEs is 1100 years, while the shortest is less than one century. The actual number of events per century as determined by the number of years which experience those events varies from one to seven, the last being the 7th century CE, and the total of all events as represented by the years of occurrence is 26. However, it is the effects of these GVEs on the world system in its entirety that this paper is intent on investigating.
In the Introduction a dichotomy of cause with respect to civilizational collapse was described. There are those who look upon the proximate effects of physical events as being of prime importance with respect to collapse, while there are other scholars who point out that collapse has a history and that all civilizations subject to the same physical events do not respond in identical ways, some civilizations do not in fact collapse in the face of events that cause others to do so. If the impact of all the GVEs is considered, at no time was the world system as an entity in danger of collapsing, at least from the effects of a GVE. Specifically, if changes in the R/U ratio are considered with respect to the occurrences of GVEs, then there appears to be little credible evidence for GVEs having a consistently negative effect, an effect which would be mirrored in the succeeding century by a decrease in urbanization due to a decrease in rural productivity. When relative risk is computed for the impact of GVEs one century hence, the RR value computed is 1.0882, and the corroborating RR from observed minus expected values of log-transformed Cmax magnitudes is 1.0294. In both cases, values approximating 1.0 imply a neutral effect, unquestionably what one would not expect from a GVE. This could either be a consequence of the robustness of the world system to such perturbations or that while the GVEs were just that, global, their magnitude at a global scale was insignificant. As will be seen by further data, the former possibility is more likely.
If the effects of GVEs are considered two, three, or four centuries beyond the event(s) themselves, then the impact on the world system is more clear cut. When RRs are computed for the R/U ratio as it responds to GVEs two, three, or four centuries beyond the time of occurrence, all values are above one. Specifically, with respect to two, three, and four centuries after GVEs the values are 1.9112, 1.6239, and 1.5068. But these RR values are in support of a decreasing R/U ratio implying either a decrease in R, an increase in U, or both. In any case, this is not intuitively what might be expected. It should be noted that the corroborating data on observed minus expected values for maximum urban area magnitudes are 1.7647, 1.7356, and 1.5751. These RR values are in agreement with the values computed for the effects of GVEs on the R/U ratio, and they are above the threshold of 1.0 in order to be considered as significant. These results are also non-intuitive, since with time one would expect any negative impact of a GVE or set of GVEs to decline, but one would not expect there to be a positive effect at temporal distance from a GVE.
There are then two non-intuitive results apparent here, the first being the non-effect of GVEs on the world system as represented both by changes in the R/U ratio and also by changes in the differences between observed and expected values for maximum urban area magnitudes in the century immediately following such events, and the second being the decreased value of R/U ratios two, three, and four centuries after the occurrence of one or more GVEs. How should these non-intuitive results be explained? It was suggested that the lack of a negative effect of GVEs was due either to the robustness of the world system, a system that can be characterized in large part as a network of urban areas, or that even though the GVEs are global in extent they are not so in effect. In light of the evidence of the positive effects at temporal distance of GVEs on the world system, it is suggested here that the robustness of the system is responsible for buffering the immediate negative effects of GVEs.
The second non-intuitive result, that of increased urbanism (or decreased rural population) two, three, and four centuries after the century in which one or more GVEs occurred, is more problematic. Why would there be a positive global response of the world system that is temporally removed from the event itself? At this point it should be noted that all the GVEs occurred prior to the beginning of the industrial revolution and that the primary energy source exploited by the world system was unquestionably solar and, further, that the world economies at that time were all dependent on solar powered agrarian surplus. At this point it is only reasonable speculation to suggest that the GVEs positively influenced and made more productive the agrarian base of the world system. However, given an improved agrarian base, this in turn would drive more people into urban areas. Increasing the population in urban areas would in turn make mates more available, which would further increase urban populations beyond the effects of rural-to-urban migration. At least for the time being, this speculative mechanism is what is being suggested as potential cause of the delayed positive effects on the world system of GVEs. GVEs release an enormous amount of both dissolved and particulate matter into the atmosphere, which is then via global atmospheric circulation dispersed across the surface of the earth. The dissolved material will ultimately be washed out of the atmosphere by precipitation, while the particulate matter will settle out. Both of these sources of minerals will enrich soils, and with the loss of particulate matter from the atmosphere insolation will increase. Both of these effects, increased insolation and increased concentration of minerals will have a positive effect on plant growth, as both will act to elevate and perhaps change qualitatively the previously established limiting factors. Again, this mechanism is purely speculative but is presented here as one possible explanation of the unique results reported here.
There is actually recent evidence in support of volcanic activity enhancing biological productivity. Achterberg et al. (2013) have reported that the Eyjafjallajökull eruption of 2010 was responsible for enhanced marine productivity in the North Atlantic waters near Iceland. The exact mechanism proposed is that aerosols produced in the eruption were deposited in the surrounding waters over an area of approximately 570,000 square kilometers and in doing so increased the dissolved iron by approximately .2 nM. Increasing the abundance of a limiting factor such as dissolved iron concentration would increase biological productivity; evidence for this is the concomitant draw down of other nutrients including nitrates along with an increase in phytoplankton abundance mirrored by a small increase in phytoplankton deposition. These specific results are reported here as confirmation of the enhancement of biological production due to volcanic activity, and while the above is not on the scale of magnitude of a GVE nor over the same temporal scale of effect, it is suggestive of a potential mechanism for such an effect.
There are also two pieces of data that are intuitively expected effects of GVEs on succeeding centuries. The RRs computed for the effects of more than two GVE years on the both the R/U and O – E magnitudes of succeeding centuries are significantly greater than one, being respectively both 2.8571. Here, quite clearly is evidence that the magnitude of GVE effect does perturb the world system, and, in fact, when considered not only in terms of maximum urban area magnitude, but also in terms of the urban area distribution as characterized by the exponent, γ, in the equations, F = αC-γ and Cmaxγ – Cmax – (γ – 1)T = 0 (Harper 2010a, 2010b), that those maximum urban areas are a part, then the following is observed: 1) After four years of GVE effect in the century spanning 500 BCE to 400 BCE, the degree of urbanization in the world system increased as reflected by the decrease in the respective values of γ, i.e. from 1.4428 to 1.4239 (Harper 2010b). Note here that γ continued to decrease through 100 BCE. 2) After seven years of GVE effect in the century spanning 600 CE to 700 CE γ changed as follows – from 1.3606 to 1.4170, unquestionably a decrease in urbanization. Ruddiman (2005) spends some time describing the world system downturn associated with the 7th century when existence appears to have been as tenuous as during the 14th century, and the GVE effect of this time may well have been a major factor in the political turmoil and pandemic disease that characterized this century. Also of considerable interest is the initial spread of Islam, which occurred during this time. Islam spread from low density communities where plague would have been more difficult to establish and did so when the West and Middle East were in an economically and physically weakened condition. Korotayev et al. (1999) have analyzed the factors associated with the spread of Islam and find clear contributing environmental influences that promoted the spread of Islam. 3) After three years of GVE effect in the century bounded by 1600 CE to 1700 CE, γ again decreased, this time from 1.3879 to 1.3963. While the evidence presented for the 5th century BCE does not reflect an expected effect, the last two data samples, I believe, do reflect a threshold effect, that if the GVEs are pronounced enough, then the world system exhibits perturbation.
Clearly, the 17th century was a century of deurbanization at least in part due to GVE effect (Parker 2008). It is interesting to speculate, however, on the effect of GVEs of similar magnitude during the 21st century. Lewis (2011) in his remarkable book, Bak's Sand Pile: Strategies for a Catastrophic World, makes the point that as complex systems evolve toward self-organized criticality, they become less resilient, i.e. less able to resist and recover from a collapse. This is mirrored by a decrease in the value of γ, which implies larger and more frequent nodes in the world system network, greater connectivity in nodes, and consequently, an increased ability for small, adverse events to percolate through the rest of the system; system complexity leads to system fragility, which, in turn, leads to greater potential for collapse. In light of the fact that all GVEs reported here have occurred during centuries when γ was equal to or greater than 1.3022 and that γ now is between 1.20 and 1.21, it would seem prudent to recognize the world system's fragility, which is greater than it has ever been in history.
The fact that the system wide responses to GVEs of large enough magnitude occur is further evidence of the behavior of an integrated system, and when rank size distributions are constructed of both the log-transformed changes in R/U, lnΔ(R/U), and in observed minus expected values of maximum urban area magnitudes, lnΔ[lnCmaxO – lnCmaxE], the distribution produced is linear, implying that effectively all changes are part of the same pattern. There are also two outlier points, one from each distribution, which will be discussed separately.
The linear distributions referred to above are indicative of the type of distributions characteristic of systems which are subject to the behavior of self-organized criticality, SOC (Bak 1996). It should be noted that both distributions exhibit essentially the same slope, –.0569 for lnΔ(R/U) and –.0585 for lnΔ[lnCmax O – lnCmax E], which of course implies system integration with respect to world system response. There are several consequences of systems exhibiting SOC. First, if the world system is at a critical state, then the changes represented in both distributions can be expected to occur in the future and to do so episodically. In other words, the world system is at some level of complexity which is maximum for the functioning of the system and part-and-parcel of that maximum complexity are the changes, some of them abrupt, represented in those distributions. This includes the responses to the majority of GVEs. Also implied in the regularity of this distribution is the fact that these changes are largely endemic changes, i.e. they are due to the nature and structure of the world system itself and are internally originated. If they were not, then the linear distribution would not be so regular or perhaps not even linear.
As previously mentioned, there are two distinct outliers, one from each distribution. The first of these to be discussed is the one represented in Fig. 4 and is the largest value on the y-axis and well above the trend line. This particular point occurring at 2000 BCE is associated with a change in maximum urban area size from a population of 100,000 persons in 2100 BCE to a population of 40,000 in 2000 BCE, and this outlier change follows a GVE. There is also a clear evidence of significant drought during this time (Weiss and Bradley 2001), and while it is not possible here to disentangle the relationship between GVE, drought, and precipitous decrease in maximum urban area size, it is entirely possible that this particular point represents the perfect storm of factors which in sum pushed a system already in overshoot with respect to urban area size into a deep collapse, one not recoverable from for several hundred years.
With regard to the second outlier, this time related to the distribution, lnΔ[lnCmax O – lnCmax E], this outlier is associated with the change from 1700 CE to 1800 CE. Inspection of Fig. 3 will reveal an exceptionally small change. In fact, the condition of the distribution from 1700 CE to 1900 CE is one of near stasis. The world system during this time was going through a period of about 400 years in which the change in the system, characterized by the following sequence of γ and maximum urban area values.
| | | | | | |
| | | | | | |
| | | | | | |
During the same span of time the population of the world system grew from 350 million to 813 million. Even though Cmax changes little during this same period, the increase in γ implies actual deurbanization, even though the change in Cmax, all occurring in the last century of this sequence, is slightly positive. However, the log-transformed difference between observed and expected values of Cmax decreases over this period of time until the last observed value almost equals the expected value. Consequently, the outlier is a product of a trend in deurbanization in the face of increasing total population of the world system and is in no way associated directly with GVE effect.
Finally, it is quite clear that when RR is computed using a threshold of greater than two-year equivalents of GVEs or two- or fewer-year equivalents of GVEs than there is a positive effect, that is the year equivalents of GVEs greater than two are associated with increases in the R/U ratio or decreases in lnCmax. This is the intuitive result expected for all GVEs, but clearly lacking as seen in the data presented. In other words, when the year equivalents of GVEs exceeds two, then deurbanization should be expected, at least as far as the data presented here are concerned. Also, within the proposed mechanism for the positive effects of GVEs as proposed earlier, crossing the threshold of two-year equivalents of GVEs will result in reduced production by the world system as a whole. Interestingly, historically this has occurred twice, once in the 7th century and once in the 17th century. However, in the 5th century BCE there were four-year equivalents of GVEs, but the world system became more urbanized, not less, implying that other factors as yet to be identified, may override large GVE effects. It is suggested here that this threshold may be used as a rule-of-thumb measure of the robustness of the world system in the face of GVE perturbation, but only as a rule-of-thumb measure.
The data presented in this paper suggest the following: a) that the world system is robust in the face of GVEs in general; b) that the changes in the world system either with respect to R/U or lnCmax occur as part of a pattern and are therefore best considered as endogenous to the system, implying consonance with those scholars who propose that societal collapse is a function of the integrity of the system itself; c) that in the face of GVEs of great enough magnitude to exceed two-year equivalents very definitely the world system responds by becoming less urbanized, most probably due to a decreased ability to produce an agrarian surplus. This particular result agrees with those scholars who suggest exogenous causes of societal collapse.
Summary
1. Historically, there are two positions with respect to the causes of societal collapse. Either societal collapse is caused by rapid physical changes in the environment, or they are a consequence of the structure and therefore the deep history of the collapsed society.
2. This paper focuses on the effect of GVEs on the integrity of the world system as a whole.
3. The record of GVEs, as determined by bristlecone pine tree rings, is used to putatively establish context against which both the ratio of rural to urban populations, R/U, and the pattern of log-transformed values of maximum urban area, lnCmax, are inspected for cause-and-effect relationships.
4. The effects of GVEs on both R/U and lnCmax is investigated using relative risk as a measure of relatedness.
5. Rank size-frequency of log-transformed changes in both R/U and lnCmax are constructed to investigate the integrity of the world system.
6. The results of investigating the relationship between decrease in lnCmax or increase in R/U and the occurrence of GVEs showed little effect in the following century with relative risks of 1.0882 for R/U data and 1.0296 for lnCmax data. These results imply that GVEs in general had little effect either negatively or positively in the immediately succeeding century.
7. In the 2nd, 3rd, and 4th centuries after a GVE century, however, there was an effect associated with both the R/U and lnCmax data, a counter-intuitive one. In both sets of data there was a clearly positive effect, i.e. the R/U ratio decreased and the lnCmax increased. The trends of both sets of data over this 300-year period mirrored each other.
8. A mechanism is proposed by which these non-intuitive results may be explained, however, at the level of development of this paper this mechanism is speculative only. However, a recently reported effect of volcanism positively affecting primary production in a marine ecosystem is cited as corollary support.
9. Two outlier points have been identified, one each for R/U and lnCmax, and each is given an explanation in the context of the data.
10. When rank-frequency distributions are constructed of the log-transformed differences of both sets of data, the distributions are linear with slopes of –.0569 for R/U and –.0585 for lnCmax.
11. When the RR is computed for the number of years greater than two per century against negative effects occurring in immediately succeeding centuries, the values are: R/U = 2.8571, and lnCmax = 2.8571, showing a reasonably strong relationship.
12. The suggestion is proposed that a century with greater than two year equivalents of GVEs represents a tipping point or threshold in which the world system does exhibit change in response to those GVEs.
13. The current fragility of the world system is noted in the face of GVEs of similar magnitude.
14. It is noted that the patterns of change in both R/U and lnCmax represent a cohesive system, concurring with scholars who support endogenous causes of collapse; it is also noted that the world system does adjust by deurbanization in the face of greater than two-year equivalents of GVEs, concurring with those who support adverse environmental or physical changes causing societal collapse.
Acknowledgement
I wish to acknowledge my wife, Joan, for providing the context for this paper. I also wish to acknowledge the generous support of Andrey Korotayev and Leonid Grinin, and the excellent editorial help of Kseniya Ukhova. However, any errors in this paper are mine and mine alone for which I take full responsibility.
Achterberg E. P., Moore C. M., Henson S. A., Steigenberger S., Stohl A., Eckhardt S., Avendano L. C., Cassidy M., Hembury D., Klar J. K., Lucas M. I., Macey A. I., Marsay C. M., Ryan-Keogh T. J. 2013. Natural Iron Fertilization by the Eyjafjallajökull Volcanic Eruption. Geophysical Research Letters. URL: http://onlinelibrary.wiley.com/doi/10.1002/grl.50221/abstract.
Bak P. 1996. How Nature Works: The Science of Self-Organized Criticality. New York: Copernicus – Springer-Verlag.
Chandler T. 1987. 4000 Years of Urban Growth. Lewiston, NY: Edwin Mellen Press.
Diamond J. 2005. Collapse: How Societies Choose to Fail and Survive. New York: Viking Press.
Gill R. B. 2000. The Great Maya Droughts: Water, Life, and Death. Albuquerque: University of New Mexico Press.
Harper T. 2010a. The Trajectory of the World System over the Last 5000 Years. History and Mathematics / Ed. by L. Grinin, P. Herrmann, A. Korotayev, A. Tausch, pp. 13–63. Volgograd: Uchitel.
Harper T. 2010b. The Macropattern of Urbanization over the Last 5000 Years of World System History. Social Evolution & History 9(1): 115–133.
Janssen M. A., Kohler T. A., and Sheffer M. 2003. Sunk-Cost Effects Made Ancient Societies Vulnerable to Collapse. Current Anthropology 44(5): 722–728.
Korotayev A., Klimenko V., and Proussakov D. 1999. Origins of Islam: Political-Anthropological and Environmental Context. Acta Orientalia e Scientiarum Hung 52(3–4): 243–276.
Lewis T. G. 2011. Bak's Sandpile: Strategies for a Catastrophic World. Williams, CA: Agile Press.
McNeil W. H. 1977. Plagues and People. New York: Anchor Press.
Modelski G. 2003. World Cities: –3000 to 2000. Washington, D.C.: FAROS.
Nur A., and Burgess D. 2007. Apocalypse: Earthquakes, Archeology, and the Wrath of God. Princeton, NY: Princeton University Press.
Parker G. 2008. Crisis and Catastrophe: The Global Crisis of the 17th Century Reconsidered. The American Historical Review 113(4): 1053–1079. doi: 10.1086/ahr. 113.4.1053.
Ruddiman W. F. 2005. Plows, Plagues, and Petroleum: How Humans Took Control of Climate. Princeton, NY: Princeton University Press.
Salzer M. W., and Hughes M. K. 2007. Bristlecone Pine Tree Rings and Volcanic Eruptions over the Last 5000 Years. Quaternary Research 67: 57–68.
Tainter J. 1988. The Collapse of Complex Societies. New York: Cambridge University Press.
Weiss H., and Bradley R. S. 2001. What Drives Societal Collapse? Science 291(5504): 609–610.
Relative risk is a statistic used to demonstrate association between variables. It is determined by calculating the risk or probability of an event occurring in the presence of some stated condition divided by the risk of the event occurring in the absence of that condition. The calculation of relative risk is best explained with the use of a 2×2 table, and the specific data on R/U being effected negatively the second century after a GVE century will be used to demonstrate that calculation. Relative risk can be computed by dividing a/(a + b) by c/(c + d) or a(c + d)/c(a + b). See Table 5 below for context of the variables a, b, c, and d.
| | | | |
| | | | |
| | | | |
| | | | |
RR = (19×34)/(13×26) = 1.9112.