Globalization and Mathematical Modeling of Global Development

Almanac: Globalistics and Globalization Studies
It is demonstrated that the variation in demographic, economic and cultural macrodynamics of the world over the last ten millennia can be accounted for in a very accurate way by very simple mathematical models. It is shown that up to the 1970s the hyperbolic growth of the world population was accompanied by the quadratic-hyperbolic growth of the world GDP and these are very tightly connected processes, actually two dimensions of one process propelled by the nonlinear second order positive feedback loops between the technological development and demographic growth. The suggested approach throws a new light on our understanding of globalization processes. Against the background of the mathematical models discussed in the article, the fact that the world population growth followed the hyperbolic pattern in the 10th – 1st millennia BCE indicates that the majority of the world population already functioned within a single system in that period. A few millennia before CE the World System covered only a small portion of the Earth landmass but already at that time it encompassed the majority of the world population. In the 3rd millennium BCE, with the diffusion to East Asia of major Middle Eastern technological innovations which led to a radical growth of the carrying capacity and, hence, population in this part of the world, the World System incorporated East Asia, and by the end of the 1st millennium BCE the overwhelming majority of the world population lived just within the World System. Thus, most of the world population got ‘globalized’ many millennia before ‘the century of globalization’, though the World System had only encompassed the whole of the Earth landmass in the 2nd millennium CE.
Keywords: mathematical modeling, global processes, the World System, demography, economic growth, technology, diffusion
In 1960, von Foerster, Mora, and Amiot published, in the journal Science, a striking discovery. They showed that between 1 and 1958 CE the world's population (N) dynamics can be described in an extremely accurate way with an astonishingly simple equation:[1]

where Nt is the world population at time t, and C and t0 are constants, with t0 corresponding to an absolute limit (‘singularity’ point) at which N would become infinite.
Parameter t0 was estimated by von Foerster and his colleagues as 2026.87, which corresponds to November 13, 2006; this made it possible for them to supply their article with a public-relations masterpiece title – ‘Doomsday: Friday, 13 November, A.D. 2026’ (von Foerster, Mora, and Amiot 1960).[2]
Note that the graphic representation of this equation is nothing but a hyperbola; thus, the growth pattern described is denoted as ‘hyperbolic’.
Note that if von Foerster, Mora, and Amiot also had at their disposal, in addition to world population data, data on the world GDP dynamics for 1–1973 (published, however, only in 2001 by Maddison [2001]), they could have made another striking ‘prediction’ – that on Saturday, 23 July, A.D. 2005 an ‘economic doomsday’ would take place; that is, on that day the world GDP would become infinite if the economic growth trend observed in 1–1973 CE continued. They also would have found that in 1–1973 CE the world GDP growth followed a quadratic-hyperbolic rather than simple hyperbolic pattern.
Indeed, Maddison's estimates of the world GDP dynamics for 1–1973 CE are almost perfectly approximated by the following equation:

where Gt is the world GDP (in billions of 1990 international dollars, in purchasing power parity [PPP]) in year t, С = 17355487.3 and t0 = 2005.56 (see Fig. 1).
The black markers correspond to Maddison's (2001) estimates. The grey solid line has been generated by the following equation:
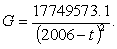
Actually, as was mentioned above, the best fit is achieved with С = 17355487.3 and t0 = 2005.56 (which gives just the ‘doomsday Saturday, 23 July, 2005’), but we have decided to keep hereafter to integer numbered years.
Note that the von Foerster equation, ![]() , is just the solution for the following differential equation (see, e.g., Korotayev, Malkov, and Khaltourina 2006a: 119–120):
, is just the solution for the following differential equation (see, e.g., Korotayev, Malkov, and Khaltourina 2006a: 119–120):

This equation can be also written as:

where  .
.
Fig. 1. World GDP Dynamics, 1–1973 CE (in billions of 1990 international dollars, PPP): the fit between predictions of a quadratic-hyperbolic model and the observed data

Note: R = .9993, R2 = .9986, p << .0001.
Note that the von Foerster equation, ![]() , is just the solution for the following differential equation (see, e.g., Korotayev, Malkov, and Khaltourina 2006a: 119–120):
, is just the solution for the following differential equation (see, e.g., Korotayev, Malkov, and Khaltourina 2006a: 119–120):
This equation can be also written as:
where .
What is the meaning of this mathematical expression,  ? In our context dN/dt denotes the absolute population growth rate at a certain moment of time. Hence, this equation states that the absolute population growth rate at any moment of time should be proportional to the square of population at this moment.
The main mathematical models (Kremer 1993; Cohen 1995; Podlazov 2000, 2001, 2002, 2004; Tsirel 2004; Korotayev, Malkov, and Khaltourina 2006a: 21–36) of the world population hyperbolic growth are based on the two following assumptions:
1) ‘the Malthusian (1978) assumption that population is limited by the available technology, so that the growth rate of population is proportional to the growth rate of technology’ (Kremer 1993: 681–682).[3] This statement looks quite convincing. Indeed, throughout most of human history the world population was limited by the technologically determined ceiling of the carrying capacity of land. For example, with foraging subsistence technologies the Earth could not support more than 10 million people, because the amount of naturally available useful biomass on this planet is limited, and the world population could only grow over this limit when people started to apply various means to artificially increase the amount of available biomass, that is with the transition from foraging to food production. However, the extensive agriculture also can only support a limited number of people, and further growth of the world population only became possible with the intensification of agriculture and other technological improvements (see, e.g., Turchin 2003; Korotayev, Malkov, and Khaltourina 2006a, 2006b; Korotayev and Khaltourina 2006).
However, as is well known, the technological level is not a constant, but a variable (see, e.g., Grinin 2006, 2007). And in order to describe its dynamics the second basic assumption is employed:
2) ‘High population spurs technological change because it increases the number of potential inventors…[4] In a larger population there will be proportionally more people lucky or smart enough to come up with new ideas’ (Kremer 1993: 685), thus, ‘the growth rate of technology is proportional to total population’.[5] In fact, here Kremer uses the main assumption of the Endogenous Technological Growth theory (Kuznets 1960; Grossman and Helpman 1991; Aghion and Howitt 1992, 1998; Simon 1977, 1981, 2000; Komlos and Nefedov 2002; Jones 1995, 2003, 2005 etc.). As this supposition, to our knowledge, was first proposed by Simon Kuznets (1960), we shall denote the corresponding type of dynamics as ‘Kuznetsian’,[6] while the systems in which the ‘Kuznetsian’ population-technological dynamics is combined with the ‘Malthusian’ demographic one will be denoted as ‘Malthusian-Kuznetsian’. In general, we find this assumption rather plausible – in fact, it is quite probable that, other things being equal, within a given period of time, one billion people will make approximately one thousand times more inventions than one million people.
This assumption was expressed by Kremer mathematically in the following way:
 .
.Actually, this equation says just that the absolute technological growth rate at a given moment of time is proportional to the technological level observed at this moment (the wider is the technological base, the more inventions could be made on its basis), and, on the other hand, it is proportional to the population (the larger the population, the larger the number of potential inventors).[7]
The resultant models provide a rather convincing explanation of why throughout most of human history the world population followed the hyperbolic pattern with the absolute population growth rate tending to be proportional to N2. For example, why will the growth of population from, say, 10 million to 100 million, result in the growth of dN/dt 100 times? The above mentioned models explain this rather convincingly. The point is that the growth of world population from 10 to 100 million implies that human technology also grew approximately 10 times (given that it will have proven, after all, to be able to support a ten times larger population). On the other hand, the tenfold population growth also implies a tenfold growth of the number of potential inventors, and, hence, a tenfold increase in the relative technological growth rate. Hence, the absolute technological growth rate will grow 10 × 10 = 100 times (as, in accordance with equation (5), an order of magnitude higher number of people having at their disposal an order of magnitude wider technological basis would tend to make two orders of magnitude more inventions). And as N tends to the technologically determined carrying capacity ceiling, we have good reason to expect that dN/dt will also grow just by about 100 times.
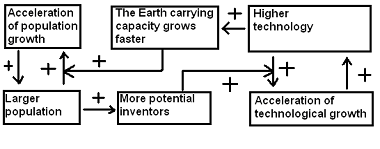
In fact, it can be demonstrated (see, e.g., Korotayev, Malkov, and Khaltourina 2006a, 2006b; Korotayev and Khaltourina 2006) that the hyperbolic pattern of the world's population growth could be accounted for by the nonlinear second order positive feedback mechanism that was shown long ago to generate just the hyperbolic growth, known also as the ‘blow-up regime’ (see, e.g., Kurdjumov 1999; Knyazeva and Kurdjumov 2005). In our case this nonlinear second order positive feedback looks as follows: the more people – the more potential inventors – the faster technological growth – the faster growth of the Earth's carrying capacity – the faster population growth – with more people you also have more potential inventors – hence, faster technological growth, and so on (see Fig. 2).
Note that the relationship between technological development and demographic growth cannot be analyzed through any simple cause-and-effect model, as we observe a true dynamic relationship between these two processes – each of them is both the cause and the effect of the other.
It is remarkable that this model suggests ways to answer one of the main objections raised against the hyperbolic models of the world's population growth. Indeed, at present the academic social science community has not accepted the mathematical models of world population growth as a hyperbolic one.[8] We believe that there are substantial reasons for such a position, and that the authors of the respective models are as much to blame for this rejection as are social scientists.
Fig. 2. Block scheme of the nonlinear second order positive feedback between technological development and demographic growth
Indeed, all these models are based on an assumption that world population can be treated as having been an integrated system for many centuries, if not millennia, before 1492. Already in 1960, von Foerster, Mora, and Amiot spelled out this assumption in a rather explicit way:
However, what may be true for elements which, because of lack of adequate communication among each other, have to resort to a competitive, (almost) zero-sum multiperson game may be false for elements that possess a system of communication which enables them to form coalitions until all elements are so strongly linked that the population as a whole can be considered from a game-theoretical point of view as a single person playing a two-person game with nature as its opponent (von Foerster, Mora, and Amiot 1960: 1292).
However, did, for example, in 1–1500 CE, the inhabitants of, say, Central Asia, Tasmania, Hawaii, Terra del Fuego, the Kalahari etc. (i.e. just the world population) really have ‘adequate communication’ to make ‘all elements… so strongly linked that the population as a whole can be considered from a game-theoretical point of view as a single person playing a two-person game with nature as its opponent’? For any historically-minded social scientist the answer to this question is perfectly clear and, of course, it is squarely negative. Against this background it is hardly surprising that those social scientists who have happened to come across hyperbolic models for world population growth have tended to treat them merely as ‘demographic adventures of physicists’ (note that indeed, nine out of eleven currently known authors of such models are physicists); none of the respective authors (von Foerster, Mora, and Amiot 1960; von Hoerner 1975; Kapitza 1992, 1999; Kremer 1993; Cohen 1995; Podlazov 2000, 2001, 2002, 2004; Johansen and Sornette 2001; Tsirel 2004), after all, has provided any convincing answer to the question above.
However, it is not so difficult to provide such an answer.
The hyperbolic trend observed for the world population growth after 10000 BCE does appear to be primarily a product of the growth of quite a real system, a system that seems to have originated in West Asia around that time in direct connection with the Neolithic Revolution. With Andre Gunder Frank (1990, 1993; Frank and Gills 1994), we denote this system as ‘the World System’ (see also, e.g., Modelski 2000, 2003; Devezas and Modelski 2003). The presence of the hyperbolic trend itself indicates that the major part of the entity in question had some systemic unity, and the evidence for this unity is readily available. Indeed, we have evidence for the systematic spread of major innovations (domesticated cereals, cattle, sheep, goats, horses, plow, wheel, copper, bronze, and later iron technology, and so on) throughout the whole North African – Eurasian Oikumene for a few millennia BCE (see, e.g., Chubarov 1991, or Diamond 1999 for a synthesis of such evidence). As a result, the evolution of societies of this part of the world already at this time cannot be regarded as truly independent. By the end of the 1st millennium BCE we observe a belt of cultures, stretching from the Atlantic to the Pacific, with an astonishingly similar level of cultural complexity characterized by agricultural production of wheat and other specific cereals, the breeding of cattle, sheep, and goats; use of the plow, iron metallurgy, and wheeled transport; development of professional armies and cavalries deploying rather similar weapons; elaborate bureaucracies, and Axial Age ideologies, and so on – this list could be extended for pages. A few millennia before, we would find another belt of societies strikingly similar in level and character of cultural complexity, stretching from the Balkans up to the Indus Valley outskirts (Peregrine and Ember 2001: vols 4 and 8; Peregrine 2003). Note that in both cases, the respective entities included the major part of the contemporary world's population (see, e.g., McEvedy and Jones 1978; Durand 1977 etc.). We would interpret this as a tangible result of the World System's functioning. The alternative explanations would involve a sort of miraculous scenario – that these cultures with strikingly similar levels and character of complexity somehow developed independently of one another in a very large but continuous zone, while for some reason nothing comparable to them appeared elsewhere in the other parts of the world, which were not parts of the World System. We find such an alternative explanation highly implausible.
Thus, we would tend to treat the world population's hyperbolic growth pattern as reflecting the growth of quite a real entity, the World System.
A few other points seem to be relevant here. Of course, there would be no grounds for speaking about a World System stretching from the Atlantic to the Pacific, even at the beginning of the 1st millennium CE, if we applied the ‘bulk-good’ criterion suggested by Wallerstein (1974, 1987, 2004), as there was no movement of bulk goods at all between, say, China and Europe at this time (as we have no reason to disagree with Wallerstein in his classification of the 1st century Chinese silk reaching Europe as a luxury rather than a bulk good). However, the 1st century CE (and even the 1st millennium BCE) World System definitely qualifies as such if we apply the ‘softer’ information-network criterion suggested by Chase-Dunn and Hall (1997). Note that at our level of analysis the presence of an information network covering the whole World System is a perfectly sufficient condition, which makes it possible to consider this system as a single evolving entity. Yet, in the 1st millennium BCE any bulk goods could hardly penetrate from the Pacific coast of Eurasia to its Atlantic coast. However, the World System had reached by that time such a level of integration that iron metallurgy could spread through the whole of the World System within a few centuries.
Of course, in the millennia preceding the European colonization of Tasmania its population dynamics – oscillating around the 4000 level (e.g., Diamond 1999) – were not influenced by World System population dynamics and did not influence it at all. However, such facts just suggest that since the 10th millennium BCE the dynamics of the world population reflect very vividly the very dynamics of the World System population.
We have also shown (Korotayev, Malkov, and Khaltourina 2006a: 34–66) that for the period prior to the 1970s the World System economic and demographic macrodynamics driven by the above mentioned positive feedback loops can be described mathematically in a rather accurate way with the following extremely simple mathematical model:

while the world GDP (G) can be calculated using the following equation:

where G is the world GDP, N is population, and S is the produced surplus per capita, over the amount (m) minimally necessary to reproduce the population with a zero growth rate in a Malthusian system (thus, S = g – m, where g denotes per capita GDP); a and b are parameters.
Note that the mathematical analysis of the basic model (not described here) suggests that up to the 1970s the amount of S (per capita surplus produced at the given level of World System development) should be proportional, in the long run, to the World System's population: S = kN. Our statistical analysis of available empirical data has confirmed this theoretical proportionality (Korotayev, Malkov, and Khaltourina 2006a: 49–50). Thus, in the right-hand side of equation (6) S can be replaced with kN, and as a result we arrive at the following equation:
 .
.As we remember, the solution of this type of differential equations is
, and this produces simply a hyperbolic curve.
As, according to our model, S can be approximated as kN, its long-term dynamics can be approximated with the following equation:
 .
.Thus, the long-term dynamics of the most dynamic component of the world GDP, SN, ‘the world surplus product’, can be approximated as follows:
 .
.Of course, this suggests that the long-term world GDP dynamics up to the early 1970s must be approximated better by a quadratic hyperbola than by a simple one; and, as we could see above (see Fig. 1), this approximation works very effectively indeed.
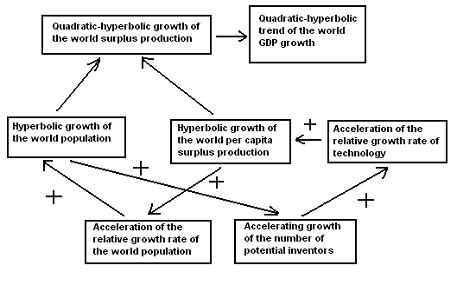
Thus, up to the 1970s the hyperbolic growth of the world population was accompanied by the quadratic-hyperbolic growth of the world GDP, just as is suggested by our model. Note that the hyperbolic growth of the world population and the quadratic-hyperbolic growth of the world GDP are very tightly connected processes, actually two sides of the same coin, two dimensions of one process propelled by the nonlinear second order positive feedback loops between the technological development and demographic growth (see Fig. 3).
Note that the suggested approach throws a new light on our understanding of globalization processes. Against the background of the mathematical models discussed above the fact that the world population growth followed the hyperbolic pattern in the 10th – 1st millennia BCE (see, e.g., Korotayev, Malkov, and Khaltourina 2006b: 147–162) indicates that the majority of the world population already functioned within a single system in this period. Let us recollect that a few millennia before CE the World System covered only a small portion of the Earth landmass (stretching from the Balkans up to the western outskirts of the Indus Valley), but already at that time it encompassed the majority (though in no way overwhelming) of the world population. In the 3rd millennium BCE, with the diffusion to East Asia of such major Middle Eastern technological innovations as domesticated wheat, barley, cattle, sheep, goats and many others (which led to a radical growth of the carrying capacity and, hence, population in this part of the world), the World System incorporated East Asia, and by the end of the 1st millennium BCE the overwhelming majority of the world population lived just within the World System.
Fig. 3. Block Scheme of the Generation of Quadratic-Hyperbolic Trend of the World Economic Growth by the Nonlinear Second Order Positive Feedback between Technological Development and Demographic Growth
Thus, most of the world population got ‘globalized’ many millennia before ‘the century of globalization’, though the World System had only encompassed the whole of the Earth landmass in the 2nd millennium CE.
However, in no way was the spatial expansion of the World System the only dimension of the globalization process in the pre-Modern age. Another important dimension of the globalization trends since the 10th millennium BCE was the growing integration of the developing World System. The mathematical models of the World System development clarify our understanding of some other dimensions of the globalization processes. A certain trend can be only detected at a scale at least one order of magnitude wider than the characteristic time of those changes that create the respective trend. Against this background it is hardly surprising to find the following: in the 10th – 1st millennia BCE it typically took major innovation centuries to diffuse throughout the World System, and we can only detect the hyperbolic growth of the world population at the scale of millennia. In the 2nd millennium CE this time of diffusion decreased to the order of decades, and for this period we are able to detect the hyperbolic growth pattern at the scale of centuries. By the end of the 19th century, the time of the major technological innovations' diffusion throughout most of the World System decreased further to the order of years, and for 1870–1970 it turns out to be possible to detect the hyperbolic growth pattern at the scale of decades (see, e.g., Kremer 1993). Against the background of the above discussed mathematical models this, of course, suggests an orders of magnitude growth of the World System integration during the period under study, specifying another important dimension of the long-term globalization processes.
References
Aghion, P., and Howitt, P. 1992. A Model of Growth through Creative Destruction. Econometrica 60: 323–352.
Aghion, P., and Howitt, P. 1998. Endogenous Growth Theory. Cambridge, MA: MIT Press.
Boserup, E. 1965. The Conditions of Agricultural Growth: The Economics of Agrarian Change under Population Pressure. Chicago, IL: Aldine.
Chase-Dunn, C., and Hall, T. 1997. Rise and Demise: Comparing World-Systems. Boulder, CO: Westview Press.
Chubarov, V. V. 1991. The Near-Eastern Locomotive: The Tempos of Development of Technique and Technology in the Ancient World. In Korotayev, A. V., and Chubarov, V. V. (eds.), The Archaic Society: The Main Problems of Sociology of Development. Vol. 1 (pp. 92–135). Moscow: Institute of History of the USSR of AN USSR. In Russian.
Cohen, J. E. 1995. Population Growth and Earth's Carrying Capacity. Science 269(5222): 341–346.
Devezas, T., and Modelski, G. 2003. Power Law Behavior and World System Evolution. Technological Forecasting and Social Change 70: 819–859.
Diamond, J. 1999. Guns, Germs, and Steel: The Fates of Human Societies. New York: Norton.
Durand, J. D. 1977. Historical Estimates of World Population: An Evaluation. Population and Development Review 3(3): 255–296.
Foerster, H. von, Mora, P., and Amiot, L. 1960. Doomsday: Friday, 13 November, A. D. 2026. At this Date Human Population will Approach Infinity if it Grows as it has Grown in the Last Two Millennia. Science 132: 1291–5.
Frank, A. G. 1990. A Theoretical Introduction to 5,000 Years of World System History. Review 13(2): 155–248.
Frank, A. G. 1993. The Bronze Age World System and its Cycles. Current Anthropology 34: 383–413.
Frank, A. G., and Gills, B. 1994. (Eds.). The World System: 500 or 5000 Years? London: Routledge.
Grinin, L. E. 2006. Periodization of History: A Theoretic-Mathematical Analysis. In Grinin, L. E., de Munck, V., and Korotayev, A. V. (eds.), History & Mathematics: Analyzing and Modeling Global Development (pp. 10–38). Moscow: KomKniga.
Grinin, L. E. 2007. Production Revolutions and the Periodization of History. Herald of the Russian Academy of Sciences 77(2): 150–156.
Grossman, G., and Helpman, E. 1991. Innovation and Growth in the Global Economy. Cambridge, MA: MIT Press.
Hoerner, S. J. von. 1975. Population Explosion and Interstellar Expansion. Journal of the British Interplanetary Society 28: 691–712.
Johansen, A., and Sornette, D. 2001. Finite-time Singularity in the Dynamics of the World Population and Economic Indices. Physica A 294(3–4): 465–502.
Jones, Ch. I. 1995. R & D-Based Models of Economic Growth. The Journal of Political Economy 103: 759–784.
Jones, Ch. I. 2003. Population and Ideas: A Theory of Endogenous Growth. In Aghion, P., Frydman, R., Stiglitz, J., and Woodford, M. (eds.), Knowledge, Information, and Expectations in Modern Macroeconomics: In Honor of Edmund S. Phelps (pp. 498–521). Princeton, NJ: Princeton University Press.
Jones, Ch. I. 2005. The Shape of Production Functions and the Direction of Technical Change. The Quarterly Journal of Economics 120: 517–549.
Kapitza, S. P. 1992. The Mathematical Model of World Population Growth. Matematicheskoe modelirovanie 4(6): 65–79. In Russian.
Kapitza, S. P. 1999. How Many People Lived, Lives and will Live on the Earth. Moscow: Nauka. In Russian.
Knyazeva, E. N., and Kurdjumov, S. P. 2005. The Bases of Synergetics. Moscow: URSS. In Russian.
Komlos, J., and Nefedov, S. 2002. A Compact Macromodel of Pre-Industrial Population Growth. Historical Methods 35: 92–94.
Korotayev, A., and Khaltourina, D. 2006. Introduction to Social Macrodynamics: Secular Cycles and Millennial Trends in Africa. Moscow: URSS.
Korotayev, A., Malkov, A., and Khaltourina, D. 2006a. Introduction to Social Macrodynamics: Compact Macromodels of the World System Growth. Moscow: URSS.
Korotayev, A., Malkov, A., and Khaltourina, D. 2006b. Introduction to Social Macrodynamics: Secular Cycles and Millennial Trends. Moscow: URSS.
Kremer, M. 1993. Population Growth and Technological Change: One Million B.C. to 1990. The Quarterly Journal of Economics 108: 681–716.
Kurdjumov, S. P. 1999. Regimes with Sharpening. The Evolution of Idea: The Laws of Coevolution of the Complex Structures. Moscow: Nauka. In Russian.
Kuznets, S. 1960. Population Change and Aggregate Output. In Becker, G. S. (ed.), Demographic and Economic Change in Developed Countries (pp. 324–340). Princeton, NJ: Princeton University Press.
Lee, R. D. 1986. Malthus and Boserup: A Dynamic Synthesis. In Coleman, D., and Schofield, R. (eds.), The State of Population Theory: Forward from Malthus (pp. 96–130). Oxford: Blackwell.
Maddison, A. 2001. Monitoring the World Economy: A Millennial Perspective. Paris: OECD.
Malthus, T. 1978 [1798]. Population: The First Essay. Ann Arbor, MI: University of Michigan Press.
McEvedy, C., and Jones, R. 1978. Atlas of World Population History. New York: Facts on File.
Modelski, G. 2000. World System Evolution. In Denemark, R. A., Friedman, J., Gills, B. K., and Modelski, G. (eds.), World System History: The Social Science of Long-term Change (pp. 24–53). London: Routledge.
Modelski, G. 2003. World Cities: –3000 to 2000. Washington, DC: FAROS 2000.
Peregrine, P. 2003. Atlas of Cultural Evolition. World Cultures 14: 2–88.
Peregrine, P., and Ember, M. 2001. (Eds.). Encyclopedia of Prehistory. 9 vols. New York: Kluwer.
Podlazov, A. V. 2000. Theoretical Demography as the Basis of Mathematical History. Moscow: IPM RAN. In Russian.
Podlazov, A. V. 2001. The Basic Equation of Theoretical Demography and the Model of Global Demographic Transition. Moscow: IPM RAN. In Russian.
Podlazov, A. V. 2002. Theoretical Demography. Models of Population Growth and Global Demographic Transition. In Malinetski, G. G., and Kurdjumov, S. P. (eds.), A New Development in Complexity Studies. The View into the 3rd Millennium (pp. 324–345). Moscow: Nauka. In Russian.
Podlazov, A. V. 2004. Theory of the Global Demographic Process. In Dmitriev, M. G., and Petrov, A. P. (eds.), Mathematical Modeling of Social and Economic Dynamics (pp. 269–272). Moscow: Russian State Social University.
Shishkov, U. V. 2005. The Demographic Adventures of a Physicist. Obschestvennye nauki i sovremennost 2: 155–164. In Russian.
Simon, J. 1977. The Economics of Population Growth. Princeton, NJ: Princeton University Press.
Simon, J. 1981. The Ultimate Resource. Princeton, NJ: Princeton University Press.
Simon, J. 2000. The Great Breakthrough and its Cause. Ann Arbor, MI: University of Michigan Press.
Tsirel, S. V. 2004. On the Possible Reasons for the Hyperexponential Growth of the Earth Population. In Dmitriev, M. G., and Petrov, A. P. (eds.), Mathematical Modeling of Social and Economic Dynamics (pp. 367–369). Moscow: Russian State Social University.
Turchin, P. 2003. Historical Dynamics: Why States Rise and Fall. Princeton, NJ: Princeton University Press.
Wallerstein, I. 1974. The Modern World-System. Vol. 1. Capitalist Agriculture and the Origins of the European World-Economy in the Sixteenth Century. New York: Academic Press.
Wallerstein, I. 1987. World-Systems Analysis. In Giddens, A., and Turner, J. (eds.), Social Theory Today (pp. 309–324). Cambridge: Polity Press.
Wallerstein, I. 2004. World-Systems Analysis: An Introduction. Durham, NC: Duke University Press.
[1] To be exact, the equation proposed by von Foerster and his colleagues looked as follows: . However, as has been shown by von Hoerner (1975) and Kapitza (1992, 1999), it can be written more succinctly as .
[2] Of course, von Foerster and his colleagues did not imply that the world population on that day could actually become infinite. The real implication was that the world population growth pattern that was followed for many centuries prior to 1960 was about to come to an end and be transformed into a radically different pattern. Note that this prediction began to be fulfilled only in a few years after the ‘Doomsday’ paper was published, since the 1960 the world population growth began to diverge more and more from the blow-up regime, and now it is not hyperbolic any more (see, e.g., Korotayev, Malkov, and Khaltourina 2006a, where we present a compact mathematical model that describes both the hyperbolic development of the World System in the period prior to the early 1970s, and its withdrawal from the blow-up regime in the subsequent period).
[3] In addition to this, the absolute growth rate is proportional to the population itself – with a given relative growth rate a larger population will increase more in absolute numbers than a smaller one.
[4] ‘This implication flows naturally from the non-rivalry of technology… The cost of inventing a new technology is independent of the number of people who use it. Thus, holding constant the share of resources devoted to research, an increase in population leads to an increase in technological change’ (Kremer 1993: 681).
[5] Note that ‘the growth rate of technology’ means here the relative growth rate (i.e. the level to which technology will grow in a given unit of time in proportion to the level observed at the beginning of this period).
[6] In Economic Anthropology it is usually denoted as ‘Boserupian’ (see, e.g., Boserup 1965; Lee 1986).
[7] Kremer did not test this hypothesis empirically in a direct way. Note, however, that our own empirical test of this hypothesis has supported it (see Korotayev, Malkov, and Khaltourina 2006b: 141–146).
[8] The title of the most recent article by a social scientist discussing Kapitza's model, Demographic Adventures of a Physicist [Shishkov 2005], is rather telling in this respect.