K-Waves, Technological Clustering, and Some of Its Implications

Almanac: Kondratieff waves:Juglar – Kuznets – Kondratieff
Abstract
The etiology of Kondratieff wave (K-waves) is complex because its effects are so pervasive. It may also be that its sources are equally numerous. However, one of the unfortunate byproducts of the K-wave's political-economic centrally is that it means different things to different analysts. Since price data were studied early, a number of observers equate K-wave fluctuations with monetary pulsations. Others link it to generational shifts, investment spikes, stock market oscillations, or war impacts. K-waves encompass all of these activities but it is not clear that it serves our analytical purposes to leave the identity of the core nature of long-term economic pulsations so open-ended. The causal ambiguities contribute strongly to K-waves' controversial status. The more elusive the core identity of K-waves, the easier it is to take the subject less than seriously. The proposed remedy is to acknowledge technological clustering as the central K-wave motor, until or unless we find otherwise.
Keywords: transduction, energy, time, money, Snooks–Panov curve, acceleration, singularity, global intelligence Kondratieff waves, technological clustering, innovation, inequality, economic growth, North-South gap, relative decline, industrial revolution, long cycles.
K-waves (or Kondratieff waves) mean many things to different people. I propose that we would all benefit from adopting a stance that views these long-term fluctuations as instances of technological clustering. I borrow the ‘technologically clustering’ term from Grubler (1998: 117) who refers to a technological cluster as a ‘set of interrelated technological and organizational innovations whose pervasive adoption drives a particular period of economic growth, productivity increases, industrialization, trade, and associated structural changes’. If we were to converge on this technological clustering as the central focus of K-wave analysis, as a number of analysts are doing, the significance and centrality of these processes would become more salient, the need to elaborate our theoretical infrastructures would become more imperative, and the unification of many findings pointing in different directions might become more feasible. In other words, the potential payoffs could be considerable.
I attempt to advance the case for this approach by elaborating empirically some of the implications for technological clustering and world inequality reinforcement and systemic leadership decline. Earlier cases have been made for explaining the North-South income gap in terms of uneven technological diffusion (Thompson and Reuveny 2010) without being able to demonstrate fully the contours of the uneven diffusion. A relatively new dataset developed by Comin and Hobijn (2009) facilitates a more direct examination of this phenomenon. At the same time, uneven technological clustering within the principal source of innovation, the lead economy, also helps explain puzzles relating to the relative decline of the incumbent system leader.
Technological Clustering
Receptivity to K-wave analyses is subject to unusually heavy perceptual burdens and a great deal of ingrained resistance. Given the early history of Kondratieff fluctuation study, especially its emphasis on mainly inductive and empirical as opposed to theoretical examinations and the initial heavy emphasis on prices, K-wave analyses have struggled to proceed beyond seeking existential evidence that the long-term fluctuations are real. For many economists, they simply do not exist. Not only do they not fit easily into the short-term focus of contemporary economic analysis, they also can be dismissed on the grounds of underdeveloped or contradictory theoretical explanations. It does not help that we continue to quarrel about the roots of K-wave fluctuations – is it prices, wages, radical technology clusters, generations, wars, demographic changes, or investment – let alone astrology and numerology – that ultimately drives the 40–60 year undulations? What is the scope of K-wave fluctuations – are they universal, restricted to more developed economies, or do they start and become most characteristic in the world system's lead economy? And, of course, what is the timing of the K-wave fluctuations? Virtually all K-wave analyses seem to prefer different periodizations.
Despite these persistent disagreements, we may at least be moving toward something resembling an emerging consensus that radical technology clusters lie at or near the heart of these irregular perturbations.[1] To the extent that this is the case, we might do well to stress the uneven development of new technology and its myriad implications as the central focus of K-wave analyses. The problem then is not that much of economic scholarship ignores K-wave phenomena as figments of overwrought imaginations; the problem is that much of economic scholarship ignores the uneven development of new technology and its implications. It is more the assumption that technological developments are virtually constant and incremental that seriously handicaps the analysis of economics and political economy – than it is the disinclination to take K-waves seriously. We would all be better off if we embraced the idea of uneven technological development, even if that meant losing the K-wave conceptualization and its long history of fringe acceptance at best.
But it is not enough to accept the centrality of the unevenness of technological developments. If the pace and processes of technological development are indeed central, some other elements should become clearer. Technology does not fall from the heavens, it must be invented and innovated by someone. Although inventions are widespread, innovation tends to be restricted in geographical scope.[2] Innovations tend to appear in some part(s) of the world before they diffuse to some other parts of the world. Note that there is no reason to assume that technological diffusion is universal. It is not. Technological diffusion is just as uneven as its innovation. It is the unevenness of these processes that lead to and/or reinforce structured world inequalities. New technological innovations appear in the North and some elements of the novelties eventually appear in parts of the South. Yet this lead-lag process means that much of the South is always lagging behind the North. If a few states in the South have some potential of catching up with Northern technological complexity and affluence (and have done so), many do not. Not only does much of the South lag behind the North, the magnitude of the lag implies more economic divergence than it resembles anything like economic convergence.
If K-waves are about uneven technological innovations, then K-waves are also responsible in part for world inequality. But there is much more to the story. As the main engine of long-term economic growth, technological clustering processes concentrate wealth globally, carry out Schumpeterian ‘creative destruction’, and transform periodically how the world – or some of the world – literally works. Technological clustering has also become increasingly critical to the rise and relative decline of lead economies. There are different ways to elaborate this premise. My preference is linked to the Modelski-Thompson leadership long cycle perspective.[3]
In this perspective, long-term economic change is stimulated by radical innovations in commerce and industry. These innovations are spatially and temporally concentrated in one state for a finite period of time, as delineated in Table 1 and Fig. 2. After they are introduced, they bring about major changes in the way economies function as their techniques and implications diffuse throughout the pioneering economy and then to other advanced economies that are in a position to adopt or adapt the new ways of doing business.
Table 1. Leading sector timing and indicators, 15th to 21st centuries
| Lead Economy | Leading Sector Indicators | Start-up Phase | High Growth Phase |
| Portugal | Guinea Gold | 1430–1460 | 1460–1494 |
| Indian Pepper | 1494–1516 | 1516–1540 | |
|
|
| ||
| Netherlands | Baltic and Atlantic Trade | 1540–1560 | 1560–1580 |
| Eastern Trade | 1580–1609 | 1609–1640 | |
|
|
| ||
| Britain I | Amerasian Trade (especially sugar) | 1640–1660 | 1660–1688 |
| Amerasian Trade | 1688–1713 | 1713–1740 | |
| Britain II | Cotton, Iron | 1740–1763 | 1763–1792 |
| Railroads, Steam | 1792–1815 | 1815–1850 | |
|
|
| ||
| United States I | Steel, Chemicals, Electronics | 1850–1873 | 1873–1914 |
| Motor Vehicles, Aviation, Electronics | 1914–1945 | 1945–1973 | |
|
|
| ||
| United States II? | Information Industries | 1973–2000 | 2000–2030 |
| ? | 2030–2050 | 2050–2080 |
As pioneers, the initial source of new best practice technologies reap major profits and lead in economic development. They need sea power to protect the affluent home base and the sea routes via which its products are distributed around the world from potential predators. In the early leaders, major advances in ship construction were critical to the packages of innovations being introduced to the world economy. More generally, though, the gains from pioneering new commercial networks and industrial production financed the leading arsenals of global reach capabilities developed by system leaders. Those same gains later led to system leaders becoming a, if not the, principal source of credit for the world economy.
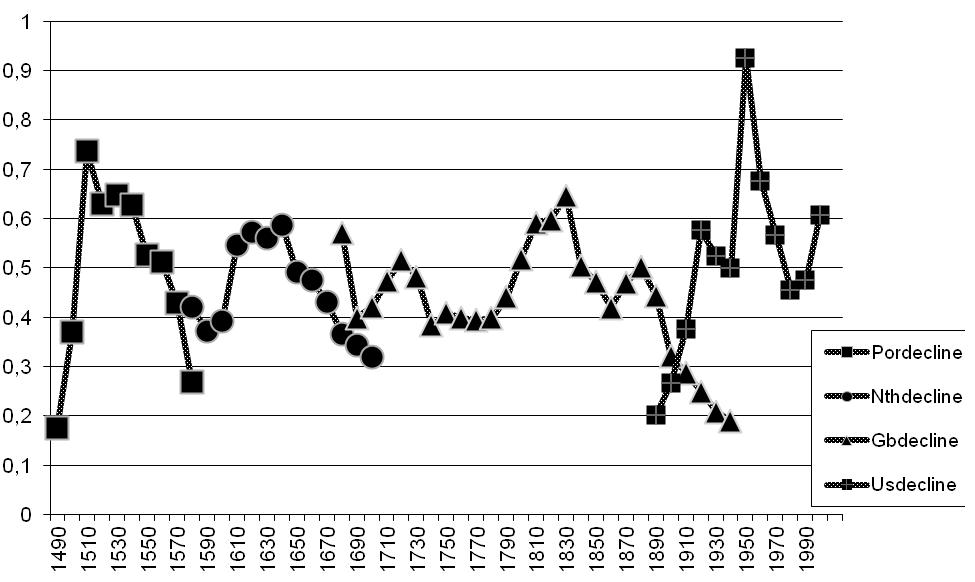
Fig. 1. Leading sector concentration
Thus, at the heart of leadership long cycle theorizing is a historicized model of long-term economic growth (Modelski and Thompson 1996; Rennstich 2008). There is no denying the importance of population size, resource endowment wealth, mass and elite consumption, savings, and other standard foci of economic growth models. But these are primarily short-term considerations. Over the long haul, development is driven by radical technological revolutions that spike roughly every half century or so. These are the long waves of economic growth that are also referred to as Kondratieff or K-waves. They are more irregular waves than neat cycles coming and going with precise periodicity. They also can best be visualized as sequential, S-shaped, logistic growth curves. New technology enters the lead economy slowly at first, then accelerates and ultimately peaks at some point before decaying in impact as new technology becomes increasingly routine and/or is pushed aside by even newer technology.
By focusing on the leading sectors that are at the heart of these technological breakthroughs, it is also possible to measure them, thereby providing important empirical support for the claims that these phenomena exist. It has also been possible to demonstrate that their main carriers, the leading sectors, stimulate the economic growth of the system leader's national economy and the world economy (Reuveny and Thompson 2001, 2004; Rasler and Thompson 2005).
Two applications will have to suffice. One involves world inequality. The argument is that technological clustering is one of the main drivers of the continuing income divergence between the North and the South. Southern incomes have improved but Northern incomes have improved even more so. One reason is that new technology clusters diffuse unevenly and the process is subject to long lags. The South, or most of it, tends to fall farther behind with the arrival of each subsequent technology cluster. The North, on the other hand, tends to absorb these sequences of new technology clusters more readily. As a consequence, Northern incomes have tended to converge.
The second application concerns systemic leadership decline. Much ado is currently being made about China approaching the position of possessing the largest economy in the world. Of course, it has held this position before and some would even argue, historically, that China has the longest claim on possessing the world's largest economy. Yet while size matters, it is not the sole criterion of power in the world economy. A stronger case can be made for leadership in technological innovation, the qualitative dimension of economic clout in the world economy, as being more crucial. But adopting this position suggests that the incumbent lead economy is faltering on both quantitative and qualitative criteria. Or is it? Another possibility is that we do not yet know how to interpret the observed sequence of technological clustering. What appears to be current U.S. relative decline may reflect just that but it may also reflect uneven impacts of technological clustering over time. In other words, our tendency to assume that each cluster is more or less equal in transformational potential may simply be wrong. If some clusters are weaker than others, we need to take that into consideration in evaluating who leads in contemporary technological innovation – just as we need to contemplate who might lead in the next cluster, assuming there is one.
World Inequality
The North South income gap is diverging with the North improving its relative position much faster than the South. One quick empirical demonstration of this tendency is displayed in Table 2. Average regional gross domestic product per capita improved everywhere from the 19th through the 20th centuries. But it improved most dramatically in the places that generated new technology and that could absorb the new technologies that were generated – initially, Western Europe, then the Western Offshoots, and, later, Japan. Between 1820 and 2001, Western European GDP per capita increased 16-fold. The Western Offshoots GDP per capita in 2001 was 22.4 times as large as it had been in 1820. Japanese income per capita increased by a factor of nearly a 31-fold increase.
Table 2. Changes in regionally averaged gross domestic product per capita
|
| 1820 | 1870 | 1913 | 1950 | 1973 | 2001 |
| Western Europe | 1204 | 1960 | 3458 | 4579 | 11416 | 19256 |
| Western Offshoots | 1202 | 2419 | 5233 | 9268 | 16179 | 26943 |
| Latin America | 692 | 681 | 1481 | 2506 | 4504 | 5811 |
| Former Soviet Union | 688 | 943 | 1488 | 2841 | 6059 | 4626 |
| Eastern Europe | 683 | 937 | 1695 | 2111 | 4988 | 6027 |
| Japan | 669 | 737 | 1387 | 1921 | 11434 | 20683 |
| Asia | 577 | 550 | 658 | 634 | 1226 | 3056 |
| Africa | 420 | 500 | 637 | 894 | 1410 | 1489 |
Source: Maddison 2003.
In contrast, regions in the rest of the world started lower and expanded less quickly. Eastern Europe managed nearly a 9-fold increase and Latin America area was not too far behind (8.4-fold increase). The former Soviet Union area's expansion was in the middle of the other five regions (6.7-fold increase) – no doubt influenced by the severe economic deterioration of the FSU economy in the 1990s. Asia (without Japan) comes next, followed by Africa which registered only a 3.5-fold increase in GDP per capita. One known concomitant of these changes is that the income gaps between the early leaders (Western Europe and especially Britain and the Western Offshoots and especially the United States) and the slower growing areas diverged rather than converged. The gap in 1820 between the early leaders and the rest ranged from 1:1.7 (with Latin America) to as much as 3:1 in reference to Africa. By 2001, the income gap between the western offshoots and Latin America had grown to 1:4.6 and the gap with Africa was 1:18.1.
To what extent might we attribute the widening gap to uneven technology diffusion? Bairoch's (1982) data on the geographical distribution of manufacturing provides a useful starting point for this question. Manufacturing, as one imperfect index of the location and innovation of higher technology, became increasingly concentrated in the global North (Western Europe, North America, and eventually, Japan). Table 3 focuses on the chief technology pioneers of the nineteenth and twentieth centuries, Britain and the United States, and two Bairoch aggregations, the Developed Countries (DCs) and the Third World (China, Indian, and a few Latin American states.) We view these two aggregations as rough approximations of the global North and South, respectively.
Table 3 shows world manufacturing residing largely in the South through the first third of the ninenteenth century but moving increasingly to the North by mid-century. The two individual leaders in this shift were Britain peaking around 1880 – (with 22.9 percent) and then the United States peaking in the early 1950s (44.7 percent). For much of the twentieth century (until the 1990s), Bairoch's data suggest that most of the world outside the most affluent zone produced from 7 to 13 percent of world's manufacturing output. After 1980, the global South continued to make solid gains but the global North continues to monopolize manufacturing. In 2005, the developed world's roughly 3:1 ratio was exactly the reverse of its 1:3 ratio in 1750.
Table 3. Proportion of world manufacturing production
| Year | Britain | United States | Developed World | Third World |
| 1750 | 1.9 | 0.1 | 27 | 73 |
| 1800 | 4.3 | 0.8 | 32.2 | 67.8 |
| 1830 | 9.5 | 2.4 | 39.5 | 60.5 |
| 1860 | 19.9 | 7.2 | 63.4 | 36.6 |
| 1880 | 22.9 | 14.7 | 79.1 | 20.9 |
| 1900 | 18.5 | 23.6 | 89 | 11 |
| 1913 | 13.6 | 32 | 92.5 | 7.5 |
| 1928 | 9.9 | 39.3 | 92.8 | 7.2 |
| 1938 | 10.7 | 31.4 | 92.8 | 7.2 |
| 1953 | 8.4 | 44.7 | 87 | 13 |
| 1963 | 6.4 | 35.1 | 91.3 | 8.7 |
| 1973 | 4.9 | 33 | 90.1 | 9.9 |
| 1980 | 4 | 31.5 | 88 | 12 |
| 1991 | 4.5 | 23.5 | 84.2 | 15.8 |
| 1995 | 4 | 23.5 | 81.6 | 18.4 |
| 2000 | 3.9 | 26.6 | 78.8 | 21.2 |
| 2005 | 3.6 | 22.3 | 72.3 | 27.7 |
| 2010 | 2.3 | 17.6 | 60.7 | 39.3 |
Notes: The 1750–1980 data are based on numbers reported in Bairoch (1982). The 1991–2010 figures are based on World Development Indicators (WDI Online) value-added manufacturing, substituting ‘high income’ aggregations for Bairoch's ‘developed world’ and ‘low/middle income’ for the Third World aggregation.
Manufacturing retains the claim to constituting the primary vehicle of economic transformation in the past few centuries. It brought about the possibility of continuous and sustained economic development by transforming worker attitudes and skills as well as structures and institutions of production and socio-political regulation. Lall and Kraemer-Mbula (2005: 4) conclude that manufacturing ‘has been, and remains the main engine of structural transformation’. Moreover, the leaders in world manufacturing also specialize in introducing new technology through their manufacturing (Kozul-Wright 2006).
Yet an examination of historical distributions of manufacturing suggests that the North-South imbalance in manufacturing is returning to a more symmetrical relationship – or perhaps even where it stood in the 18th century. If so, it would suggest that technology may not have been a main driver of the widening North-South income gap. Otherwise, the Southern share of manufacturing would not be moving up (as shown in Fig. 2) while its income fell farther behind proportionately.
That is one interpretation. An alternative one is that manufacturing relies on different mixtures of routine and novel technology. Bairoch's data does not discriminate among the two. If the improvements in Southern manufacturing production tend to be more routine while the North retained the advantages of the newest technological clusters, we would still expect to see a widening income gap – as long as the new technology was more profitable than technology that had become routine.
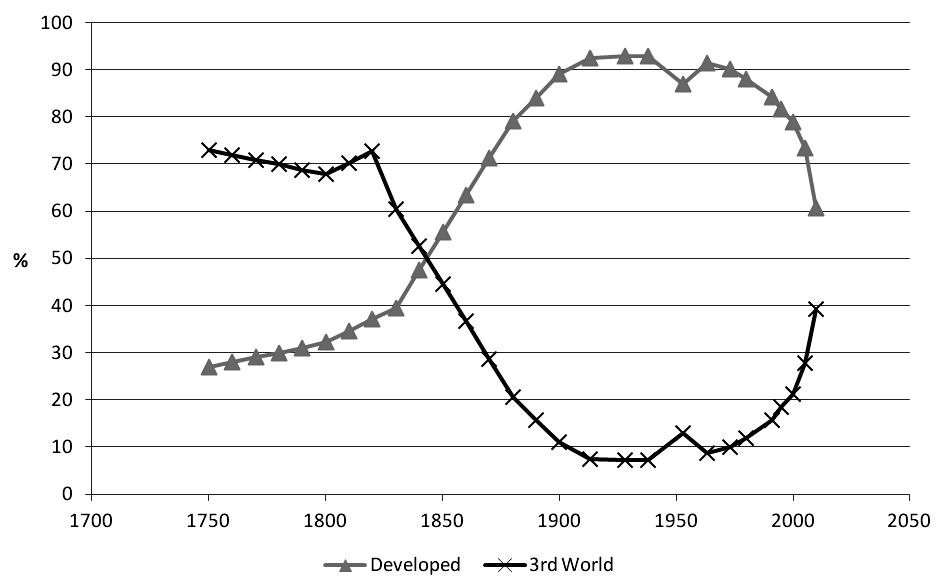
Fig. 2. Developing and developed manufacturing proportions
We know that economic growth rates have varied in different parts of the world and that the disparity between the most advanced economies and the less developed economies is expanding – subject, of course, to some notable exceptions. What is less common at least in mainstream treatments is to link these changes to the Kondratieff or K-wave process via technological clustering. Although it is not difficult to show North-South Divergence in terms of gross domestic product per capita (Thompson and Reuveny 2010), it has not yet been examined directly in terms of technology. Comin and Hobijn's (2009) relatively new data set on the acquisition of a large number of technologies (100) for some 150 states since 1800 makes it possible to look at these shifts without relying on GDP per capita or un-differentiated manufacturing production.[4] To simplify the complexity introduced by examining a large number of technologies simultaneously, nine technologies of some significance (identified in Table 4) are extracted for examination in a comparative regional frame. An overall technology score is computed by aggregating the standardized raw scores of each indicator and dividing by nine. Regional scores are then computed by averaging the overall technology scores of the member states.
Table 4. Major technology indicators
| Indicators |
| Steam ship |
| Passenger train |
| Telegraph |
| Telephone |
| Electric power |
| Car |
| Passenger plane |
| Cellphone |
| Computer |
| Overall Technology = sum of the standardized raw scores/9 |
Table 5 re-calculates growth rates for the 1870–1913 and 1950–1973 periods. The most striking pattern in Table 5 is that some regions did better in one of the two growth waves than they did in the other. With the exception of Latin America, the regions other than the Western Offshoots did better in the catch-up, 1950–1973 wave than in the epochal 1870–1913 wave. The Western Offshoots fared best in the 1870–1913 wave and did somewhat less well (compared to past changes) in the next up-wave. At the same time, some of the regions were passed over altogether by some of the growth waves. Asia and Africa, for example, benefitted little in the 1870–1913 wave. Parts of Asia benefited considerably in the 1950–1973 (Japan, South Korea, Taiwan, and Singapore) while other parts of Asia did not benefit immediately. The scores for Africa suggest it only fell farther behind in the 1950–1973 wave.[5]
Table 5. Changes in regional technology scores
|
| 1870 | 1913 |
| 1950 | 1973 |
| 1998 |
| Western Offshoots | .008 | .929 |
| 2.351 | 2.601 |
| 1.861 |
| Western Europe | .107 | .438 |
| .406 | 1.361 |
| 1.772 |
| Japan | –1.033 | –.231 |
| n.d. | .584 |
| 1.980 |
| Former Soviet Union | –.904 | –.509 |
| –.054 | .796 |
| –.558 |
| Eastern Europe | –.509 | –.408 |
| –.357 | .161 |
| .129 |
| Latin America | –.474 | –.473 |
| –.394 | –.377 |
| –.364 |
| Asia | n.d. | –.925 |
| –.534 | –.268 |
| –.187 |
| Africa | n.d. | n.d. |
| –.338 | –.481 |
| –.568 |
Table 5 also suggests that, technologically speaking, things do not stand still after and in between periods of technological acceleration. By 1998, the Western Offshoots no longer could claim technological centrality. This position was now shared more or less with Western Europe and Japan. The Soviet Union collapsed and experienced a setback in the gains achieved in the 1950–1973 catch-up period. Latin America's relative regional standing did not change much in the second half of the 20th century. Asian scores continued to improve, albeit slowly, while African scores continue to fall behind. These results seem to jibe with what is found in gross domestic product per capita accounts. Not surprisingly, the correlation between the overall technology scores and regionally averaged gross domestic product per capita is quite high.
These observations raise another interesting question about the basic pulse of technological clustering. K-wave analysts prefer roughly a two beat per ‘century’ pace while others are more comfortable with what is effectively a one beat per ‘century’ rhythm. This is of course an empirical question. Much of the two beat pace is based on extensive empirical work to support it while one beat pace authors are usually content to simply declare their long phases. But it is also clear that the growth and change reverberations of each new technological cluster can persist long beyond its onset.[6] Comin and Hobijn (2010), for instance, find evidence for 100 year lags in the diffusion of some technologies but their reference is global.[7] Just how long it takes for new technology to diffuse throughout single economies is less clear. But one can assume it varies by economy and technology. It seems most reasonable to assume that technology clusters overlap as opposed to the advent of one cluster indicating the demise of its predecessor(s). Such an assumption means only that we have much to map in terms of the diffusion of technology diffusion within and across states.
System Leader Relative Decline
The technological clustering perspective on the K-wave suggests five features of Kondratieff processes that have not yet received sufficient attention. One is that every growth wave is not equal. Some growth waves are strong while others are comparatively weaker. A second feature that has not been explored much is just how long the impacts take to be fully registered at the source. While we think we can isolate periods of high growth due to innovational changes, these remain largely guesswork. A third feature is that the extent of diffusion varies from one wave to the next. Some areas benefit more than others but not necessarily consistently. The combination of the first three features suggests a fourth – K-wave processes are anything but uniform over time and space. Their effects are neither instantaneous nor are they experienced equally across space. Finally, the unevenness of the K-wave's geographical diffusion is matched by the unevenness of the innovation source's advantage. Other parts of the world catch up while the center is either standing still or even backsliding, relative to its own past successes, or experiencing relative decline.
That these same generalizations apply to the concentrated sources of technological innovation should not be surprising. When we talk about repetitive wave-like motion or even a sequence of S-shaped growth curves, the imagery of similar shaped waves comes readily to mind. Yet it is becoming increasingly apparent that K-waves are not equally shaped. Some have more impact than others. The economist, Robert J. Gordon, has been one of the more persistent critics of the idea of continuous technological growth. Some of his assumptions resemble broadly those of the long cycle / K-wave model.[8] He argues that first Britain and then the United States became the leaders in output per capita – Britain very slowly beginning around 1700 and the United States at a faster pace in the early 20th century. Three industrial revolutions, beginning around 1750, were the main vehicles for improving output per capita – which had not seen much improvement prior to 1750.
The first industrial revolution lasted from 1750 to 1830 and focused on steam, textiles, and railroads. Its impact in terms of transforming the U.S. economy persisted for another 100 years. The second industrial revolution was shorter (1879–1900) but much greater in transformational impact. Its focus encompassed electricity; internal combustion engines; running water/indoor plumbing and its sanitation implications; molecular re-arrangements in petroleum, chemicals, plastics, and pharmaceuticals; and communication/entertain-ment innovations (telephone, phonograph, photography, radio, and motion pictures). These innovations continued to transform the U.S. economy up to about 1970, with particular emphasis on the diffusion of air conditioning, home appliances, and highway systems.
The third industrial revolution, centered on information technology, began to be discernible from about 1960 on. Robots, credit cards, and computers were introduced and had some impact to be sure but not enough to change overall productivity all that much. The second push came in the 1990s with the internet, web, and expanding e-commerce. This second push was sufficient to bring about some positive change in productivity statistics but it has proved to be short-lived.
Gordon (2012: 13) notes that the average growth rates for U.S. labor productivity was 2.33 % for the 1891–1972 period, despite wars and depression. From 1972 to 1996, the average growth rate declined to 1.38 %. Then it improved considerably but for only a decade (1996–2004 = 2.46 %). For almost the last decade, it has retreated to 1.33 %. Gordon's main point is that the second industrial revolution was able to sustain productivity improvements for over 80 years while the third revolution is associated with a meager 10 year bump. The reason is that the changes wrought between 1870 and 1900 were more transformational than the impact of the 1996–2004 period. Each revolution brings about unique transformations but some are more unique than others. Stretching his own periodization, Gordon argues that transportation speeds accelerated from horseback pace to jet engines by 1958 and that we are unlikely to see any such acceleration ever again. A less debatable example is the shift from a society that is primarily rural to one that is primarily urban.
Unique transformations have occurred as a consequence of the third revolution as well. Typing has shifted from mechanical machines that were awkward to correct to easily correctible computerized keyboards. Hard-bound books are in the process of disappearing. Transistor radios have been replaced by ipods. Yet these transformations do not quite measure up to the revolutionary impacts of replacing horse-drawn plows with tractors or being able to control the internal temperature of residences and work places. Vaclav Smil (2005) has made the same point in a book devoted solely to this topic. The technological innovations, in his accounting, from 1867–1914, constituted the greatest technological discontinuity in history.
It may be that both Gordon and Smil will prove to have been overly pessimistic. K-wave analysts are conditioned to anticipate continuing revolutions in technology. We do not know exactly what is coming down the pike. It may well be that analysts in the future will talk about the complete disappearance of human labor in favor of robots or the radical implications of nano-manufacturing in the same way that we now look at the transition from horse-drawn plows to tractors. Then, too, we have not yet seen the full impact of information technology or its interaction with biotechnology. Perhaps, we need to wait until 2050 to be able to fully assess the productivity impact of the latest industrial revolution. This admonition suggests caution in interpreting the incumbent system leader's economic weaknesses. Structurally, it is difficult to deny relative decline, albeit fairly slow paced relative economic decline on the part of the United States. It may be, however, that: a) the latest technological cluster's impact was also relatively weak, or b) we have yet to experience the full impact of the transformations associated with the ongoing technological cluster.
The leadership long cycle perspective (see Table 1) sees the high growth period of the current technological cluster as lasting through 2030. We may need to hold our breath collectively for a while to see how things shake out technologically-speaking, at least in terms of the full impact of the latest cluster. We also need to pay less attention to the size of the economy and look more closely at where the current technological clustering is being manifested. In many respects, the primary location, if there is one, also seems less than clear. That may mean that technological clustering has become less geographically limited in initial innovation. Or, it may mean that we do not know exactly what to look for in terms of the best indicators of contemporary technological clustering.
The Gordon–Smil point of view, nonetheless, remains well-taken. We should not expect every upsurge to be equal in strength or significance. We already recognize that every K-wave downturn has not been equal – even if we have been slow to explain precisely why that is the case. Technological development is uneven in pace. This rule holds for the privileged leader in innovation as well as it does for the places to which the innovations eventually (or not) diffuse. In this respect, the relative decline of the system leader can be explained in the same terms that we use to explain world inequalities. It is certainly reductionist to attribute both relative decline and the North-South gap to the nature of K-wave processes. Yet it is a useful form of reductionism and one that should prove more fruitful than focusing primarily on whether evidence exists for irregular fluctuations in a variety of behaviors.[9] By this point, how and where K-waves operate unevenly should be more important than whether they show up in every possible indicator at all times and places. To proceed otherwise amounts simply to misunderstanding the fundamental nature of K-wave processes or the processes and implications of uneven technological development.
Conclusions
Technological clustering is what Ocampo and Parra (2006) call the global development cycle. As such, it shapes who develops, at what pace they develop, and just how stratified the world economy becomes as a consequence of economic development. Technological clustering is anything but deterministic; it also interacts with a number of local variables. Different local economies are impacted differentially and certainly unevenly. The sooner we come to terms with the existence of this fundamental, long-term growth process and its myriad implications for diffusion, the better off we will be in terms of explanatory power in a number of different disciplines.
References
Archibugi D., and Filippetti A. 2012. Innovation and Economic Crisis: Lessons and Prospects from the Economic Downturn. London: Routledge.
Ayres R. U. 1990a. Technological Transformations and Long Waves, Part I. Technological Forecasting and Social Change 37: 1–38.
Ayres R. U. 1990b. Technological Transformations and Long Waves, Part II. Technological Forecasting and Social Change 37: 111–138.
Bairoch P. 1982. International Industrialization Levels from 1750 to 1980. Journal of European Economic History 11: 269–333.
Boswell T., and Chase-Dunn C. 2000. The Spiral of Capitalism and Socialism: Toward Global Democracy. Boulder, CO: Lynne Rienner.
Comin D. A., and Hobijn B. 2008. An Exploration of Technology Diffusion. Working Paper 08-903. Cambridge, MA: Harvard Business School.
Comin D. A., and Hobijn B. 2009. The CHAT Dataset. NBER Working Paper. No. 15319, September. Cambridge, MA: National Bureau of Economic Research. URL: http://www. Nber.org/papers/w15139
Comin D. A., and Hobijn B. 2010. An Exploration of Technology Diffusion. American Economic Review 100(5): 2031–2059.
Comin D. A., and Hobijn B. 2011. Technology Diffusion and Postwar Growth. NBER Macroeconomics Annual 25: 209–259.
Devezas T., and Modelski G. 2006. The Portuguese as System-Builders in the XVth–XVIth Centuries: A Case Study on the Role of Technology in the Evolution of the World System. Globalizations 3: 503–519.
Edmonson N. 2012. Technology Cycles and U.S. Economic Policy in the Early 21st Century. New Brunswick, NJ: Transaction Press.
Freeman C., and Louca F. 2001. As Time Goes By: From the Industrial Revolution to the Information Revolution. Oxford: Oxford University Press.
Freeman C., and Perez C. 1988. Structural Crises of Adjustment: Business Cycles and Investment Behavior. Technical Change and Economic Theory / Ed. by G. Dose, C. Freeman, R. Nelson, G. Silverberg, and L. Soete, pp. 38–66. London: Pinter.
Goldstein J. S. 1988. Long Cycles. New Haven, CT: Yale University Press.
Gordon R. J. 2012. Is U.S. Economic Growth Over? Faltering Innovation Confronts the Six Headwinds. NBER Working Paper No. 18315. Cambridge, MA: National Bureau of Economic Research. URL: http://www.nber.org/papers/w18315
Grubler A. 1998. Technology and Global Change. Cambridge, MA: Cambridge University Press.
Korotayev A., Zinkina J., and Bogevolnov J. 2011. Kondratieff Waves in Global Invention Activity (1900–2008). Technological Forecasting and Social Change 78: 1280–1284.
Kozul-Wright R. 2006. Globalization Now and Again. Globalization Under Hegemony: The Changing World Economy / Ed. by K. S. Jomo, pp. 100–132. New Delhi: Oxford University Press.
Lall S., and Kraemer-Mbula E. 2005. Industrial Competitiveness in Africa: Lessons from East Asia. Warwickshire: ITDG Publishing.
Linstone H. A., and Devezas T. 2012. Technological Innovation and the Long Wave Theory. Technological Forecasting and Social Change 79: 414–416.
Maddison A. M. 2003. The World Economy: Historical Statistics. Paris: OECD.
Mensch G. O. 1979. Stalemate in Technology: Innovations Overcome the Depression. Cambridge, MA: Ballinger.
Modelski G. 1987. Long Cycles in World Politics. London: Macmillan.
Modelski G., and Modelski S. (Eds.) 1988. Documenting Global Leadership. London: Macmillan.
Modelski G., and Thompson W. R. 1988. Sea Power in Global Politics, 1494–1993. London: Macmillan.
Modelski G., and Thompson W. R. 1996. Leading Sectors and World Power: The Coevolution of Global Economics and Politics. Columbia, SC: University of South Carolina Press.
Modelski G., Devezas T., and Thompson W. R. (Eds.) 2008. Globalization as Evolutionary Process: Modeling Global Change. London: Routledge.
Ocampo J. A., and Parra M. A. 2006. The Dual Divergence: Growth Successes and Collapses in the Developing World since 1980. DESA Working Paper No. 24. St/ESA/2006/DWP/24. New York: United Nations Department of Economic and Social Affairs.
Perez C. 2002. Technological Revolutions and Financial Capital: The Dynamics of Bubbles and Golden Ages. Cheltenham: Edward Elgar.
Rasler K., and Thompson W. R. 1994. The Great Powers and Global Struggle: 1490–1990. Lexington: University Press of Kentucky.
Rasler K., and Thompson W. R. 2005. War, Trade and the Mediation of Systemic Leadership. Journal of Peace Research 42(3): 251–269.
Rennstich J. K. 2008. The Making of a Digital World: The Evolution of Technological Change and How It Shaped Our World. New York: Palgrave Macmillan.
Reuveny R., and Thompson W. R. 2001. Leading Sectors, Lead Economies and Economic Growth. Review of International Political Economy 8(4): 689–719.
Reuveny R., and Thompson W. R. 2004. Growth, Trade and Systemic Leadership. Ann Arbor, MA: University of Michigan Press.
Smil V. 2005. Creating the Twentieth Century: Technical Innovations of 1867–1914 and Their Everlasting Impact. New York: Oxford University Press.
Thompson W. R. 1988. On Global War: Historical-Structural Approaches to World Politics. Columbia, SC: University of South Carolina Press.
Thompson W. R. 2000. The Emergence of the Global Political Economy. London: UCL Press/Routledge.
Thompson W. R. 2007. The Kondratieff Wave as Global Social Process. World System History. UNESCO Encyclopedia of Life Support Systems / Ed. by G. Modelski, and R. A. Denemark. Oxford: EOLSS Publishers. URL: http://www.eolss.net
Thompson W. R., and Reuveny R. 2010. Limits to Globalization: North-South Divergence. London: Routledge.
[1] See, among many, Freeman and Perez (1988), Ayres (1990a, 1990b), Modelski and Thompson (1996), Grubler (1998), Boswell and Chase-Dunn (2000), Freeman and Louca (2001), Devezas and Modelski (2006), Thompson (2007), Rennstich (2008), Korotayev еt al. (2011), Archibugi and Filippetti (2012), Edmonson (2012), and Linstone and Devezas (2012).
[2] This generalization is based on historical tendencies. Like many others, it may not hold into the future.
[3] See, e.g., Modelski 1987; Modelski and Modelski 1988; Modelski and Thompson 1988, 1996; Thompson 1988, 2000; Rasler and Thompson 1994; Reuveny and Thompson 2004; Modelski, Devezas, and Thompson 2008; and Thompson and Reuveny 2010.
[4] Some caution should be exercised in using CHAT. Entries are not always comparable because they have been taken from sources that use different metrics (e.g., some data are reported in thousands while others are reported in millions). There are missing data and data reported cover the last two-thirds of the 19th century but all of the 20th century. Data for some countries, however, only is reported after World War II.
[5] This could be an artifact of the very few African countries for which there were pertinent data in the 1950s.
[6] Railroads provide an excellent example. First introduced in the 1820s and 1830s in places such as Britain and the United States, it took decades for them to dominate transportation networks in these countries. Should we focus on their high growth rates in the early-mid century or their increasing predominance later in the century and into the next one?
[7] Comin and Hobijn also start their diffusion clocks from the point of invention which can add a number of decades to the diffusion of some technologies, especially in the 19th century.
[8] While some assumptions do not and it is the assumptions that differ that help explain Gordon's pessimism. He starts with the assumption that nothing fundamentally changed before 1750 and the advent of a series of overlapping industrial revolution. Where he sees one revolution that lasted from 1870 to 1970, the long cycle model and most K-wave arguments see at least two revolutions. While Gordon recognizes three revolutions, he does not seem to anticipate the fourth industrial revolution any time in the foreseeable future. Rather, he sees diminishing intervals of revolution with variable impacts, both initially and over time. From his perspective, the weakness of the third revolution is apt to be with us for some time to come and aggravated by a number of problems characterizing the U.S. economy and society.
[9] By no means am I denigrating the search for temporal periodicities in K-wave phenomena. That activity must continue and is highly valuable. But we also need to spend more time with the theoretical and conceptual dimensions as well.