Mathematical Modeling of Biological and Social Phases of Big History

Almanac: Globalistics and globalization studiesBig history & global history
The present article demonstrates that changes in biodiversity through the Phanerozoic correlate with a hyperbolic model (widely used in demography and macrosociology) much more strongly than with exponential and logistic models (traditionally used in population biology and extensively applied to fossil biodiversity as well). The latter models imply that changes in diversity are guided by a first-order positive feedback (more ancestors – more descendants) and/or a negative feedback arising from resource limitation. The hyperbolic model implies a second-order positive feedback. The authors demonstrate that the hyperbolic pattern of the world population growth arises from a second-order positive feedback between the population size and the rate of technological growth (this can also be identified with the collective learning mechanism). The feedback between the diversity and community structure complexity can also contribute to the hyperbolic character of biodiversity. This suggests that some mechanisms vaguely resembling the collective learning might have operated throughout the biological phase of Big History. Our findings suggest that we can trace rather similar macropatterns within both the biological and social phases of Big History which one can describe in a rather accurate way with very simple mathematical models.
Keywords: biological phase of Big History, social phase of Big History, mathematical modeling, collective learning, positive feedback, biodiversity, demography, sociology, paleontology, geology, hyperbolic growth.
In 2005, in the town of Dubna, near Moscow, at what seems to have been the first ever international conference devoted specifically to Big History studies, the two authors of the present article – sociologist/anthropologist Andrey Korotayev and biologist/paleontologist Alexander Markov – one after another demonstrated two diagrams.1 One of those diagrams illustrated the dynamics of the population of China between 700 BCE and 1851 CE, the other illustrated the dynamics of marine Phanerozoic biodiversity during the last 542 million years (see Fig. 1):
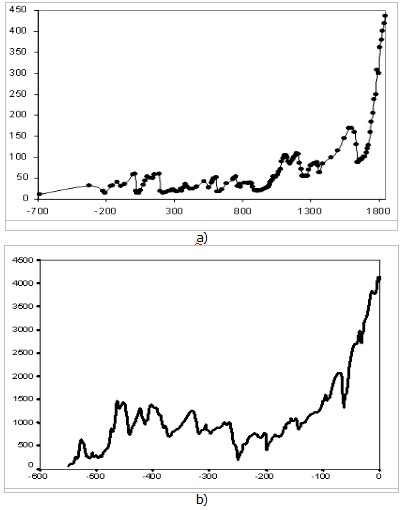
Fig. 1. Similarity of the dynamics of Phanerozoic marine biodiversity and long-term population dynamics of China: а) – Population dynamics of China (million people, 700 BCE – 1851 CE), based on estimates in Korotayev, Malkov, and Khaltourina (2006b: 47–88); b) – Global change in marine biodiversity (number of genera, N) through the Phanerozoic based on empirical data surveyed in Markov and Korotayev (2007a)
Nevertheless, one can hardly ignore the striking similarity between two diagrams depicting the development of rather different systems (human population, on the one hand, and biota, on the other) at different time scales (hundreds of years, on the one hand, and millions of years, on the other) studied by different sciences (Historical Demography, on the one hand, and Paleontology, on the other) using different sources (demographic estimates, on the one hand, and paleontological chronicles, on the other hand). What are the causes of this similarity in the development dynamics of rather different systems?
* * *
In 1960, von Foerster, Mora, and Amiot published a striking discovery in the journal Science. They showed that between 1 and 1958 CE the world's population (N) dynamics can be described in an extremely accurate way with an astonishingly simple equation:2
where Nt is the world population at time t, and C and t0 are constants, with t0 corresponding to an absolute limit (‘singularity’ point) at which N would become infinite.
Of course, von Foerster and his colleagues did not imply that one day the world population would actually become infinite. The real implication was that prior to 1960 the world population growth for many centuries had followed a pattern which was about to come to an end and to transform into a radically different pattern. Note that this prediction started to come true only a few years after the ‘Doomsday’ paper had been published, because after the early 1970s the World System growth in general (and world population growth in particular) began to diverge more and more from the blow-up regime, and now it is not hyperbolic any more with its pattern being closer to a logistic one (see, e.g., Korotayev, Malkov, and Khaltourina 2006a, where we present a compact mathematical model that describes both the hyperbolic development of the World System in the period prior to the early 1970s, and its withdrawal from the blow-up regime in the subsequent period; see also Korotayev 2009).
Parameter t0 was estimated by von Foerster and his colleagues as 2026.87, which corresponded to November 13, 2006; this allowed them to give their article an attractive and remarkable title – ‘Doomsday: Friday, 13 November, A.D. 2026’.
The overall correlation between the curve generated by the von Foerster equation and the most detailed series of empirical estimates looks as follows (see Fig. 2).
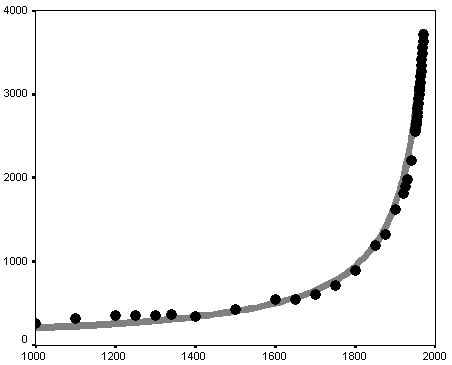
Fig. 2. Correlation between empirical estimates of world population (in millions, AD 1000–1970) and the curve generated by the von Foerster equation
Note: black markers correspond to empirical estimates of the world population by McEvedy and Jones (1978) for the interval between 1000 and 1950 and the U.S. Bureau of the Census (2014) for 1950–1970. The grey curve has been generated by the von Foerster equation (1).
The formal characteristics are as follows: R = 0.998; R2 = 0.996; p = 9.4 × 10⁻¹⁷ ≈ 1 × 10–16. For readers unfamiliar with mathematical statistics we can explain that R2 can be regarded as a measure of the fit between the dynamics generated by a mathematical model and the empirically observed situation, and can be interpreted as the proportion of the variation accounted for by the respective equation. Note that 0.996 also can be expressed as 99.6 per cent.3 Thus, the von Foerster equation accounts for an astonishing 99.6 per cent of all the macrovariation in the world population, from 1000 CE through 1970, as estimated by McEvedy and Jones (1978) and the U.S. Bureau of the Census (2014).4
Note also that the empirical estimates of world population align in an extremely accurate way along the hyperbolic curve, which convincingly justifies the designation of the pre-1970s world population growth pattern as ‘hyperbolic’.
To start with, the von Foerster equation ![]() is just a solution of the following differential equation (see, e.g., Korotayev, Malkov, Khaltourina 2006a: 119–20):
is just a solution of the following differential equation (see, e.g., Korotayev, Malkov, Khaltourina 2006a: 119–20):
This equation can be also written as:
where ![]()
What is the meaning of this mathematical expression, ![]() ? In our case, dN/dt denotes an absolute population growth rate at a certain moment of time. Thus, this equation shows that at any moment of time an absolute population growth rate should be proportional to the square of population at this moment.
? In our case, dN/dt denotes an absolute population growth rate at a certain moment of time. Thus, this equation shows that at any moment of time an absolute population growth rate should be proportional to the square of population at this moment.
Note that this significantly demystifies the problem of the world population hyperbolic growth. Now to explain this hyperbolic growth, we should just explain why for many millennia the absolute rate of world population growth tended to be proportional to the square of population.
The main mathematical models of the hyperbolic pattern of the world's population growth (Taagapera 1976, 1979; Kremer 1993; Cohen 1995; Podlazov 2004; Tsirel 2004; Korotayev 2005, 2007, 2008, 2009, 2012; Korotayev, Malkov, and Khaltourina 2006a: 21–36; Khaltourina, Malkov, and Korotayev 2006; Golosovsky 2010; Korotayev and Malkov 2012) are based on the following two assumptions:
1) ‘the Malthusian (1978 [1798]) assumption that population is limited by the available technology, so that the growth rate of population is proportional to the growth rate of technology’ (Kremer 1993: 681–682).5 This statement seems rather convincing. Indeed, throughout most of human history the world population was limited by the technologically determined ceiling of land carrying capacity. For example, with foraging subsistence technologies the Earth could hardly support more than 8 million people, because the amount of naturally available useful biomass on the planet is limited, and the world population could overgrow this limit only when people started to apply various means to artificially increase the amount of available biomass, that is with a transition from foraging to food production. However, the extensive agriculture can only support a limited number of people, and world population further growth became possible only with the intensification of agriculture and other technological improvements (see, e.g., Turchin 2003; Korotayev, Malkov, and Khaltourina 2006a, 2006b; Korotayev and Khaltourina 2006).
However, it is well known that the technological level is not a constant, but a variable (see, e.g., Grinin 2007a, 2007b, 2012). And in order to describe its dynamics the second basic assumption is employed:
2) ‘High population spurs technological change because it increases the number of potential inventors…6 In a larger population there will be proportionally more people lucky or smart enough to come up with new ideas’ (Kremer 1993: 685), thus, ‘the growth rate of technology is proportional to total population’.7 In fact, here Kremer uses the main assumption of the Endogenous Technological Growth theory (Kuznets 1960; Grossman and Helpman 1991; Aghion and Howitt 1998; Simon 1977, 2000; Komlos and Nefedov 2002; Jones 1995, 2005, etc.). To our knowledge, this supposition was first put forward by Simon Kuznets (1960), so we will denote a corresponding type of dynamics as ‘Kuznetsian’, while the systems in which the ‘Kuznetsian’ population-technological dynamics combines with the ‘Malthusian’ demographic one will be denoted as ‘Malthusian-Kuznetsian’. In general, we find this assumption rather plausible – in fact, it is quite probable that, ceteris paribus, within a given period of time, a billion people will make approximately a thousand times more inventions than a million people.
This assumption was expressed by Kremer mathematically in the following way:
Actually, this equation just says that the absolute technological growth rate at a given moment of time (dT/dt) is proportional to the technological level (T) observed at this moment (the wider is the technological base, the more inventions could be made on its basis), and, on the other hand, it is proportional to the population (N) (the larger the population, the larger the number of potential inventors).8
The resultant models provide a rather convincing explanation of why throughout most of human history the world population followed the hyperbolic pattern with an absolute population growth rate tending to be proportional to N2. For example, why would the growth of population from, say, 10 million to 100 million, result in the hundredfold growth of dN/dt? The above mentioned models explain this rather convincingly. The point is that the growth of world population from ten to a hundred million implies that human subsistence technologies also grew approximately ten times (given that it will prove, after all, to be able to support a ten times larger population). On the other hand, the tenfold population growth also implies a tenfold growth of the number of potential inventors, and, consequently, a tenfold increase in a relative technological growth rate. Hence, the absolute technological growth rate would grow 10 × 10 = 100 times (as Equation 4 shows that an order of magnitude larger number of people with an order of magnitude broader technological basis would likely make two orders of magnitude more inventions). And as throughout the Malthusian epoch the world population (N) tended to the technologically determined carrying capacity ceiling of the Earth, we have good reason to expect that dN/dt will also grow just about 100 times.
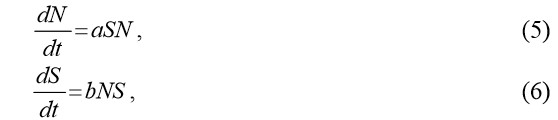
In fact, one can demonstrate (see, e.g., Korotayev, Malkov, and Khaltourina 2006a, 2006b; Korotayev and Khaltourina 2006) that the hyperbolic pattern of the world's population growth can be explained by the nonlinear second order positive feedback mechanism that was shown long ago to generate just the hyperbolic growth, known also as the ‘blow-up regime’(see, e.g., Kurdyumov 1999). In our case this nonlinear second order positive feedback looks as follows: more people – more potential inventors – a faster technological growth – a faster growth of the Earth's carrying capacity – a faster population growth – with more people you also have more potential inventors – hence, faster technological growth, and so on (see Fig. 3).
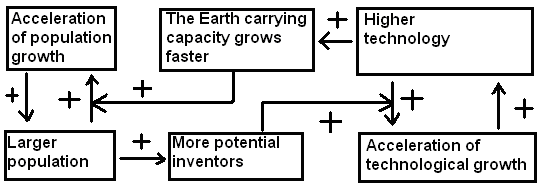
Fig. 3. Cognitive scheme of the nonlinear second order positive feedback between technological development and demographic growth
Note that the relationship between technological development and demographic growth cannot be analyzed through any simple cause-and-effect model, as we observe a true dynamic relationship between these two processes – each of them is both the cause and the effect of the other.
Note also that the process discussed above should be identified with the process of collective learning (on the notion of ‘collective learning’ see first of all Christian 2005: 146–148; see also David Christian's and David Baker's contributions to the present volume). Respectively, the mathematical models of the World System development discussed in this article can be interpreted as mathematical models of the influence of collective learning on the global social evolution. Thus, a rather peculiar hyperbolic shape of the acceleration of the global development observed prior to the early 1970s may be regarded just as a product of the global collective learning. Elsewhere we have also shown (Korotayev, Malkov, and Khaltourina 2006a: 34–66) that for the period prior to the 1970s the World System economic and demographic macrodynamics driven by the above mentioned positive feedback loops can be described mathematically in a rather accurate way with the following extremely simple mathematical model:
while the world GDP (G) can be calculated using the following equation:
where G is the world GDP, N is population, and S is the produced surplus per capita, over the subsistence amount (m) that is minimally necessary to reproduce the population with a zero growth rate in a Malthusian system (thus, S = g – m, where g denotes per capita GDP); a and b are parameters.
Note that the mathematical analysis of the basic model (not presented here) suggests that up to the 1970s the amount of S (per capita surplus produced at the given level of World System development) should be proportional, in the long run, to the World System's population: S = kN. Our statistical analysis of the available empirical data has confirmed this theoretical proportionality (Korotayev, Malkov, and Khaltourina 2006a: 49–50). Thus, in the right-hand side of equation (6) S can be replaced with kN, and as a result we arrive at the following equation:
As we remember, the solution of this type of differential equations is
and this produces simply a hyperbolic curve.
As, according to our model, S can be approximated as kN, its long-term dynamics can be approximated with the following equation:
Thus, the long-term dynamics of the most dynamic component of the world GDP, SN, ‘the world surplus product’, can be approximated as follows:
Of course, this suggests that the long-term world GDP dynamics up to the early 1970s must be approximated better by a quadratic hyperbola than by a simple one; and, as we could see below (see Fig. 4), this approximation works very effectively indeed:
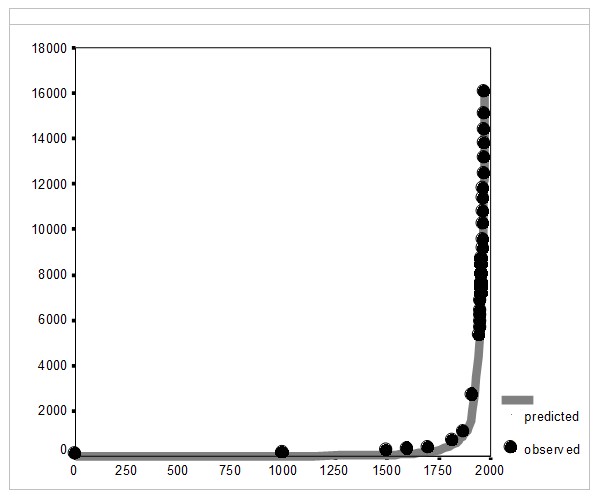
Fig. 4. World GDP Dynamics, 1–1973 CE (in billions of 1990 international dollars, PPP): the fit between predictions of a quadratic-hyperbolic model and the observed data
Note: R = .9993, R2 = .9986, p << .0001. The black markers correspond to Maddison's (2001) estimates (Maddison's estimates of the world per capita GDP for 1000 CE has been corrected on the basis of [Meliantsev 2004]). The grey solid line has been generated by the following equation:
Thus, up to the 1970s the hyperbolic growth of the world population was accompanied by the quadratic-hyperbolic growth of the world GDP, just as our model suggests. Note that the hyperbolic growth of the world population and the quadratic-hyperbolic growth of the world GDP are tightly interconnected processes, actually two sides of the same coin, two dimensions of one process propelled by the nonlinear second order positive feedback loops between the technological development and demographic growth (see Fig. 5).
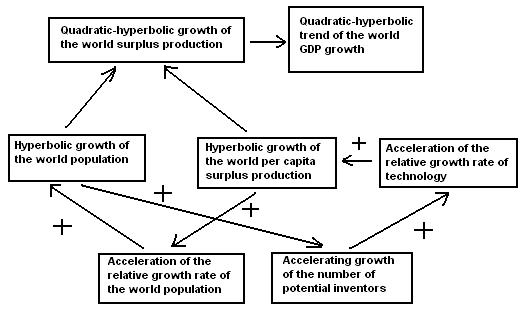
Fig. 5. Cognitive Scheme of the Generation of Quadratic-Hyperbolic Trend of the World Economic Growth by the Nonlinear Second Order Positive Feedback between Technological Development and Demographic Growth
We have also demonstrated (Korotayev, Malkov, and Khaltourina 2006a: 67–80) that the dynamics of the World System population's literacy (l) is rather accurately described by the following differential equation:
where l is the proportion of the population that is literate, S is per capita surplus, and a is a constant. In fact, this is a version of the autocatalytic model. It has the following sense: the increasing literacy is proportional to the fraction of the population that is literate, l (potential teachers), to the fraction of the population that is illiterate, (1 – l) (potential pupils), and to the amount of per capita surplus S, since it can be used to support educational programs (in addition to this, S reflects the technological level T that implies, among other things, the level of development of educational technologies). Note that, from a mathematical point of view, Equation 9 can be regarded logistic where saturation is reached at literacy level l = 1, and S is responsible for the speed with which this level is approached.
It is important to emphasize that with low values of l (which correspond to most part of human history except for the recent decades), the increasing rate of the world literacy generated by this model (against the background of hyperbolic growth of S) can be approximated rather accurately as hyperbolic (see Fig. 6).
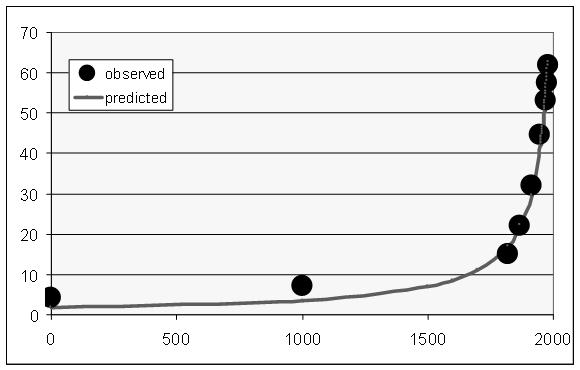
Fig. 6. World Literacy Dynamics, 1 – 1980 CE (%%): the fit between predictions of the hyperbolic model and the observed data
Note: R = 0.997, R2 = 0.994, p << 0.0001. Black dots correspond to UNESCO/World Bank (2014) estimates for the period after 1970, and to Meliantsev's (2004) estimates for the earlier period. The grey solid line has been generated by the following equation:
The best-fit values of parameters С (3769.264) and t0 (2040) have been calculated with the least squares method.
The overall number of literate people is proportional both to the literacy level and to the overall population. As both of these variables experienced a hyperbolic growth until the 1960s/1970s, one has sufficient grounds to expect that until recently the overall number of literate people in the world (L)9 grew not just hyperbolically, but rather in a quadratic-hyperbolic way (as the world GDP did). Our empirical test has confirmed this – the quadratic-hyperbolic model describes the growth of the literate population of the planet with an extremely good fit indeed (see Fig. 7).
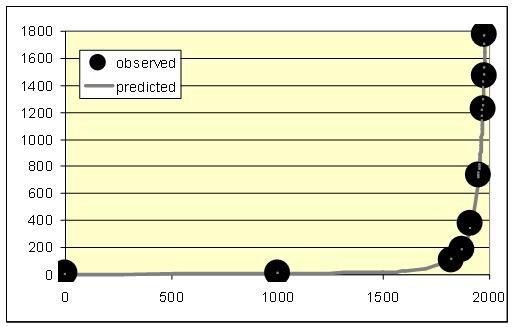
Fig. 7. World Literate Population Dynamics, 1–1980 CE (L, millions): the fit between predictions of the quadratic-hyperbolic model and the observed data
Note: R = 0.9997, R2 = 0.9994, p << 0.0001. The black dots correspond to UNESCO/World Bank (2014) estimates for the period since 1970, and to Meliantsev's (2004) estimates for the earlier period; we have also taken into account the changes of age structure on the basis of UN Population Division (2014) data. The grey solid line has been generated by the following equation:
The best-fit values of parameters С (4958551) and t0 (2033) have been calculated with the least squares method.
Similar processes are observed with respect to world urbanization, whose macro dynamics appears to be described by the differential equation:
where u is the proportion of the population that is urban, S is per capita surplus produced with the given level of the World System's technological development, b is a constant, and ulim is the maximum possible proportion of the urban population. Note that this model implies that during the blow-up regime of the ‘Malthusian-Kuznetsian’ era, the hyperbolic growth of world urbanization must have been accompanied by a quadratic-hyperbolic growth of the urban population of the world, which is supported by our empirical tests (see Figs 8–9).
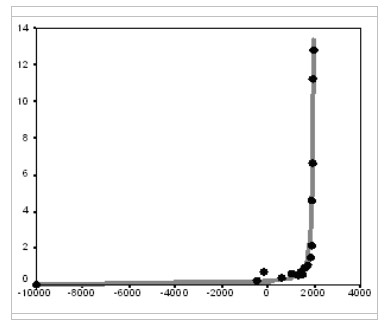
Fig. 8. World Megaurbanization Dynamics (% of the world population living in cities with > 250 thousand inhabitants), 10000 BCE – 1960 CE: the fit between predictions of the hyperbolic model and empirical estimates
Note: R = 0.987, R2 = 0.974, p << 0.0001. The black dots correspond to Chandler's (1987) estimates, UN Population Division (2014), Modelski (2003), and Gruebler (2006). The grey solid line has been generated by the following equation:
The best-fit values of parameters С (403.012) and t0 (1990) have been calculated with the least squares method. For comparison, the best fit (R2) obtained here for the exponential model is 0.492.
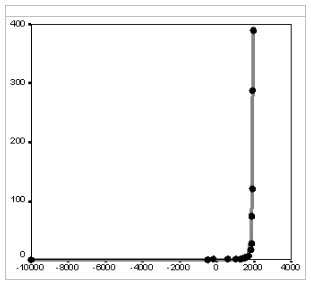
Fig. 9. Dynamics of World Urban Population Living in Cities with more than 250,000 Inhabitants (mlns), 10000 BCE – 1960 CE: the fit between predictions of the quadratic-hyperbolic model and the observed data
Note: R = 0.998, R2 = 0.996, p << 0.0001. The black markers correspond to estimates of Chandler (1987) and UN Population Division (2014). The grey solid line has been generated by the following equation:
The best-fit values of parameters С (912057.9) and t0 (2008) have been calculated with the least squares method. For comparison, the best fit (R2) obtained here for the exponential model is 0.637.
Within this context it is hardly surprising that the general macro dynamics of the size of the largest settlement within the World System is also quadratic-hyperbolic (see Fig. 10).
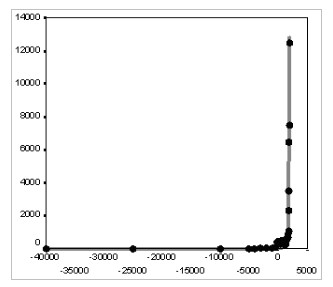
Fig. 10. Dynamics of Size of the Largest Settlement of the World (thousands of inhabitants), 10000 BCE – 1950 CE: the fit between predictions of the quadratic-hyperbolic model and the observed data
Note: R = 0.992, R2 = 0.984, p << 0.0001. The black markers correspond to estimates of Modelski (2003) and Chandler (1987). The grey solid line has been generated by the following equation:
The best-fit values of parameters С (104020618.5) and t0 (2040) have been calculated with the least squares method. For comparison, the best fit (R2) obtained here for the exponential model is 0.747.
As has been demonstrated by cross-cultural anthropologists (see, e.g., Naroll and Divale 1976; Levinson and Malone 1980: 34), for pre-agrarian, agrarian, and early industrial cultures the size of the largest settlement is a rather effective indicator of the general sociocultural complexity of a social system. This, of course, suggests that in the ‘Malthusian-Kuznetsian’ era the World System's general sociocultural complexity also increased, in a generally quadratic-hyperbolic way.
As we have noted in the beginning, the dynamics of marine biodiversity is strikingly similar to the population dynamics in China, the country with the best-known demographic history.
The similarity probably stems from the fact that both curves are produced by the interference of the same three components (general hyperbolic trend, as well as cyclical and stochastic dynamics). In fact, there is a lot of evidence that some aspects of biodiversity dynamics are stochastic (Raup et al. 1973; Sepkoski 1994; Markov 2001a; Markov 2001b; Cornette and Lieberman 2004), while others are periodic (Raup and Sepkoski 1984; Rohde and Müller 2005). On cyclical and stochastic components of the long-term population dynamics of China (as well as other complex agrarian societies) see, e.g., Korotayev and Khaltourina 2006; Korotayev, Malkov, and Khaltourina 2006b; Chu and Lee 1994; Nefedov 2004; Turchin 2003, 2005a, 2005b; Turchin and Korotayev 2006; Turchin and Nefedov 2009; Usher 1989; Komlos and Nefedov 2002; Grinin, Korotayev and Malkov 2008; Grinin et al. 2009; Grinin 2007c; Korotayev 2006; Korotayev, Khaltourina, and Bozhevolnov 2010; Korotayev et al. 2010; van Kessel-Hagesteijn 2009; Abel 1980; Braudel 1973; Goldstone 1991; Grinin, Korotayev 2012 etc.).
In fact, similarly to what we have observed with respect to the world population dynamics, even before the start of its intensive modernization, the population dynamics of China was characterized by a pronounced hyperbolic trend – as we can see below (see Figs 11 and 12), the hyperbolic model describes traditional Chinese population dynamics much more accurately than either linear or exponential models do:
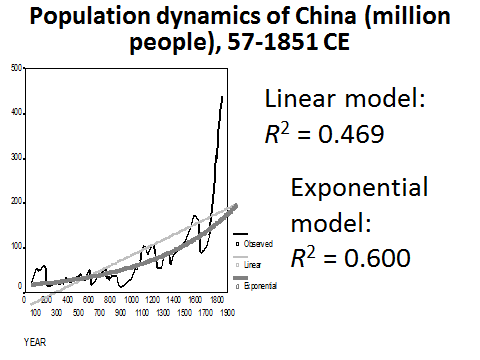
Fig. 11. Population Dynamics of China (million people), 57–1851 CE: fit with linear and exponential models
Note: based on calculations in Korotayev, Malkov, and Khaltourina 2006b: 47–88.
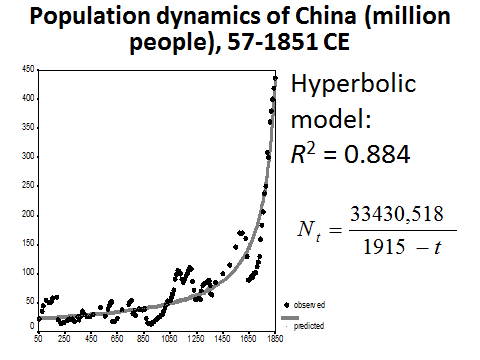
Fig. 12. Population Dynamics of China (million people), 57–1851 CE: fit with a hyperbolic model
The hyperbolic model turns out to describe mathematically the population dynamics of China in an especially accurate way with respect to the modern period (see Fig. 13).
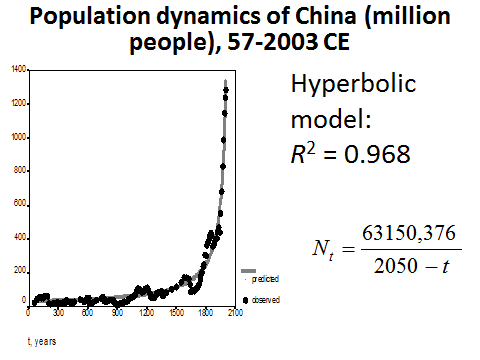
Fig. 13. Population Dynamics of China (million people), 57–2003 CE: fit with a hyperbolic model
Note: based on calculations in Korotayev, Malkov, and Khaltourina 2006b: 47–88.
In a rather similar way the hyperbolic model turns out to describe the marine biodiversity (measured by number of genera) through the Phanerozoic much more accurately than the exponential one (see Fig. 14):
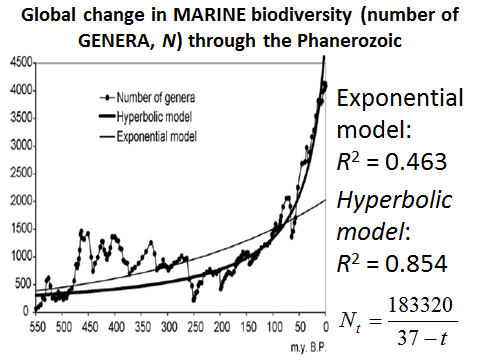
Fig. 14. Global Change in Marine Biodiversity (Number of Genera, N) through Phanerozoic
Note: based on empirical data surveyed in Markov and Korotayev (2007).
When measured in terms of species number the fit between the empirically observed marine biodiversity dynamics and the hyperbolic model becomes even better (see Fig. 15):
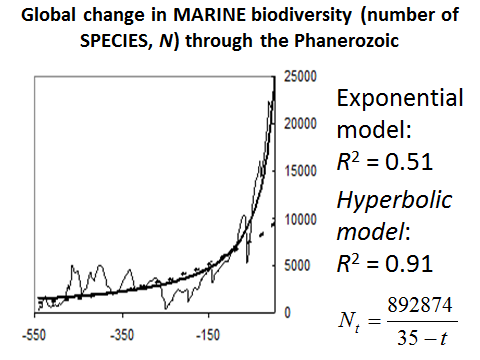
Fig. 15. Global Change in Marine Biodiversity (Number of Species, N) through Phanerozoic
Note: based on empirical data surveyed in Markov and Korotayev 2007b.
The hyperbolic model describes the continental biodiversity in an especially accurate way (see Fig. 16).
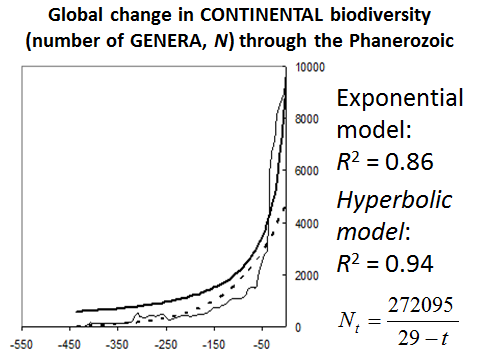
Fig. 16. Global Change in Continental Biodiversity (Number of Genera, N) through Phanerozoic
Note: based on empirical data surveyed in Markov and Korotayev 2007b.
However, the highest fit between the hyperbolic model and the empirical data is observed when the hyperbolic model is used to describe the dynamics of total (marine and continental) global biodiversity (see Fig. 17).
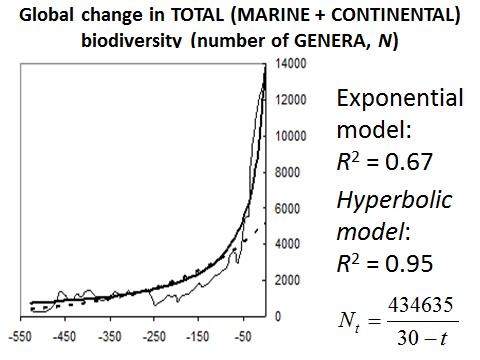
Fig. 17. Global Change in Total (Marine + Continental) Biodiversity (Number of Genera, N) through Phanerozoic
Note: based on empirical data surveyed in Markov and Korotayev 2007b.
As we see, the hyperbolic dynamics is most prominent when both marine and continental biotas are considered together. This fact can be interpreted as a proof of the integrated nature of the biosphere.
But why throughout the Phanerozoic did the global biodiversity tend to follow the hyperbolic trend (similarly to what we observed within social World System in general and China in particular)?
As we have noted above, in macrosociological models, the hyperbolic pattern of the world population growth arises from a non-linear second-order positive feedback (more or less identical with the mechanism of collective learning) between the demographic growth and technological development (more people – more potential inventors – faster technological growth – the carrying capacity of the Earth grows faster – faster population growth – more people – more potential inventors, and so on).
Based on the analogy with macrosociological models and diverse paleontological data, we suggest that the hyperbolic character of biodiversity growth can be similarly accounted for by a non-linear second-order positive feedback10 between the diversity growth and community structure complexity (more genera – higher alpha diversity – the communities become more stable and ‘buffered’– average life span of genera grows; extinction rate decreases – faster diversity growth – more genera – higher alpha diversity, and so on).
The growth of genus richness through the Phanerozoic was mainly due to the increase of average longevity of genera and gradual accumulation of long-lived (stable) genera in the biota. This pattern reveals itself in the decrease of extinction rate. Interestingly, in both biota and humanity, growth was facilitated by the decrease in mortality rather than by the increase in birth rate. The longevity of newly arising genera was growing in a stepwise manner. The most short-lived genera appeared during the Cambrian; more long-lived genera appeared in Ordovician to Permian; the next two stages correspond to the Mesozoic and Cenozoic (Markov 2001a, 2002).We suggest that diversity growth can facilitate the increase in genus longevity via the progressive stepwise changes in the structure of communities.
Most authors agree that there were three major biotic changes that resulted in fundamental reorganization of community structure during the Phanerozoic: Ordovician radiation, end-Permian extinction, and end-Cretaceous extinction (Bambach 1977; Sepkoski et al. 1981; Sepkoski 1988, 1992; Markov 2001a; Bambach et al. 2002). Generally, after each major crisis the communities became more complex, diverse and stable. The stepwise increase of alpha diversity (average number of species or genera in a community) through the Phanerozoic was demonstrated by Bambach (1977) and Sepkoski (1988). Although Powell and Kowalewski (2002) argued that the observed increase in alpha diversity might be an artifact caused by several specific biases that influenced the taxonomic richness of different parts of the fossil record, there is evidence that these biases largely compensated each other, so that the observed increase in alpha diversity was probably underestimated rather than overestimated (Bush and Bambach 2004).
Another important symptom of progressive development of communities is the increase in evenness of distribution of species (or genus) abundances. In the primitive, pioneer or suppressed communities, this distribution is strongly uneven (community is overwhelmingly dominated by a few very abundant species). In more advanced, climax or flourishing communities, this distribution is more even (Magurran 1988). The former type of community is generally more vulnerable. Evenness of distribution of species richness in communities increased substantially during the Phanerozoic (Powell and Kowalewski 2002; Bush and Bambach 2004). Most probably there was also an increase in habitat utilization, total biomass and rate of trophic flow in biota through the Phanerozoic (Powell and Kowalewski 2002).
The more complex the community, the more stable it is due to the development of effective interspecies interactions and homeostatic mechanisms based on the negative feedback principle. In a complex community, when the abundance of a species decreases, many factors arise that facilitate its recovery (e.g., there will be more food and fewer predators). Even if a species becomes extinct, its vacant niche may ‘recruit’ another species, most probably a related one that may acquire morphological similarity with its predecessor and thus, the taxonomists will assign it to the same genus. So a complex community can facilitate the stability (and longevity) of its components, such as niches, taxa and morphotypes. This effect reveals itself in the phenomenon of ‘coordinated stasis’: the fossil record shows many examples of persistence of particular communities for many million years while the rates of extinction and taxonomic turnover are minimized (Brett et al. 1996, 2007).
Selective extinction leads to accumulation of ‘extinction-tolerant’ taxa in the biota (Sepkoski 1991b). Although there is evidence that mass extinctions can be non-selective in some aspects (Jablonski 2005), they are obviously highly selective with respect to the ability of taxa to endure unpredictable environmental changes. This can be seen, for instance, from the selectivity of the end-Cretaceous mass extinction with respect to the time of the first occurrence of genera. In younger cohorts the extinction level was higher compared to the older cohorts (see Markov and Korotayev 2007a: Fig. 2). The same pattern can be observed during the periods of ‘background’ extinction as well (Markov 2000). This means that genera differ in their ability to survive the extinction events, and that in the course of time the extinction-tolerant genera accumulate in each cohort. Thus, taxa generally become more stable and long-lived in the course of evolution, apart from the effects of communities. The communities composed of more stable taxa would be, in turn, more stable themselves, thus creating a positive feedback.
The stepwise change of dominant taxa plays a major role in biotic evolution. This pattern is maintained not only by the selectivity of extinction (discussed above), but also by the selectivity of the recovery after crises (Bambach et al. 2002). The taxonomic structure of the Phanerozoic biota was changing in a stepwise way, as demonstrated by the concept of three sequential ‘evolutionary faunas’ (Sepkoski 1992). There were also stepwise changes in the proportion of major groups of animals with different ecological and physiological parameters. There was a stepwise growth in proportion of motile genera compared to non-motile; ‘physiologically buffered’ genera compared to ‘unbuffered’, and predators compared to prey (Bambach et al. 2002). All these trends should have facilitated the stability of communities (e.g., diversification of predators implies that they become more specialized; a specialized predator regulates its prey's abundance more effectively than a non-specialized predator).
There is also another possible mechanism of the second-order positive feedback between the diversity and its growth rate. Recent research has demonstrated a shift in typical relative-abundance distributions in paleocommunities after the Paleozoic (Wagner et al. 2006). One possible interpretation of this shift is that the community structure and the interactions between species in the communities became more complex. In the post-Paleozoic communities, new species probably increase ecological space more efficiently, either by facilitating opportunities for additional species or by niche construction (Wagner et al. 2006; Solé et al. 2002; Laland et al. 1999). This possibility makes the mechanisms underlying the hyperbolic growth of biodiversity and human population even more similar, because the total ecological space of the biota is analogous to the ‘carrying capacity of the Earth’ in demography. As far as new species can increase ecological space and facilitate opportunities for additional species entering the community, they are analogous to the ‘inventors’ of the demographic models whose inventions increase the carrying capacity of the Earth.
Exponential and logistic models of biodiversity imply several possible ways in which the rates of origination and extinction may change through time (Sepkoski 1991a). For instance, exponential growth can be derived from constant per-taxon extinction and origination rates the latter being higher than the former. However, actual paleontological data suggest that origination and extinction rates did not follow any distinct trend through the Phanerozoic, and their changes over time look very much like chaotic fluctuations (Cornette and Lieberman 2004). Therefore, it is more difficult to find a simple mathematical approximation for origination and extinction rates than for the total diversity. In fact, the only critical requirement of the exponential model is that the difference between the origination and extinction through time should be proportional to the current diversity level:
(No −Ne)/Δt ≈ kN, (11)
where No and Ne are the numbers of genera with, respectively, first and last occurrences within the time interval Δt, and N is mean diversity level in the interval. The same is true for the hyperbolic model. It does not predict the exact way in which origination and extinction should change, but it does predict that their difference should be roughly proportional to the square of the current diversity level:
(No −Ne)/Δt ≈ kN2. (12)
In demographic models discussed above, the hyperbolic growth of the world population was not decomposed into separate trends of birth and death rates. The main driving force of this growth is presumably the increase of the Earth's carrying capacity and the way this capacity is realized – either by decreasing death rate, or by increasing birth rate, or both – depends upon many factors and may vary from time to time.
The same is probably true for biodiversity. The overall shape of the diversity curve depends mostly on the differences in the mean rates of diversity growth in the Paleozoic (low), Mesozoic (moderate), and Cenozoic (high). The Mesozoic increase was mainly due to lower extinction rate (compared to the Paleozoic), while the Cenozoic increase was largely due to higher origination rate (compared to the Mesozoic) (see Markov and Korotayev 2007a: 316, Figs 3a, 3b). This probably means that the acceleration of diversity growth during the last two eras was driven by different mechanisms of positive feedback between diversity and its growth rate. Generally, the increment rate ((No −Ne)/Δt) was changing in a more regular way than the origination rate No/Δt and extinction rate Ne/Δt. The large-scale changes in the increment rate correlate better with N2 than with N (Ibid.: figs 3c and 3d), thus supporting the hyperbolic rather than the exponential model.
Conclusion
In macrosociological models the hyperbolic pattern of the world population growth arises from a non-linear second-order positive feedback between the demographic growth and technological development (more people – more potential inventors – faster technological growth – the carrying capacity of the Earth grows faster – faster population growth – more people – more potential inventors, and so on, which is more or less identical with the working of the collective learning mechanism). Based on the analogy with macrosociological models and diverse paleontological data, we suggest that the hyperbolic character of biodiversity growth can be similarly accounted for by a non-linear second-order positive feedback between the diversity growth and community structure complexity (which suggests the presence within the biosphere of a certain analogue of the collective learning mechanism). The feedback can work via two parallel mechanisms: 1) decreasing extinction rate (more taxa – higher is the alpha diversity, or mean number of taxa in a community – communities become more complex and stable – extinction rate decreases – more taxa, and so on), and 2) increasing origination rate (new taxa facilitate niche construction; newly formed niches can be occupied by the next ‘generation’ of taxa). The latter makes the mechanisms underlying the hyperbolic growth of biodiversity and human population even more similar, because the total ecospace of the biota is analogous to the ‘carrying capacity of the Earth’ in demography. As far as new species can increase ecospace and facilitate opportunities for additional species entering the community, they are analogous to the ‘inventors’ in the demographic models whose inventions increase the carrying capacity of the Earth. The hyperbolic growth of the Phanerozoic biodiversity suggests that ‘cooperative’ interactions between taxa can play an important role in evolution, along with generally accepted competitive interactions. Due to this ‘cooperation’ (~ ‘collective learning’?), the evolution of biodiversity acquires some features of a self-accelerating process. The same naturally refers to cooperation/collective learning as regards the global social evolution. The discussed above suggests that we can trace rather similar macropatterns within both the biological and social phases of Big History that produce rather similar curves in diagrams and that can be described in rather accurate way with rather simple mathematical models.
References
Abel, W. 1980. Agricultural Fluctuations in Europe from the Thirteenth to the Twentieth Centuries. New York: St. Martin's.
Aghion, P., and Howitt, P. 1998. Endogenous Growth Theory. Cambridge, MA: MIT Press.
Bambach, R. K. 1977. Species Richness in Marine Benthic Habitats through the Phanerozoic. Paleobiology 3: 152–167.
Bambach, R. K., Knoll, A. H., and Sepkoski, J. J. 2002. Anatomical and Ecological Constraints on Phanerozoic Animal Diversity in the Marine Realm. Proceedings of the National Academy of Sciences 99(10): 6854–6859.
Braudel, F. 1973. Capitalism and Material Life, 1400–1800. New York: Harper and Row.
Brett, C. E., Ivany, L. C., and Schopf, K. M. 1996. Coordinated Stasis: An Overview. Palaeogeography, Palaeoclimatology, Palaeoecology 127: 1–20.
Brett, C. E., Hendy, A. J. W., Bartholomew, A. J., Bonelli, J. R. Jr., and McLaughlin, P. I. 2007. Response of Shallow Marine Biotas to Sea-Level Fluctuations: A Review of Faunal Replacement and the Process of Habitat Tracking. Palaios 22: 228–244.
Bush, A. M., and Bambach, R. K. 2004. Did Alpha Diversity Increase during the Phanerozoic? Lifting the Veils of Taphonomic, Latitudinal, and Environmental Biases. Journal of Geology 112: 625–642.
Chandler, T. 1987. Four Thousand Years of Urban Growth: An Historical Census. Lewiston, NY: Edwin Mellen Press.
Christian, D. 2005. Maps of Time: An Introduction to Big History. Berkeley, CA: University of California Press.
Chu, C. Y. C., and Lee, R. D. 1994. Famine, Revolt, and the Dynastic Cycle: Population Dynamics in Historic China. Journal of Population Economics 7: 351–378.
Cohen, J. E. 1995. Population Growth and Earth's Carrying Capacity. Science 269(5222): 341–346.
Cornette, J. L., and Lieberman, B. S. 2004. Random Walks in the History of Life. Proceedings of the National Academy of Sciences 101(1): 187–191.
Foerster, H. von, Mora, P., and Amiot, L. 1960. Doomsday: Friday, 13 November, A.D. 2026. Science 132: 1291–1295.
Goldstone, J. A. 1991. Revolution and Rebellion in the Early Modern World. Berkeley, CA: University of California Press.
Golosovsky, M. 2010. Hyperbolic Growth of the Human Population of the Earth – Analysis of Existing Models. In Grinin, L. E., Herrmann, P., Korotayev, A. V., Tausch, A. (eds.), History & Mathematics. Processes and Models of Global Dynamics (pр. 188–204). Volgograd: Uchitel.
Grinin, L. E. 2007a. Production Revolutions and Periodization of History: A Comparative and Theoretic-Mathematical Approach. Social Evolution & History 6(2): 11–55.
Grinin, L. E. 2007b. Production Revolutions and the Periodization of History. Herald of the Russian Academy of Sciences 77(2): 150–156.
Grinin, L. E. 2007c. Some Reflections on the Nature of the Laws Related to the Demographic Cycles (To the Problem of Determining General Methodological Approaches to the Analysis of the Demographic Cycles). In Turchin, P. V., Grinin, L. E., Malkov, S. Yu., and Korotayev, A. V. (eds.), History & Mathematics: Conceptual Space and Directions of the Search (pp. 219–246). Moscow: LKI/URSS. In Russian (Гри- нин Л. Е. Некоторые размышления по поводу природы законов, связанных с демографическими циклами (к постановке проблемы определения общих методологических подходов к анализу демографических циклов). История и математика: Концептуальное пространство и направления поиска / Ред. П. В. Турчин, Л. Е. Гринин, С. Ю. Малков, А. В. Коротаев, с. 219–246. М.: ЛКИ/URSS).
Grinin, L. E. 2012. Macrohistory and Globalization. Volgograd: Uchitel.
Grinin, L. E., and Korotayev, A. V. 2012. Cycles, Crises, Traps of the Modern World System. The Study of Kondratieff, Juglar and Secular Cycles, Global Crises, Malthusian and Post-Malthusian Traps. Moscow: LKI/URSS. In Russian (Гринин Л. Е., Коротаев А. В. Циклы, кризисы, ловушки современной Мир-Системы. Исследование кондратьевских, жюгляровских и вековых циклов, глобальных кризисов, мальтузианских и постмальтузианских ловушек. М.: ЛКи/URSS).
Grinin, L. E., Korotayev, A. V., and Malkov, S. Yu. 2008. Mathematical Models of Socio-Demographic Cycles and the Escape from the Malthusian Trap: Some Possible Directions of Further Development. In Malinetsky, G. G., and Korotayev, A. V. (eds.), The Problems of Mathematical History. Mathematical Modelling of Historical processes (pp. 78–117). Moscow: Librokom/URSS. In Russian (Гринин Л. Е., Коротаев А. В., Малков С. Ю. Математические модели социально-демографических циклов и выхода из мальтузианской ловушки: некоторые возможные направления дальнейшего развития. Проблемы математической истории. Математическое моделирование исторических процессов / Ред. Г. Г. Малинецкий, А. В. Коротаев, c. 78–117. М.: Либроком/URSS).
Grinin, L. E., Malkov, S. Yu., Gusev, V. A., and Korotayev, V. A. 2009. Some Possible Directions of Development of the Theory of Socio-Demographic Cycles and Mathematical Models of the Escape from the Malthusian Trap. In Malkov, S. Yu., Grinin, L. E., Korotayev, A. V. (eds.), History & Mathematics: Processes and Models (pp. 134–210). Moscow: Librokom/URSS. In Russian (Гринин Л. Е., Малков С. Ю., Гусев В. А., Коротаев А. В. Некоторые возможные направления развития теории социально-демографических циклов и математические модели выхода из мальтузианской ловушки. История и Математика: процессы и модели / Ред. С. Ю. Малков, Л. Е. Гринин, А. В. Коротаев, c. 134–210. М.: Либроком/URSS).
Grossman, G., and Helpman, E. 1991. Innovation and Growth in the Global Economy. Cambridge, MA: MIT Press.
Gruebler, A. 2006. Urbanization as Core Process of Global Change: The Last 1000 Years and Next 100. Paper presented at the International Seminar ‘Globalization as Evolutionary Process: Modeling, Simulating, and Forecasting Global Change’, International Institute for Applied Systems Analysis (IIASA), Laxenburg, Austria, April 6–8.
Hoerner, S. J. von. 1975. Population Explosion and Interstellar Expansion. Journal of the British Interplanetary Society 28: 691–712.
Jablonski, D. 2005. Mass Extinctions and Macroevolution. Paleobiology 31(2): 192–210.
Jablonski, D. 2007. Scale and Hierarchy in Macroevolution. Palaeontology 50: 87–109.
Jones, Ch. I. 1995. R & D-Based Models of Economic Growth. The Journal of Political Economy 103: 759–784.
Jones, Ch. I. 2005. The Shape of Production Functions and the Direction of Technical Change. The Quarterly Journal of Economics 120: 517–549.
van Kessel-Hagesteijn, R. 2009. Dynamics in Political Centralization Processes – the Various Faces of ‘Decline’. International Symposium on Early State Formation Handbook (pp. 46–63). Peking: National Academy of China.
Kapitsa, S. P. 1999. How many People have ever Lived, Live and will Live on Earth. Moscow: Nauka. In Russian (Капица С. П. Сколько людей жило, живет и будет жить на земле. М.: Наука).
Khaltourina, D., Malkov, A., and Korotayev, A. 2006. A Compact Macromodel of the World System Demographic and Economic Growth, 1–1973 CE. In Trappl, R. (ed.), Cybernetics and Systems. Vol. 1 (pp. 330–335). Vienna: Austrian Society for Cybernatic Research.
Komlos, J., and Nefedov, S. 2002. A Compact Macromodel of Pre-Industrial Population Growth. Historical Methods 35: 92–94.
Korotayev, A. V. 2005. A Compact Macromodel of World System Evolution. Journal of World-Systems Research 11(1): 79–93.
Korotayev, A. V. 2006. Long-Term Political and Demographic Dynamics of Egypt: Cycles and Trends. Moscow: Vostochnaya Literatura. In Russian (Коротаев А. В. Долгосрочная политико-демографическая динамика Египта: циклы и тенденции. М.: Восточная литература).
Korotayev, A. V. 2007. Compact Mathematical Models of World System Development, and How They Can Help us to Clarify our Understanding of Globalization Processes. In Modelski, G., Devezas, T., and Thompson, W. R. (eds.), Globalization as Evolutionary Process: Modeling Global Change (pр. 133–160). London: Routledge.
Korotayev, A. V. 2008. Globalization and Mathematical Modeling of Global Development. In Grinin, L. E., Beliaev, D. D., and Korotayev, A. V. (eds.), Hierarchy and Power in the History of Civilizations: Political Aspects of Modernity (pp. 225–240). Moscow: LIBROCOM/URSS.
Korotayev, A. V. 2009. Compact Mathematical Models of the World System Development and Their Applicability to the Development of Local Solutions in Third World Countries. In Sheffield, J. (ed.), Systemic Development: Local Solutions in a Global Environment (pр. 103−116). Litchfield Park, AZ: ISCE Publishing.
Korotayev, A. V. 2012. Globalization and Mathematical modeling of Global Development. In Grinin, L. E., Ilyin, I. V., and Korotayev, A. V. (eds.), Globalistics and Globalization Studies (pр. 148–158). Moscow – Volgograd: Moscow State University – Uchitel.
Korotayev, A. V., and Khaltourina, D. A. 2006. Introduction to Social Macrodynamics: Secular Cycles and Millennial Trends in Africa. Moscow: URSS.
Korotayev, A. V., Khaltourina, D. A., and Bogevolnov, Yu. V. 2010. The Laws of History. Secular Cycles and Millennium Trends. Demography. Economy, Wars. 3rd ed. Moscow: LKI/URSS. In Russian (Коротаев А. В., Халтурина Д. А., Божевольнов Ю. В. Законы истории. Вековые циклы и тысячелетние тренды. Демография. Экономика. Войны. 3-е изд. М.: ЛКИ/ URSS).
Korotayev, A. V., Khaltourina, D. A., Malkov, A. S., Bogevolnov, Yu. V., Kobzeva, S. V., and Zin- kina, Yu. V. 2010. The Law of History: Mathematical Modeling and Forecasting of World and Regional Development. Moscow: LKI/URSS. In Russian (Коротаев А. В., Халтурина Д. А., Малков А. С., Божевольнов Ю. В., Кобзева С. В., Зинькина Ю. В. Законы истории. Математическое моделирование и прогнозирование мирового и регионального развития. 3-е изд., испр. и доп. М.: ЛКИ/URSS).
Korotayev, A. V., Malkov, A. S., and Khaltourina, D. A. 2006a. Introduction to Social Macrodynamics: Compact Macromodels of the World System Growth. Moscow: URSS.
Korotayev, A. V., Malkov, A. S., and Khaltourina, D. A. 2006b. Introduction to Social Macrodynamics: Secular Cycles and Millennial Trends. Moscow: URSS.
Korotayev, A.V., and Malkov, A. S. 2012. Mathematical Models of the World-System Development. In Babones, S. and Chase-Dunn, Ch. (eds.), Routledge Handbook of World-Systems Analysis (pр. 158–161). London: Routledge.
Kremer, M. 1993. Population Growth and Technological Change: One Million BC to 1990. The Quarterly Journal of Economics 108: 681–716.
Kurdyumov, S. P. (Ed.) 1999. The Regimes with the Intensification. The Evolution of the Idea: The Laws of Co-evolution of Complex Structures. Moscow: Nauka. In Russian (Курдюмов С. П. (ред.) Режимы с обострением. Эволюция идеи: Законы коэволюции сложных структур. М.: Наука).
Kuznets, S. 1960. Population Change and Aggregate Output. Demographic and Economic Change in Developed Countries, pр. 324–340. Princeton, NJ: Princeton University Press.
Laland, K. N., Odling-Smee, F. J., and Feldman, M. W. 1999. Evolutionary Consequences of Niche Construction and Their Implications for Ecology. Proceedings of the National Academy of Sciences 96(18): 10242–10247.
Levinson, D. and Malone, M. 1980. Toward Explaining Human Culture. New Haven, CT: HRAF Press.
Maddison, A. 2001. Monitoring the World Economy: A Millennial Perspective. Paris: OECD.
Magurran, A. E. 1988. Ecological Diversity and its Measurement. Princeton, NJ: Princeton University Press.
Malthus, T. 1978 [1798]. Population: The First Essay. Ann Arbor, MI: University of Michigan Press.
Markov, A. V. 2000. The Return of the Red Queen or the Law of Increase of Average Duration of Life in the Process of Evolution. Zhurnal obschei biologii 61(4): 357–370. In Russian (Марков А. В. Возвращение Черной Королевы, или закон роста средней продолжительности существования родов в процессе эволюции. Журнал общей биологии 61(4): 357–370).
Markov, A. V. 2001a. Dynamics of the Marine Faunal Diversity in the Phane-rozoic: A New Approach. Paleontological Journal 35: 1–9.
Markov, A. V. 2001b. A New Approach to Modelling the Dynamics of the Marine Faunal Diversity in the Phanerozoic. Zhurnal obschei biologii 62(6): 460–471. In Russian (Марков А. В. Новый подход к моделированию динамики разнообразия фанерозойской морской биоты. Журнал общей биологии 62(6): 460–471).
Markov, A. V. 2002. Mechanisms Responsible for the Increase in the Taxonomic Diversity in the Phanerozoic Marine Biota. Paleontological Journal 36: 121–130.
Markov, A. V., and Korotayev, A. V. 2007a. Phanerozoic Marine Biodiversity Follows a Hyperbolic Trend. Palaeoworld 16: 311–318.
Markov, A. V., and Korotayev, A. V. 2007b. The Dynamics of Phanerozoic Marine Biodiversity Follows a Hyperbolic Trend. Zhurnal obschei biologii 68(1): 3–18. In Russian (Марков А. В., Коротаев А. В. Динамика разнообразия фанерозойских морских животных соответствует модели гиперболи-ческого роста. Журнал общей биологии 68/1: 3–18).
McEvedy, C., and Jones, R. 1978. Atlas of World Population History. New York: Facts on File.
Meliantsev, V. A. 2004. Russia's Comparative Economic Development in the Long Run. Social Evolution & History 3(1): 106–136.
Modelski, G. 2003. World Cities: –3000 to 2000. Washington: Faros2000.
Naroll, R., and Divale, W. T. 1976. Natural Selection in Cultural Evolution: Warfare versus Peaceful Diffusion. American Ethnologist 3: 97–128.
Nefedov, S. A. 2004. A Model of Demographic Cycles in Traditional Societies: The Case of Ancient China. Social Evolution & History 3(1): 69–80.
Podlazov, A. V. 2004. Theory of the Global Demographic Process. In Dmitriev, M. G., and Petrov, A. P. (eds.), Mathematical Modeling of Social and Economic Dynamics (pр. 269–272). Moscow: Russian State Social University.
Powell, M. G., and Kowalewski, M. 2002. Increase in Evenness and Sampled Alpha Diversity through the Phanerozoic: Comparison of Early Paleozoic and Cenozoic Marine Fossil Assembladges. Geology 30(4): 331–334.
Raup, D. M., Gould, S. J., Schopf, T. J. M., and Simberloff, D. S. 1973. Stochastic Models of Phylogeny and the Evolution of Diversity. Journal of Geology 81(5): 525–542.
Raup, D. M., and Sepkoski, J. J. 1984. Periodicity of Extinctions in the Geologic Past. Proceedings of the National Academy of Sciences 81(3): 801–805.
Rohde, R. A., and Müller, R. A. 2005. Cycles in Fossil Diversity. Nature 434(7030): 147–148.
Sepkoski, J. J. 1988. Alpha, Beta or Gamma: Where Does All the Diversity Go? Paleobiology 14: 221–234.
Sepkoski, J. J. 1991a. Population Biology Models in Macroevolution. In Gilinsky, N. L., Signor, P. W. (eds.), Analytical Paleobiology. Short Courses in Paleontology 4 (pp. 136–156). Knoxville: The Paleontological Society.
Sepkoski, J. J. 1991b. Diversity in the Phanerozoic Oceans: A Partisan Review. In Dudley, E. C. (ed.), The Unity of Evolutionary Biology (pp. 210–326). Portland, OR: Dioscorides Press.
Sepkoski, J. J. 1992. Phylogenetic and Ecologic Patterns in the Phanerozoic History of Marine Biodiversity. In Eldredge, N. (ed.), Systematics, Ecology and the Biodiversity Crisis (pp. 77–100). New York: Columbia University Press.
Sepkoski, J. J. 1994. Limits to Randomness in Paleobiologic Models: The Case of Phanerozoic Species Diversity. Acta Palaeontologica Polonica 38(3–4): 174–198.
Sepkoski, J. J., Bambach, R. K., Raup, D. M., and Valentine, J. W. 1981. Phanerozoic Marine Diversity and the Fossil Record. Nature 293: 435–437.
Simon, J. 1977. The Economics of Population Growth. Princeton, NJ: Princeton University Press.
Simon, J. 2000. The Great Breakthrough and its Cause. Ann Arbor, MI: University of Michigan Press.
Solé, R. V., Montoya, J. M., and Erwin, D. H. 2002. Recovery after Mass Extinction: Evolutionary Assembly in Large-Scale Biosphere Dynamics. Philosophical Transansactions of the Royal Society of London. B. 357: 697–707.
Taagapera, R. 1976. Crisis around 2005 A.D.? A Technology-Population Interaction Model. General Systems 21: 137–138.
Taagapera, R. 1979. People, Skills, and Resources: An Interaction Model for World Population Growth. Technological Forecasting and Social Change 13: 13–30.
Tsirel, S. V. 2004. On the Possible Reasons for the Hyperexponential Growth of the Earth Population. In Dmitriev, M. G., and Petrov, A. P. (eds.), Mathematical Modeling of Social and Economic Dynamics (pp. 367–369). Moscow: Russian State Social University.
Turchin, P. 2003. Historical Dynamics: Why States Rise and Fall. Princeton, NJ: Princeton University Press.
Turchin, P. 2005a. Dynamical Feedbacks between Population Growth and Sociopolitical Instability in Agrarian States. Structure and Dynamics: eJournal of Anthropological and Related Sciences 1(1). Article 3.
Turchin, P. 2005b. War and Peace and War: Life Cycles of Imperial Nations. New York: Pi Press.
Turchin, P., and Korotayev, A. 2006. Population Density and Warfare: A Reconsideration. Social Evolution & History 5(2): 121–158.
Turchin, P., and Nefedov, S. 2009. Secular Cycles. Princeton, NJ: Princeton University Press.
UN Population Division. 2014. United Nations Population Division Database. URL: http://www.un.org/ esa/population.
U.S. Bureau of the Census. 2014. World Population Information. URL: http:// www.census.gov/ipc/ www/world.html.
Usher, D. 1989. The Dynastic Cycle and the Stationary State. The American Economic Review 79: 1031–1044.
Wagner, P. J., Kosnik, M. A., and Lidgard, S. 2006. Abundance Distributions Imply Elevated Complexity of Post-Paleozoic Marine Ecosystems. Science 314: 1289–1292.
World Bank. 2014. World Development Indicators Online. Washington, DC: World Bank. URL: http://data.worldbank.org/indicator.
1 We would like to emphasize that we saw each other at that session for the first time, so we had no chance to arrange in advance the demonstration of those two diagrams.
2 To be exact, the equation proposed by von Foerster and his colleagues looked as follows: ![]() However, as von Hoerner (1975) and Kapitza (1999) showed, it can be simplified as
However, as von Hoerner (1975) and Kapitza (1999) showed, it can be simplified as ![]()
3 The second characteristic (p, standing for ‘probability’) is a measure of the correlation's statistical significance. A bit counter-intuitively, the lower the value of p, the higher the statistical significance of the respective correlation. This is because p indicates the probability that the observed correlation could be accounted solely by chance. Thus, p = 0.99 indicates an extremely low statistical significance, as it means that there are 99 chances out of 100 that the observed correlation is the result of a coincidence, and, thus, we can be quite confident that there is no systematic relationship (at least, of the kind that we study) between the two respective variables. On the other hand, p = 1 × 10–16 indicates an extremely high statistical significance for the correlation, as it means that there is only one chance out of 10000000000000000 that the observed correlation is the result of pure coincidence (in fact, a correlation is usually considered as statistically significant with p < 0.05).
4 In fact, with slightly different parameters (С = 164890.45; t0 = 2014) the fit (R2) between the dynamics generated by the von Foerster equation and the macrovariation of world population for CE 1000–1970 as estimated by McEvedy and Jones (1978) and the U.S. Bureau of the Census (2014) reaches 0.9992 (99.92 per cent), whereas for 500 BCE – 1970 CE this fit increases to 0.9993 (99.93 per cent) (with the following parameters: С = 171042.78; t0 = 2016).
5 In addition to this, the absolute growth rate is proportional to the population number – with a given relative growth rate a larger population will increase more in absolute numbers than a smaller one.
6 ‘This implication flows naturally from the non-rivalry of technology… The cost of inventing a new technology is independent of the number of people who use it. Thus, holding constant the share of resources devoted to research, an increase in population leads to an increase in the probability of technological change’ (Kremer 1993: 681); note that in the framework proposed by David Christian (2005) this corresponds precisely to the pattern of collective learning.
7 Note that ‘the growth rate of technology’ means here the relative growth rate (i.e. the level to which technology will grow in a given unit of time in proportion to the level observed at the beginning of this period).
8 Kremer did not test this hypothesis empirically in a direct way. Note, however, that our own empirical test of this hypothesis has supported it (see Korotayev, Malkov, Khaltourina 2006b: 141–146).
9 Since literacy appeared, almost all of the Earth's literate population has lived within the World System; hence, the literate population of the Earth and the literate population of the World System have been almost perfectly synonymous.
10 One wonders if it cannot be regarded as a (rather imperfect) analogue of the collective learning mechanism that plays such an important role within the social macroevolution.