On the Multivariate Analysis of the "Lisbon Process"

Almanac: History & Mathematics: Processes and Models of Global Dynamics
Abstract
Starting from Professor Kornai's assertion about the necessity to focus on the long-term perspectives of the transformation process, we analyze in this paper the Lisbon performance of the countries of the European Union from such a long-term, structural perspective. We present in a simple form the mathematical methods used in this essay. Then, we analyze Lisbon indicator performance by factor analytical means. We conclude that only a Schumpeterian vision of capitalism as a process of "creative destruction" – or rather – "destructive creation" can explain these contradictions, which we empirically reveal in this analysis, and which beset the "Lisbon process" from the very beginning. Our factor analysis tells us that a majority of the kernel Lisbon indicators go indeed hand in hand with high comparative price levels; high freight transport; high greenhouse gas emissions; low business investment rates; and low youth educational attainment rates. We conclude that in reality we are facing four underlying and contradictory processes including a Lisbon productivity factor; high eco-social exclusion; the employment performance; and the neo-liberal European model.
Keywords: international relations, international political economy, economic development, technological change, technological growth.
The "Social Policy Agenda" is the tool which the EU uses to work towards "more and better jobs" and "social cohesion", two sides of the Lisbon triangle of economic, employment and social policy reform. Our agenda is on track.
Anna Diamantopoulou, former Commissioner for Employment and Social Affairs (quoted in Tucker 2003).
1. Introduction
Three years after European Union accession and almost two decades after transformation process had begun it is time to take a more systematic and global view on what has been achieved since 1989, and what problems might be ahead in East Central Europe and in the EU-27 as a whole. Is Eastern Europe really catching up with the West, and is the enlarged and transformed Europe really on its way to become by 2010 the most competitive region in the world economy?
That such a perspective is permitted, or even recommended in the scientific debate about the region and about the EU-27 is far from clear. Harvard Professor Janos Kornai, who experienced in his own life, which is so typical for the political experience of the region, a decade of authoritarian rule, followed by the horrors of the Nazis and the Second World War, followed by more than five decades of Communism and less than two decades of freedom, democracy and a market economy, rightly pointed out that mainstream economics relinquishes the profound criticism of the capitalist economy to "those professing radical views" (Kornai 2005). Kornai went on to say that even when the economic profession accepts the fact that there may be problems, it lulls itself into believing that these problems can be reassuringly resolved by applying appropriate measures. It denies, Kornai says, that the system may have inborn, insurmountable genetic defects. Compared to the rapid political and human rights transformation, which the region experienced, and which Kornai continues to call an "unparalleled success", all achieved in a climate of democracy and non-violence, one is at least permitted to speak about the negative sides as well – not in the form of a balance sheet, but as an agenda for future policy and research.
For Kornai, some of these main contradictions are:
1) the real income of a significant proportion of the population has remained unchanged, or even deteriorated;
2) "a dramatic restructuring", which has taken place in the area of income distribution;
3) the employment rate has significantly declined and open unemployment has appeared, and job security disappeared;
4) public security was deteriorating;
5) corruption;
6) disorders in the political arena;
7) "it can be stated with certainty that capitalism gives birth to disparity. But tax policies favoring the rich while afflicting the impoverished, or poorly distributed state subsidies, can make matters even worse" (Kornai 2005).
But also in Western Europe, and not only in the "old Europe", such a perspective is necessary. Dissatisfaction with the "Lisbon process" of the European Union, initiated at the European Council meeting in Lisbon, March, 2000, to make Europe the most competitive economy of the world by 2010, is widespread, notwithstanding relevant optimistic recent voices from the Commission.[1] As shown in Graph 1 in terms of real purchasing power Europe by far lags behind the Canada and US, the later it's main Lisbon process competitor.
Authors like Joseph Alois Schumpeter, and later world system and dependency writers like Samir Amin, Volker Bornschier, Fernando Henrique Cardoso, Raul Prebisch, and Osvaldo Sunkel, were always aware of the crises, cyclical imbalances, regional shifts, and of the rise and decline of entire regions and even continents in the process of capitalist development. We return in a way to the "old Galicia" of 1909 to 1911, where Joseph Alois Schumpeter, the Harvard economist, gained valuable insights into the nature of world development. Schumpeter, as it is well-known, was then a professor at the then Austrian University of Czernowitz (a German-language university, now Chernivtsi University in Northern Bukovina, Ukraine). The young professor and Ph.D. from Vienna University could well observe at first hand this "creative destruction", which capitalism constituted in the Galician periphery of the Empire. Several of his major works, like The Nature and Essence of Theoretical Economics (1908),The Theory of Economic Development: An Inquiry into Profits, Capital, Credit, Interest and the Business Cycle (1911) were all heavily influenced by his early experiences at the outer rim, and not by the experience of the "center".[2]
Graph 1. Europe still lags behind in terms of real purchasing power
Source: Our own compilations from Eurostat, freely available at: http://epp.eurostat. ec.europa.eu/portal/page?_pageid=1090,30070682,1090_33076576&_dad=portal&_schema=PORTAL. The message of this graph is clear – Canada and the US are ahead of the EU-25, the EU-15 and the Eurozone; and Japan declined from 1996 to 2002, to moderately recover ever since. Instead of surging ahead, the core regions of Western Europe relatively stagnated since the beginning of the Lisbon process in 2000.
Like many other development theorists of the first generation of development economists after the Second World War, whose stars began to rise long after Schumpeter already went to America, Kurt Mandelbaum, Paul Narcyz Rosenstein-Rodan, and Hans Wolfgang Singer shared with Schumpeter the observation that capitalism never was a smooth equilibrium process. Mandelbaum, Rosenstein-Rodan and Singer, and the dependency theorists in Latin America, which they so heavily influenced, were deeply convinced that capitalism is NOT the crisis-free growth, the full employment, the environmental sustainability and the end to social exclusion.
At the end of the day, a realistic and politically useful analysis of the "Lisbon process" has to be "Schumpeterian" in its question writing – not excluding the contradictions inherent in the process of capitalist development, which we witness since the year 1989 at the pan-European level. Let us state here at the outset and in the spirit of the Kornai 2005 IEA Presidential address, that unemployment is still the most important single problem of the region, almost two decades after the transformation. The human cost of the transformation process in form of increased rate of unemployment to most of the new member countries in Eastern Europe has been high (see Graph 2).
We will not shy away in this paper from taking a global, "world systems theory perspective" on the trajectory of events and performances since 1989. We will analyze the process of the European political economy at the level of the EU-27, and at the level of the European regions with advanced methods of quantitative political science and quantitative political economy.
Graph 2. The human costs of the transformation process – unemployment rate
Source: Our own calculations from UNICEF Trasmonee database, freely available at http://www.unicef-icdc.org/research/. Our data show the depth of the transformation crisis in East Central Europe. The graph shows that the transformation process brought about huge problems of unemployment, from which the region of East Central Europe only lately recovers (or does not really recover at all, as is the case in Poland).
The region still recovers from the great human toll, which the transformation meant – above all in terms of foregone female and male life expectancies, especially of the poorer strata of society. The decline in female life expectancy in the new members of the EU – Slovenia, Slovak Republic, Latvia, Lithuania, and Bulgaria – was considerable in 1993–1996. However, it rapidly recovered and increased significantly by 2005. The best performance was found in Slovenia, followed by Poland and Czech Republic (see Graph 3a). The development for other East European countries is not improving over time. The worst performance could be observed in Moldavia, Russia and Ukraine (see Graph 3b).
Graph 3a. The human costs of the transformation process – female life expectancy in the new EU-member countries in Eastern Europe
Source: Our own calculations from UNICEF Trasmonee database, freely available at http://www.unicef-icdc.org/research/. Our data show the depth of the transformation crisis in East Central Europe. Our graph shows the depth of the transformation crisis, comparable to the depth of the crisis of the 1930s, described by Karl Polanyi, during the years 1989–1995 (in Romania even until 1998). In Lithuania female life expectancy began to stagnate and even to shrink again in 2003.
Graph 3b. The human costs of the transformation process – female life expectancy in other Eastern European countries
Source: Our own calculations from UNICEF Trasmonee database, freely available at http://www.unicef-icdc.org/research/. Our data show the depth of the transformation crisis in East Central Europe. Our graph again shows the depth of the transformation crisis, comparable to the depth of the crisis of the 1930s, described by Karl Polanyi, during the 1990s. The socio-economic "tsunami", which hit Russia was even more severe – a tidal wave 1989–1994, a short recovery 1994–1998, again a downslide 1998–2003, and now the task of recovery from 2003 onwards. The depth of the social depression was reached in the Ukraine in 1995, and the country is again in a downward slide since 2003. The words of Polanyi come to our minds: "The failure of the traditional political system of Europe to provide safety and security…" (Polanyi 1957 [1944]: 248).
We observe significant differences in the life expectancy by gender among the sample countries. What is certainly most alarming is the fact that male life expectancies in some countries are again heading in a downward direction even well after 2000. In some countries, the male and female life expectancies develop differently. The largest declines in male life expectancy happened during 1993–1996 and were observed in Lithuania, Latvia and Estonia (see Graph 4a). A number of other Eastern European countries, like Albania, Macedonia and Croatia converge in their male life expectancy, while several others, including Moldavia, Russia, Belarus and Ukraine, are diverging (see Graph 4b).
Graph 4a. The human costs of the transformation process – male life expectancy in the new EU-member countries in Eastern Europe
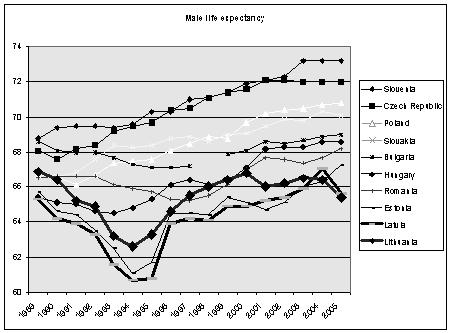
Source: Our own calculations from UNICEF Trasmonee database, freely available at http://www.unicef-icdc.org/research/. Our data show the depth of the transformation crisis in East Central Europe in accordance with Karl Polanyi's analysis. In all three Baltic Republics, the transformation crisis was deepest, and in both Latvia and Lithuania, there is even a new negative downturn in 2004.
Although there is now a real flood of literature on the subject of the "Lisbon process", a real thorough statistical investigation on the interrelationship and compatibility between the different "Lisbon indicators" and their possible causal relationships with other important socio-economic variables is rather scarce. This paper contributes to the growing literature by parametrically estimating a multidimensional index of the "Lisbon progress" and decomposing it into underlying components and quantifying each component's contribution and the relationships within and between the components, as well as their differences across countries.
Graph 4b. The human costs of the transformation process – male life expectancy in other Eastern European countries
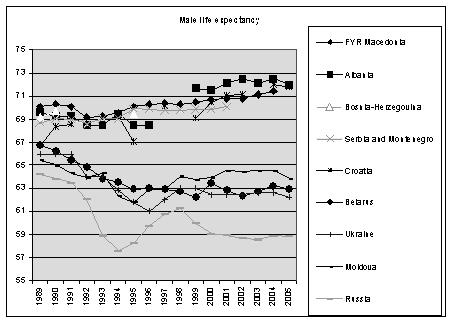
Source: Our own calculations from UNICEF Trasmonee database, freely available at http://www.unicef-icdc.org/research/. Our data show the depth of the transformation crisis in East Central Europe. Trends in male life expectancy can be hardly seen from an optimistic perspective in the former countries of the Soviet Union.
As it is well known, in March 2000, the EU Heads of States and Governments agreed to make the EU "the most competitive and dynamic knowledge-driven economy by 2010". Although some progress has been made on innovating Europe's economy, there is a growing concern that the reform process is not going fast enough and that the ambitious targets will not be reached.[3] As it is also widely known, the 14 main structural "Lisbon" agenda indicators, created to measure progress in meeting these Lisbon targets, play an important role in European policy-making.[4] The Lisbon lists of indicators, apart from the highly publicized debt-related Maastricht criteria of the European Monetary Union are perhaps the most important checklists for government success or failure in Europe today. They are omni-present in the public political as well as scientific debate.
Maximizing all indicators at once might be desirable from the viewpoint of European decision makers, but we cannot be certain about the all important interrelationships and incompatibilities between the 14 indicators. So:
· First, we analyze the Lisbon performance of European countries by multivariate, quantitative means, looking into the possible contradictions that might exist between the different components of the "Lisbon process".
· Secondly, we analyze regional performance since the 1990s in order to know whether growth and development in Europe spread evenly among the different regions of the continent.
The rest of the paper is organized as follows. In Section 2, the methodology of the multivariate analysis is outlined. Section 3 discusses the limitations of the single factor Eurostat approach to assess the Lisbon process. The issue of composite or multidimensional models with a four-factor model is further discussed in Section 4. The review of the literature and the comparisons with previous results is made in Section 5. The issue of causality of the Lisbon process on the European level is discussed in Section 6. Section 7 is an analysis of economic growth and the European regions. Section 8 concludes this study.
2. The methodology of multivariate analysis
In the literature we find both of quantitative and a qualitative methods to measure outcomes of activities. Outcomes are often multidimensional and are represented by multiple indicators with both positive and negative effects on the outcomes. However, our objective here is not to evaluate effects of certain policy programs, but rather to quantify the state of an object to be studied. The multidimensionality of outcomes requires the creation of composite indices to have a single measure and to be able to aggregate indicators in a satisfactory way. Here the focus is on the construction of an index that is multidimensional and decomposable to use it in describing the Lisbon process. Such an index will be a useful tool in the evaluation of the outcome of the member countries efforts, the policy impacts on development in the region and in the quantification of the progress in achieving the stated goals. In this section, we introduce two non-parametric and parametric approaches to compute composite indices frequently used in the evaluation of outcomes of policies and for the ranking of countries.
2.1. Non-parametric index
The non-parametric index is a composite index constructed such to aggregate a number of indicators of a certain process or outcome. Such indices, inter alia, are used for the measurement of globalization (Tausch and Ghymers 2007; Mahler 2001; Tausch and Hermann 2001; Kearney 2002, 2003; Heshmati 2006; Heshmati and Tausch 2007; Andersen and Herbertsson 2003; Dreher 2005; Lockwood 2004; Lockwood and Redoano 2005), the environment (Kang 2002), human development (Noorbakhsh 1998), development strategy and research (Heshmati and Oh 2006; Archibugi and Coco 2004; Grupp and Mogee 2004), or other types of composite indices. For instance, the globalization index is a simple combination of all the forces driving the integration of ideas, people, and economies worldwide. It is composed of four major components: economic integration, personal contact, technology, and political engagement, each being generated from a number of determinant variables. This index can serve as a model for computation of Lisbon process index (LPI).
In case of the Lisbon process the index is composed of six components: general economic background, employment, innovation and research, economic reform, social cohesion and the environment. The LPI is then estimated parametrically or computed non-parametrically based on the normalization of the process indicators and the subsequent aggregation using an ad hoc weighting system as follows:
where i and t indicate country and time periods; m and j are within and between component variables; ![]() are the weights attached to each contributing X-variable within a component and weights attached to each of the six components; and min and max are minimum and maximum values of respective variables across countries in a given year. The index is similar to the commonly used simple but yet very powerful index, the Human Development Index (HDI), which is based on educational attainment, life expectancy, and real GDP per capita (for a review of the index see Noorbaksh 1998).
are the weights attached to each contributing X-variable within a component and weights attached to each of the six components; and min and max are minimum and maximum values of respective variables across countries in a given year. The index is similar to the commonly used simple but yet very powerful index, the Human Development Index (HDI), which is based on educational attainment, life expectancy, and real GDP per capita (for a review of the index see Noorbaksh 1998).
The index in (1) is suitable for indicators with an expected positive effect on the development process. In cases where an increase in the indicators is expected to have a negative impact on the process, the corresponding index is written as:
where the two indices differ only by the nominator of the ratio. Alternatively, prior to the normalization in (1) and aggregation, the negative indicators are transformed to inverses, (1/X) reversing their expected impact from negative to positive.
The index component's weights in equations (1) and (2) are chosen on an ad hoc basis and are constant across countries and over time. However, this non-parametric index, despite its weaknesses, can be used as a benchmark index. Lockwood (2004), in computation of a globalization index, finds the ranking of countries to be sensitive to the way the indicators are measured, normalized and weighted. Here we do not use the non-parametric index, but the weighting approach. In practice, such an index is often similar to the commonly used method, employed by the human development index, where all indicators are given equal weight (see Noorbakhsh 1998). Ideally, weights should differ by indicators, countries and over time. The importance of an indicator differs by country and over time, and it depends on the conditions, preferences and contributions of the factor's contribution to the process studied. Examples of such specificity of factors are tourism for Greece, banking for Switzerland and information technology for Finland.
2.2. Parametric multivariate index
The literature on index numbers is diverse and volumes. There are at least two alternative but parametric approaches to the non-parametric index described above. These are the principal component (PC) analysis and factor analysis (FA) which can be also used in the computation of an index for the Lisbon process.[5] The basic idea with these methods is to combine several variables into a smaller set of independent variables without loosing the essential information from the original data. Thus, the issue first was how to combine different indicators related to the Lisbon process into a single measure of its progress. In this study, we adopt the factor analysis approach. Since the two methods in normalized form give principal component scores with unit variance, we use only the factor analysis results in the analysis of the Lisbon process.
Factor analysis is a multivariate technique for examining relationships within a set of interrelated quantitative variables or a common factor. The common factors are not observable and assumed by construction to be independent from each other. The explanatory variables or indicators, which are related to each other, are combined within a single common factor. The correlation between the explanatory variables is explained by the common factors, while the remaining variance of a variable is attributed to a unique factor. The factors are derived in such a way that each maximizes the percentage of total variance attributed to each of the successive factors. The greater the variance share of the variables explained by the common factors, the better is the fit of the factor model and the more accurate is the composite index and the rank of countries.
Given a dataset with j numeric variables or indicators, at most p factor components can be computed, each being a linear combination of the original indicators with coefficients equal to the eigenvectors of the correlation of the covariance matrix. Mathematically the factor model is written as:[6]
![]()
where Yji is a jxn matrix of the measure of the centered variable j for country i in period t, Xpi is the pxj matrix of the value of the common factors for each country estimated, Eji is jxn matrix of the unique factor, the coefficients Ajp are a matrix of jxp weights called factor loadings, representing weights attached to the explanatory variables and are in proportion of the cross-country variance of the variable that is explained by the factor and Bj is a vector of nx1 weights of the unique factor.
The estimated factor scores can be used to rank the countries according to the respective factors. In our case, the factor scores are used to rank the countries with respect to the Lisbon process, i.e. a relative measure of the member countries progress. The factor components are sorted according to the descending order of the Eigenvalue, which are equal to the variance of the components. Unlike in a traditional least squares estimation method case, where the vertical distance to the fitted line is minimized, here the sum of the squared residuals is measured as distances from the point to the first principal axis.
The method of principal component analysis was originated by Pearson (1901) and further developed by Hotelling (1933). The method, as we already stated, has been employed in many areas including the computation of an environmental index (Kang 2002) and in the computation of a simple globalization index using trade and financial openness by Agénor (2003). Heshmati and Oh (2006) used the method for the computation of a Lisbon Development Strategy Index.
In Section 4, we present a more complex model, based on four factors and oblique factor rotation.
Each of the parametric and non-parametric (weighted or un-weighted) indices has their own advantages and disadvantages. In this study, they are used to measure the state of the Lisbon process among the member countries of the EU and attribute it to the possible underlying sources of progress (or "drivers" of growth, as modern Western growth theory increasingly calls them). A breakdown of the index into six major components listed above provides possibilities to identify positive and negative sources and their contributions to the member country's progress. The results can be used in the evaluation of policies in the past and the redesign of economic policy measures to bring about desirable changes in countries' efforts to achieve their goals.
3. The Eurostat aggregate single-factor model
In this section, we discuss some second thoughts on the Eurostat approach based on the aggregate single-factor model used in the assessment of the Lisbon process. Our essay thus starts by taking a closer look at the 14 main structural indicators, which play such an important role in the internal EU-decision making process. The structural indicators and their definitions are reported in Table 1.
Table 1. The 14 Lisbon structural indicators
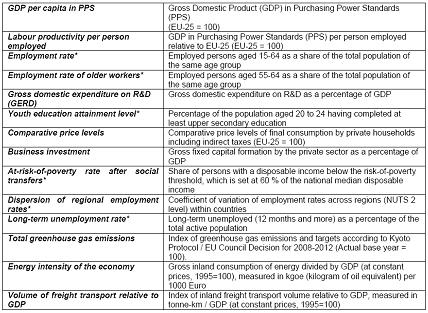
Source: The data is available at: http://circa.europa.eu/Public/irc/dsis/structind/library?l=/ general_information/annual_synthesis/2007_spring_council/february_statistical/_EN_1.0_&a=d
We will take the 14 indicators at their face value and we will look into the existing relationships and underlying possible causations. Nevertheless, we have to voice a note of caution at the outset. Of the 14 key "structural" indicators, one data series – dispersion of regional unemployment rates – does not report any data for any year since 1999 for 9 of the 27 EU member states, even after the great EU-enlargement in 2004 – Denmark, Estonia, Ireland, Cyprus, Latvia, Lithuania, Luxembourg, Malta, and Slovenia. Due to the large number of missing observations, we simply eliminated this indicator from our further calculations.
Two indicators (green house gas emissions and freight transport) we had to accept only with greatest reservations – they measure dynamic rates of increase/decrease, and not aggregate levels at a given time point (as all the other 12 indicators). Thus, they do not inform us about present achievements or failures of EU-member countries, and about achievements in comparison with aggregate US levels. As it is well-known from any course Statistics 100 at any University around the world, nations with small aggregate levels sometimes might exhibit large rates of increase in aggregate level indicator series over time, while the aggregate levels really involved might still be moderate. This is especially true for environment and pollution indicators. It is simply implausible, say, that heavy industrial Poland has a much better greenhouse gas emissions record than relatively rural Portugal. However, greenhouse gas emissions decreased in Poland and increased in Portugal. For that reason, the data show that Poland performs well, while Portugal performs badly in this respect.
Equally, and again with special relevance to environmental standards, small improvements in the Eurostat data series might make big polluters look like environmentally success stories, while in reality, they continue to contribute disproportionately to global green house gas emissions and global warming. Eurostat and the European decision makers, who drafted Eurostat's work program in the first place, are well advised to present at least a list of 14 aggregate level data series and a list of 14 dynamic rates of change data series.
To make matters worse, the Lisbon process was designed from the very beginning as a process of catching up and even overtaking the United States of America,[7] while the following chosen indicator series do not mention any data for any year for the United States of America at all:[8]
· Youth education attainment level – total
· Business investment
· At-risk-of-poverty rate after social transfers – total
· Dispersion of regional employment rates – total
As a next step in our exercise, we submitted the latest Eurostat data to the very simple but powerful statistical tool of "factor analysis".[9] Factor analysis, as we already stated, is a mathematical way of complexity reduction and dimension reduction in the social sciences, and is especially strong when the task is to reduce items from a larger test series to an underlying new variable or variables, which mathematically reproduce "the realities" (i.e. most of the time, the correlation matrix between the original variables) in an optimal fashion. Exactly this is the case here – 14 (13) Lisbon indicators must be tested as to their underlying "factor(s)" or "dimension(s)", and the Lisbon indicators must be reduced to a single or few single processes, interacting in the one and single process. Standard statistical procedures, available to contemporary social science, to perform a factor analysis include today the SPSS package (Standard Statistical Package for the Social Sciences) and SAS, available today at many Universities around Europe, East and West, North and South.[10] Factor analysis, as we already explained in Section 2, reduces the dimensions of an analysis by analyzing the underlying correlation matrix between all the variables of a model, and projects the newly and mathematically derived "indicators", which optimally reproduce the correlations between the model variables onto a new and simplified scale. Thus, the technique is often used to create new, composite indicators in the advanced social sciences. Such a mathematical indicator construction is far superior to the usual, simple adding together of variables onto a new, composite indicator, using only the average rank performances of countries.
Specifying that only one aggregate factor should be extracted, which represents the underlying correlation matrix in an optimal fashion, the following results are achieved:
Table 2. Communalities of the Lisbon structural indicators after extraction of 1 factor (= Lisbon process) in a statistical factor analytical model
|
Lisbon process structural indicator |
SPSS variable number |
Communalities, after Extraction (percentage of total variance of the respective variable explained by the factor analytical model) |
|
Comparative price levels, 2005 |
VAR13 |
0,910 |
|
Labor productivity |
VAR01 |
0,730 |
|
Energy intensity of the economy, 2004 |
VAR09 |
0,688 |
|
GDP per capita in PPS |
VAR06 |
0,646 |
|
R&D expenditures per GDP, 2004 |
VAR07 |
0,590 |
|
Employment rate |
VAR04 |
0,573 |
|
Long-term unemployment rate, 2005 |
VAR11 |
0,570 |
|
Greenhouse gas emissions, 2003 |
VAR08 |
0,385 |
|
Employment rate of older workers, 2005 |
VAR03 |
0,176 |
|
Business investment rate, 2004 |
VAR12 |
0,163 |
|
At-risk-of-poverty rate after social transfers |
VAR02 |
0,099 |
|
Freight transport, 2004 |
VAR10 |
0,025 |
|
Youth educational attainment (20–24) |
VAR05 |
0,013 |
Extracting only one factor, the following variables are "highly determined" and important in the model. The communalities of the Lisbon structural indicators in a statistical factor analytical model reported in Table 2 are the followings:
· Comparative price levels, 2005
· Labor productivity
· Energy intensity of the economy, 2004
· GDP per capita in PPS
· R&D expenditures per GDP, 2004
· Employment rate
· Long-term unemployment rate, 2005
These variables really "hold the key" for the Lisbon process, as defined by the 14/13 structural indicators. The other variables, among them the indicators "greenhouse gas emissions", and "freight transport" receive only little confirmation in our factor analysis. Thus, the variables listed below:
· Greenhouse gas emissions, 2003
· Employment rate of older workers, 2005
· Business investment rate, 2004
· At-risk-of-poverty rate after social transfers
· Freight transport, 2004
· Youth educational attainment (20–24)
are statistically not very well explained by the aggregate single "Lisbon process" factor. Our newly extracted "Lisbon process factor" explains 42.836 % of the total variance of all the 13 used Lisbon indicators (see Table 3):
Table 3. Explained total variance of the aggregate 1-factor analytical "Lisbon" model
|
Component |
Initial Eigenvalues |
Sum of squared factor loadings for extraction | ||||
|
|
Total |
% of variance |
Cumulated % |
Total |
% of variance |
Cumulated % |
|
1 |
5,569 |
42,836 |
42,836 |
5,569 |
42,836 |
42,836 |
|
2 |
2,156 |
16,588 |
59,425 |
|
|
|
|
3 |
1,777 |
13,670 |
73,095 |
|
|
|
|
4 |
1,021 |
7,854 |
80,948 |
|
|
|
|
5 |
0,825 |
6,345 |
87,294 |
|
|
|
|
6 |
0,581 |
4,472 |
91,766 |
|
|
|
|
7 |
0,369 |
2,841 |
94,607 |
|
|
|
|
8 |
0,249 |
1,918 |
96,524 |
|
|
|
|
9 |
0,172 |
1,327 |
97,851 |
|
|
|
|
10 |
0,120 |
0,921 |
98,772 |
|
|
|
|
11 |
0,100 |
0,767 |
99,539 |
|
|
|
|
12 |
0,039 |
0,303 |
99,842 |
|
|
|
|
13 |
0,021 |
0,158 |
100,000 |
|
|
|
Note: Extraction method: principal components.
The all-important factor loadings on the so-called "matrix of components" now tell us about the real structure of this newly extracted factor: "Lisbon process", which explains almost half of the total variance of all the 13, used structural Lisbon indicators. It even emerges in our calculations that high comparative price levels, and what "social Keynesians" call "high wage – and high quality social and state sector services" are, statistically speaking, the most important sine qua non of the entire Lisbon process.
Traditional variables, which all belong to the classic neo-liberal policy canon, either have very low factor loadings with this new factor "Lisbon process" or even present loadings, which run absolutely counter to traditional Lisbon strategy thinking (like the loading for "business investments"). In addition, several other assumptions of a social-ecological type, inherent in much of the policy pronouncements of European decision makers, have to be abandoned in view of our results: there is at present a positive trade-off between the dynamic rates of increases of greenhouse gas emissions, freight transport, and the overall Lisbon process.[11]
Table 4. Matrix of components for the factor analytical "Lisbon" model
|
Lisbon process structural indicator |
Factor loadings, matrix of components: "Lisbon process" |
|
Comparative price levels, 2005 |
0,954 |
|
Labor productivity |
0,854 |
|
GDP per capita in PPS |
0,804 |
|
R&D expenditures per GDP, 2004 |
0,768 |
|
Employment rate |
0,757 |
|
Greenhouse gas emissions, 2003 |
0,620 |
|
Employment rate of older workers, 2005 |
0,420 |
|
Freight transport, 2004 |
0,158 |
|
Youth educational attainment (20–24) |
–0,114 |
|
At-risk-of-poverty rate after social transfers |
–0,314 |
|
Business investment rate, 2004 |
–0,404 |
|
Long-term unemployment rate, 2005 |
–0,755 |
|
Energy intensity of the economy, 2004 |
–0,829 |
Source: Our own calculations from Eurostat sources. All calculations were performed with SPSS, version 14, August 2007, provided by Innsbruck University.
Note: factor loadings range from +1 (very high positive influence) to –1 (very high negative influence). Extraction method: principal components.
We then computed the Lisbon performance for individual country members of the EU-27. The resulting aggregate index is used to rank the countries by their performance. The final map of the overall Lisbon performance based on the single factor analytical model is reported in Map 1.
Map 1. Lisbon performance – according to a factor analytical model, based on one factor, optimally combining the 13 Lisbon structural indicators with complete data
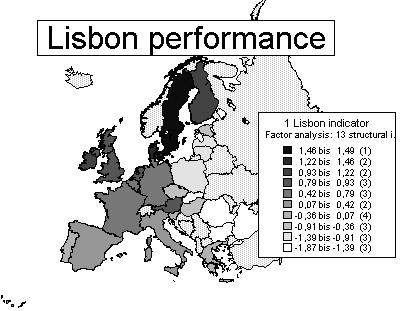
Source: Our own calculations from Eurostat sources. There are no data for the countries outside the European Union (EU-27). "Bis" is shorthand for "ranging from … to…"
4. The disaggregate four-factor Lisbon process model
This section investigates the appropriateness of the single factor Lisbon process by introducing an alternative four-factor model. Even the most coherently and ardently expressed wishes of politicians, or, for that matter, heads of government of an entire continent cannot block the winds of change and the tidal waves of reality in the capitalist world economy in the end. For the empirical political scientist, just as for the econometrician or the empirical sociologist, it is utterly irrelevant that a political class decided that 14 variables (or rather 13 Lisbon variables) represent one process. As we have shown already, performances on the 14/13 indicators vary very widely, and it is perfectly thinkable that the relationships between the variables do not correspond at all to the implicit causal triangle, often talked about by European decision makers.[1]
Implicitly, European decision makers started from the implied causal assumptions described below. This scheme could also be represented as in Diagram 1. The Lisbon strategy logic is based on the relationships between six causal and mutually re-enforcing components: general economic background, employment, innovation and research, economic reform, social cohesion and environment.
We believe however, that such a model is utterly wrong, at least judged from the relationships between the 14 indicators, which the member governments and the Commission had chosen to monitor the "Lisbon process".
Who tells us that the six dimensions, mentioned by Eurostat:
· General Economic Background (GDP per capita in PPS)
· Labor productivity
· Employment
· Innovation and Research
· Economic Reform
· Social Cohesion
· Environment
really go hand in hand?
Diagram 1. The implied Lisbon strategy logic according to the decision making of the European political class
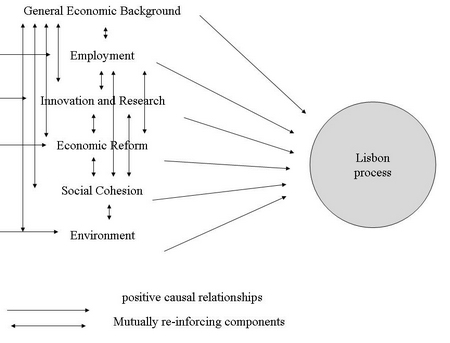
Source: Our own projections.
Rather, we tend to think that productivity and employment will emerge as highly positively interrelated factors, and that the neo-liberal dimension of some of the Eurostat structural Lisbon indicators will be rather neutral or even negative in terms of the overall success balance of the Lisbon process. We also think that there is good reason to believe that social exclusion will be negatively related to the employment and productivity dimension, and that social exclusion will be increased – at least in the short run – by governments following the neo-liberal agenda.
These assertions of course are only preliminary hypotheses. We also predict that one of the main reasons for social exclusion is the partial inability to develop and to grasp new, environmentally safe technologies. We predict that this process is stronger in the European periphery with less tighter safety nets than in the European center.
Our "confirmatory factor analysis" by large confirms these hypotheses and revealed the following structures. We started, as we stated, from the assumption that the Lisbon process variables in reality measure four distinct processes:
1. Lisbon productivity factor
2. Eco-social exclusion
3. Employment performance
4. Neo-liberal European model
We assumed that the four processes correlate with one another, so we chose the oblique rotation method, i.e. we allowed for stronger correlations between the processes. Indeed, the empirical results confirmed that these structures are underlying the Lisbon process variables. First, we reproduce the determination of the variables of the model. The determinants in the context of the four-factor model are reported in Table 5.
Table 5. Factor analytical properties of the four-factor model – the determination of the variables of the model
|
Variable, which is part of the factor analytical model |
Extraction |
|
Labor productivity |
0,949 |
|
Comparative price levels, 2005 |
0,916 |
|
Employment rate |
0,877 |
|
Employment rate of older workers, 2005 |
0,862 |
|
Business investment rate, 2004 |
0,862 |
|
Energy intensity of the economy, 2004 |
0,848 |
|
Freight transport, 2004 |
0,821 |
|
GDP per capita in PPS |
0,803 |
|
R&D expenditures per GDP, 2004 |
0,795 |
|
Youth educational attainment (20–24) |
0,767 |
|
Greenhouse gas emissions, 2003 |
0,722 |
|
Long-term unemployment rate, 2005 |
0,704 |
|
At-risk-of-poverty rate after social transfers |
0,598 |
Source: Our own calculations from Eurostat sources.
Secondly, we inform our readers about each component's contribution to the explanation of the total variance and the explained total variance in the four-factor model. These are reported in Table 6.
Table 6. Factor analytical properties of the four-factor model – explained total variance
|
Component |
Initial Eigenvalues |
Sum of squared factor loadings for extraction |
Rotated sum of squared loadings | ||||
|
|
Total |
% of variance |
Cumu- lated % |
Total |
% of variance |
Cumu- lated % |
Total |
|
1 |
2 |
3 |
4 |
5 |
6 |
7 |
8 |
|
1 |
5,569 |
42,836 |
42,836 |
5,569 |
42,836 |
42,836 |
4,961 |
|
2 |
2,156 |
16,588 |
59,425 |
2,156 |
16,588 |
59,425 |
1,888 |
|
1 |
2 |
3 |
4 |
5 |
6 |
7 |
8 |
|
3 |
1,777 |
13,670 |
73,095 |
1,777 |
13,670 |
73,095 |
3,514 |
|
4 |
1,021 |
7,854 |
80,948 |
1,021 |
7,854 |
80,948 |
2,077 |
|
5 |
0,825 |
6,345 |
87,294 |
|
|
|
|
|
6 |
0,581 |
4,472 |
91,766 |
|
|
|
|
|
7 |
0,369 |
2,841 |
94,607 |
|
|
|
|
|
8 |
0,249 |
1,918 |
96,524 |
|
|
|
|
|
9 |
0,172 |
1,327 |
97,851 |
|
|
|
|
|
10 |
0,120 |
0,921 |
98,772 |
|
|
|
|
|
11 |
0,100 |
0,767 |
99,539 |
|
|
|
|
|
12 |
0,039 |
0,303 |
99,842 |
|
|
|
|
|
13 |
0,021 |
0,158 |
100,000 |
|
|
|
|
Source: Our own calculations from Eurostat sources.
NOTE: Extraction method: principal components.
Thirdly, the screeplot lists the Eigenvalues of the model. Four factors are above the crucial Eigenvalue 1 threshold. These four factors are considered as the main contributors to the Lisbon process. The four components together explain 80,9 % of the total variance. The explanatory power of the model increased from 42,8 % in the one-factor model to 80,9 % in the four-factor model (see Table 6). The screeplot for the four-factor model is shown in Graph 7.
Graph 7. Screeplot for the four-factor model
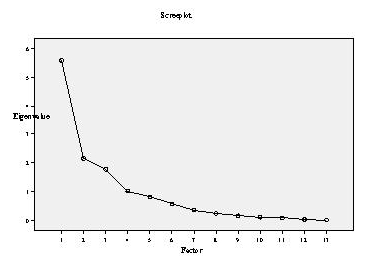
Source: Our own calculations from Eurostat sources.
The factor loadings for each of the 13 determinants generating the four factors are reported in Table 7. The table reports the positive or negative contribution from each determinant as well as the magnitude of the contribution.
Table 7. The most important relationships – factor pattern matrix, factor loadings
|
Determinants |
1 Lisbon productivity factor |
2 Eco-social exclusion |
3 Employment performance |
4 Neo-liberal European model |
|
Labor productivity |
0,965 |
0,022 |
0,279 |
–0,202 |
|
At-risk-of-poverty rate after social transfers |
–0,205 |
0,549 |
–0,327 |
0,547 |
|
Employment rate of older workers, 2005 |
0,092 |
0,015 |
0,889 |
0,061 |
|
Employment rate |
0,521 |
–0,083 |
0,908 |
–0,075 |
|
Youth educational attainment (20–24) |
–0,083 |
–0,872 |
–0,04 |
–0,114 |
|
GDP per capita in PPS |
0,882 |
–0,047 |
0,321 |
–0,189 |
|
R&D expenditures per GDP, 2004 |
0,646 |
–0,306 |
0,632 |
–0,452 |
|
Greenhouse gas emissions, 2003 |
0,652 |
0,616 |
0,234 |
–0,054 |
|
Energy intensity of the economy, 2004 |
–0,889 |
–0,342 |
–0,332 |
0,138 |
|
Freight transport, 2004 |
0,141 |
0,398 |
0,295 |
0,784 |
|
Long-term unemployment rate, 2005 |
–0,579 |
–0,177 |
–0,764 |
0,065 |
|
Business investment rate, 2004 |
–0,332 |
–0,126 |
–0,133 |
0,873 |
|
Сomparative price levels, 2005 |
0,907 |
0,149 |
0,599 |
–0,268 |
Source: Оur own calculations from Eurostat sources.
We conclude that in reality we are faced with four underlying processes of the Lisbon process including a Lisbon productivity factor; the avoidance or existence of high eco-social exclusion; the employment performance; and the neo-liberal European model. The four factors are not clearly and positively linked to each other. The interaction of these factors shows that the productivity factor is positively correlated with eco-social exclusion and the employment performance but negatively correlated with neo-liberalism. Eco-social exclusion is negatively associated with the employment performance, but positively associated with the neo-liberal model, and finally the neo-liberal model has negative effects on the employment performance. The correlations among the factors are reported in Table 8.
Table 8. Correlation matrix of the four factor components
|
Factor components |
1 Lisbon productivity factor |
2 Eco-social exclusion
|
3 Employment performance
|
|
|
|
|
–0,064 |
|
2. Eco-social exclusion |
0,118 |
| |
|
3. Employment performance |
0,372 |
–0,005 | |
|
4. Neo-liberal European model
|
–0,203 |
0,189 |
Source: Our own calculations from Eurostat sources.
NOTE: Extraction method: principal components. Rotation method: Oblimin with Kaiser Normalization.
In the following, we list the loadings of the different determinant factors and project the factors onto maps of the European Lisbon performance. The first factor is Lisbon productivity. The results in the form of the contribution from each factor to the productivity factor and the position of countries are reported in Map 2. The main contributors are labor productivity, comparative price levels, GDP per capita, greenhouse gas emission, R&D expenditure and the employment rate.
Map 2. Lisbon productivity factor
|
Empirically determined, factor analytical definition of the factor (factor pattern matrix, factor loadings, ranging from +1 to –1) |
Lisbon productivity factor |
|
Labor productivity |
0,965 |
|
Comparative price levels, 2005 |
0,907 |
|
GDP per capita in PPS |
0,882 |
|
Greenhouse gas emissions, 2003 |
0,652 |
|
R&D expenditures per GDP, 2004 |
0,646 |
|
Employment rate |
0,521 |
|
Freight transport, 2004 |
0,141 |
|
Employment rate of older workers, 2005 |
0,092 |
|
Youth educational attainment (20–24) |
–0,083 |
|
At-risk-of-poverty rate after social transfers |
–0,205 |
|
Business investment rate, 2004 |
–0,332 |
|
Long-term unemployment rate, 2005 |
–0,579 |
|
Energy intensity of the economy, 2004 |
–0,889 |
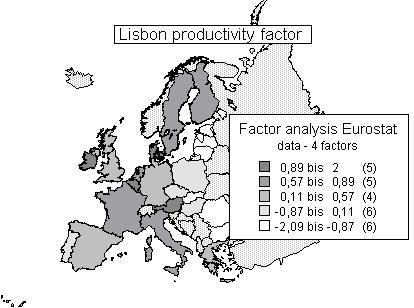
Source: Our own calculations from Eurostat sources. There are no data for the countries outside the European Union (EU-27). "Bis" is shorthand for "ranging from … to…"
The second factor could be called eco-social exclusion and ecological crisis. Similar to the presentation of the productivity factor above, in the following we list the loadings of the different determinant factors and again project the factor onto maps of the European Lisbon performance (Map 3). The main contributors are greenhouse gas emission, and at-risk-of-poverty rate.
Map 3. Eco-social exclusion
|
Empirically determined, factor analytical definition of the factor (factor pattern matrix, factor loadings, ranging +1 to –1) |
Eco-social exclusion |
|
Greenhouse gas emissions, 2003 |
0,616 |
|
At-risk-of-poverty rate after social transfers |
0,549 |
|
Freight transport, 2004 |
0,398 |
|
Comparative price levels, 2005 |
0,149 |
|
Labor productivity |
0,022 |
|
Employment rate of older workers, 2005 |
0,015 |
|
GDP per capita in PPS |
–0,047 |
|
Employment rate |
–0,083 |
|
Business investment rate, 2004 |
–0,126 |
|
Long-term unemployment rate, 2005 |
–0,177 |
|
R&D expenditures per GDP, 2004 |
–0,306 |
|
Energy intensity of the economy, 2004 |
–0,342 |
|
Youth educational attainment (20–24) |
–0,872 |
![]()
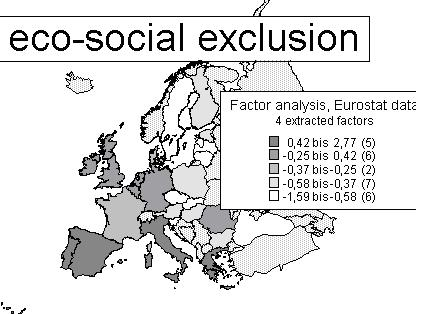
Source: Our own calculations from Eurostat sources. There are no data for the countries outside the European Union (EU-27). "Bis" is shorthand for "ranging from … to…"
The third factor measures employment performance. In the following, we again list the loadings of the different determinant factors and project the factor onto maps of European Lisbon performance. The results in the form of the contribution from each factor to the employment performance and the position of the different European countries are reported in Map 4. The main contributors are, as expected in the first place, the employment rates for all ages, the R&D expenditure and comparative price levels.
Map 4. Employment performance
|
Empirically determined, factor analytical definition of the factor (factor pattern matrix, factor loadings, ranging +1 to -1) |
Employment performance |
|
Employment rate |
0,908 |
|
Employment rate of older workers, 2005 |
0,889 |
|
R&D expenditures per GDP, 2004 |
0,632 |
|
Comparative price levels, 2005 |
0,599 |
|
GDP per capita in PPS |
0,321 |
|
Freight transport, 2004 |
0,295 |
|
Labor productivity |
0,279 |
|
Greenhouse gas emissions, 2003 |
0,234 |
|
Youth educational attainment (20–24) |
–0,040 |
|
Business investment rate, 2004 |
–0,133 |
|
At risk-of-poverty rate after social transfers |
–0,327 |
|
Energy intensity of the economy, 2004 |
–0,332 |
|
Long-term unemployment rate, 2005 |
–0,764 |
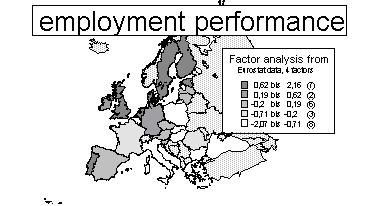
Source: Our own calculations from Eurostat sources. There are no data for the countries outside the European Union (EU-27). "Bis" is shorthand for "ranging from … to…"
The neo-liberal components of the original thinking behind the 14 Eurostat structural indicators reflect themselves very well in the fourth factor. However, the European neo-liberal model has serious disadvantages. In the following, we again list the loadings of the different determinant factors and project them again onto a map of the European Lisbon performance. The results are reported in Map 5. The main contributors are business investment, freight transport and at-risk-of-poverty rate.
Map 5. Neo-liberal European model
|
Empirically determined, factor analytical definition of the factor (factor pattern matrix, factor loadings, ranging +1 to –1) |
Neo-liberal European model |
|
Business investment rate, 2004 |
0,873 |
|
Freight transport, 2004 |
0,784 |
|
At-risk-of-poverty rate after social transfers |
0,547 |
|
Energy intensity of the economy, 2004 |
0,138 |
|
Long-term unemployment rate, 2005 |
0,065 |
|
Employment rate of older workers, 2005 |
0,061 |
|
Greenhouse gas emissions, 2003 |
–0,054 |
|
Employment rate |
–0,075 |
|
Youth educational attainment (20–24) |
–0,114 |
|
GDP per capita in PPS |
–0,189 |
|
Labor productivity |
–0,202 |
|
Comparative price levels, 2005 |
–0,268 |
|
R&D expenditures per GDP, 2004 |
–0,452 |
![]()
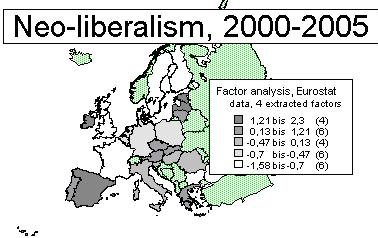
Source: Our own calculations from Eurostat sources. There are no data for the countries outside the European Union (EU-27). "Bis" is shorthand for "ranging from … to…"
5. Some comparisons with earlier research results
There are several empirical studies in which similar data and methods are used to study the Lisbon development process. Closest to the current study is the essay by Heshmati and Oh (2006), as well as Tausch and Heshmati (2006), where the authors analyze the result of the Lisbon development strategy employed by most industrialized and several developing and transition countries by measuring two parametric and non-parametric composite indices. These strategy indices quantify both the level and temporal patterns of development by ranking countries. The database used constituted a balanced panel covering 34 countries from the European Union, some East European and several other OECD countries like Turkey, the USA, Japan and Korea. The index is composed of 15 indicators grouped into six components. The main difference between the current study and Heshmati and Oh (2006) is the inclusion of Korea to the sample, and the use of two additional indicators (female labor participation rate and regional employment dispersion), and the imputation of missing data to create a balanced data matrix covering the period 1995–2003. The data in the present study do however not include South Korea and it uses 13 indicators.
Heshmati and Oh (Ibid.) identified the development of productive forces as the most important factor by using principal component analysis. The highest loadings achieved were the ones achieved by comparative prices, GDP per capita, labor productivity, high employment, research and development and reduction of the energy intensity of the economy. The authors estimated that this factor alone influences strongly both poverty and unemployment rates in the region. A second factor reflecting social exclusion[2] in society achieved its highest loadings with general employment and female participation rates and inequality in education. The power of the freight lobby in recent years is a third factor and the product, capital and labor market reforms are elements of the fourth factor, strongly reflecting the neoliberal strategy. The results suggested that the three most important central pillars of the Lisbon development strategy are:
· research and development to reduce poverty,
· the knowledge-based economy to avoid social exclusion,
· in addition, the overcoming of the power of the freight lobby for the sake of a better environment.[3]
The authors indicated also that Korea has become a technologically advanced economy and its rapid economic growth can serve as a model for economic development in many developing and transition countries. However, the country lags behind in social and welfare reforms. Despite the good performance of the index, the authors point to a number of limitations and suggested improvements to the index along several dimensions such as adding new components related to health, inequality, happiness, gender, redistribution, and other environmental aspects. Turkey has a good performance on several factors and despite its very low rank may be able to catch up with the Lisbon train (see Tausch and Heshmati 2006).
A different and technology related study by Archibugi and Coco (2004) attempted to conceptualize and to quantify the role of technological capability that is a fundamental component for achieving development goals. They developed an index of technological capabilities labeled as technology achievement index (TAI) for a large number of countries and for two periods of time, 1987–1990 and 1997–2000. The index consists of eight indicators forming three sub-components of: creation of technology, technological infrastructures and the development of human skills. The authors are aware of the limitations of each of the indicators employed, but they believe that they provide a good picture of the capabilities of each country. Despite limitation of the data, the authors suggest that it allows testing several hypotheses often discussed in the literature. First, it might contribute to the explanation of how technological capabilities are associated to economic growth. Second, it might be possible to relate the indicators to economic aspects such as production and employment.
In another study by Andersen and Herbertsson (2003), the authors used the multivariate technique of factor analysis to combine several indicators of economic integration and international transactions into a single index of globalization. The index is an alternative to the simple but popular measure of openness, based on trade relations. The index produces a ranking of 23 OECD countries over the period of 1979–2000. The results show that Belgium is the most globalized country for the entire period, Ireland during the 1990s, while the UK was at the top during the 1980s. There are some noticeable changes in the rank of several countries like the US, Canada, Japan and Norway. Although factor analysis has a number of advances, the authors warns against its disadvantages as well. First, the index is sensitive to changes in the dataset, where the inclusion or exclusion of a single country may change the factor loadings, the estimated factors and the ranking of countries. Second, outlier observations are likely to affect the results by introducing spurious variability in the data. Third, the results may also suffer from small sample problems. Fourth, data limitations may imply difficulties in the statistical identification and economic interpretation of the unobserved factors.
6. Causality of the Lisbon process on the European level
In the following, we offer some thoughts on the causality of the processes involved. We maintain that the Lisbon process can be neatly explained by the factor of "balancing work and family life", which has become an important catchword in the EU-jargon nowadays. Countries, which fail in that process, will fail in achieving the overall Lisbon targets, while countries, which manage to balance work and family life, also fulfill the Lisbon targets well.
A vast literature now exists on the economic effects of aging populations. We maintain that balancing work and family life is the factor, which best explains Lisbon performance; and that European states have a policy option to counter the aging process. European decision makers seem to have taken these often-dire warnings by the economic profession seriously. "Balancing work and family life" is seen by many as a measure to strengthen the family structure, to improve gender equality, a way out to increase fertility rates and employment rates in the end. Overlooking the necessity to balance work and family life would constitute a fatal conceit.
As we already briefly spelt out, in the empirical social policy literature now abound dire warnings about the consequences of failure to balance work and family life. Among the recent quantitative analyses on the subject, important for the general location of the present approach, we should mention Korotayaev and Khalthourina 2008, as well as Khaltourina and Korotayev 2008. An and Jeon (2006) started from the observation that most empirical studies on the economic consequence of demographic change including Bloom and Сanning (2004), find little cross-country evidence to support the assertions about the effects of declining demographic growth rates on economic growth. As was already shown by Bloom et al. (2003), the debate involves three positions, such that demographic change (or population growth) restricts, promotes or is independent of economic growth, representing the "Pessimistic", "Optimistic", and "Neutralist" theories respectively.
An and Jeon worked with panel data from 25 OECD countries over a 41-year period (1960–2000) to test the relationship of economic growth to demographic change. Among the OECD countries, the authors excluded Luxembourg, Hungary, Poland, Slovak Republic, and Czech Republic, as they do not have continuous annual series for most variables. The dependent variables were taken from Penn World Table version 6.1, while the demographic variables were from the World Development Indicators published by World Bank. Average schooling years came from Barro and Lee (2000). Economic growth was measured by log GDP per capita growth rate.
The first estimate presented by An and Jeon is the simple cross-country regression using the pooled data covering 25 countries over the period 1960–2000. The specification for the cross-country regression is based on the dependent variable PGDPGR, which is log GDP per capita growth rate and the explanatory variables LPGDPINI, INVR, OPEN, EDU, and AGESTR, which are the logarithm of initial GDP per capita, the total investment per GDP, import and export per GDP, average schooling years of the population aged 15 and over, and the age structure respectively.
The authors used four different variables for the age structure: the ratio of the old population aged 65 and over (P65R), old age dependency rate (OAGDEP), the ratio of young population aged between 0 and 14 (P014R), and the young age dependency rate (YDEP). The quadratic specifications in their Spec. 2 and Spec. 5 show, as An and Jeon correctly stress, a "significant inverted-U shape relationship", implying that the per capita GDP growth rate initially increases then decreases as either the ratio of the population aged 65 and over or old age dependency ratio rises.
To further test these hypotheses, we constructed a Eurostat data balancing work and family life indicator in Europe, optimizing female employment rates and fertility rates (see Map 6).
Map 6. Balancing work and family life in Europe
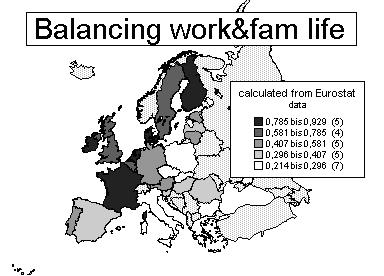
Source: Our own calculations from Eurostat data. The indicator measures, like a UNDP development indicator, female employment rates and fertility rates and projects them on a scale, ranging from 0 to 1 (highest value = 1.0, lowest value = 0). The new indicator is the average of the two component indicators. There are no data for the countries outside the European Union (EU-27). "Bis" is shorthand for "ranging from … to…"
Indeed, balancing work and family life is very clearly related to overall Lisbon performance. Graph 8 shows the causally interpreted relationship between balancing work and family life and aggregate Lisbon performance. The results are based on aggregate one-factor principal component analysis of the 13 structural Lisbon indicators with complete data.
Graph 8. The causally interpreted relationship between balancing work and family life and aggregate Lisbon performance
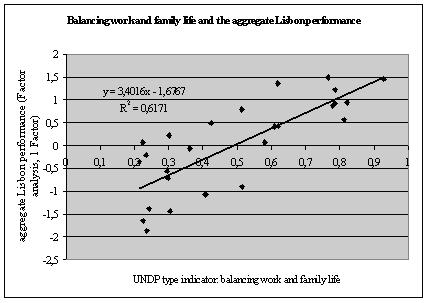
Source: Our own calculations from Eurostat sources.
The regression results suggest that balancing work and family life explains 61.71 % of the Lisbon performance of the EU-member countries. The causal path is described in the following diagram (see Diagram 2):
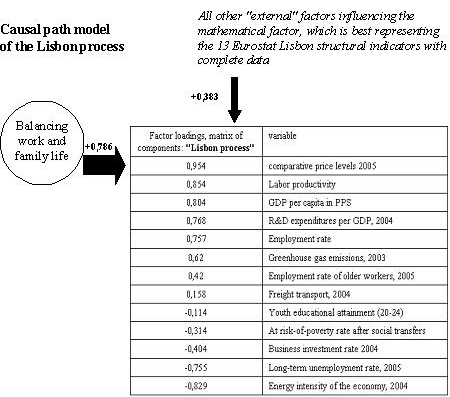
Diagram 2. A causal path model of the Lisbon process – 1 Lisbon Process factor, best representing the correlation matrix between the 13 structural Lisbon indicators with complete data
Source: Our own calculations from Eurostat sources.
In order to investigate the sensitivity of the result in respect with number of factors, we run the same regressions but using the four-factor Lisbon process results best representing the correlation matrix between the 13 Lisbon indicators with the complete data. Our causal path diagram for the four-factor Lisbon process model again supports our assertion about the necessity to come to terms with the problem of balancing work and family life in Europe. The results and contribution of each factor is reported in Diagram 3.
Diagram 3. A causal path model of balancing work and family life and the Lisbon process, represented by four oblique factors

Source: In the following Section, we will now try to test our general approach with an analysis of economic growth in Europe's regions.
7. Economic growth and the European regions
Our general approach receives a qualified support by our study about economic growth in the European regions. The general argument will be that neo-classical economic theory is of course right in claiming that significant reserves of labor are attracting economic growth, and that population growth (and inward migration!) matters, and that research and development expenditures are of importance in determining economic growth rates. Of course, there is a process of convergence taking place from the poor to the richer regions. Neoclassical economic theory is also vindicated by the fact that there is a "saturation effect" of industrialization.
However, our analysis also shows the relevance of the following phenomena, which rather belong to the agenda of a "social Europe", as was explained in a recent declaration of ten European ministers for social affairs:[4]
· keeping the young unemployed does not pay off in terms of growth;
· keeping the old in unemployment or in the labor reserve, does not pay off in terms of growth.
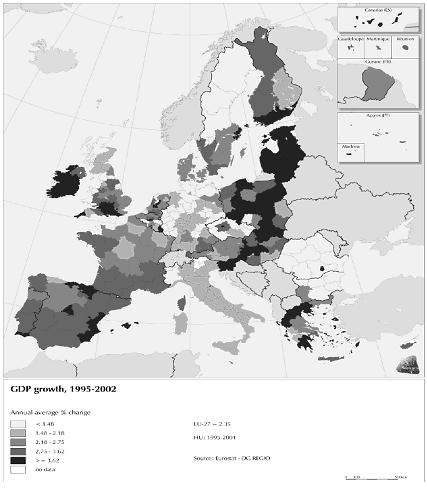
So, let us rejoice at the fact that finally, after 5 decades of European integration, there is now a real convergence taking place in Europe. While the old peripheries, like the Italian mezzogiorno lagged behind the rest of Europe for decades, and thus marred the performance balance sheet of EU-regional policy from the late 1950s to the mid 1980s, the side of the leaf now seems to have finally turned, insofar as the new peripheries in the East grow much faster than the center.
Thus, on aggregates, poorer regions today (i.e. in the decade after 1995) grew much faster than the rich ones. The complete picture of the economic growth distribution in Europe's regions during the period covering from 1995 to 2002 is shown in Map 7. In addition, the Lisbon agenda of increasing research and development, and of making Europe's regions prepared for the Lisbon agenda, worked out very well in terms of economic growth. The discrimination mechanisms and blockades against employment of the young and elderly, which manifest themselves in high unemployment rates of the young and of the elderly, are today an important and absolute impediment against regional economic growth.
In general terms, economic growth shifted from Europe's center regions to the geographical European periphery. In the first part of the first decade of the 21st century, several French regions became the real "sick man on the Bosporus", while the beginning B-phase of the long economic cycle certainly was an additional driving force to "outsource" economic growth into the periphery and the semi-periphery.
Map 7. Economic growth in Europe's regions – 1995–2002
Source: European Commission (2007).
The growth picture in Europe's regions for the period thereafter is even more dramatic. The EU-Commissions reports the unemployment rates in 2006 for each member country and their economic regions. There is evidence of a significant heterogeneity among the countries and economic regions with respect to employment, but also labor productivity and economic growth. However, most member countries suffer from low or negative employment growth. The imbalance between job destruction and job creations is quite significant in some regions like those in Eastern Germany (European Commission 2007, 2008).
Map 8. Transnational corporation's investment in Europe
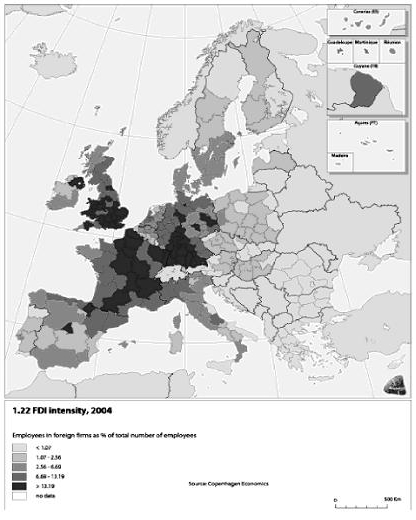
Source: European Commission (2007).
However, the rich and powerful transnational corporations remain to be "anchored" mainly in the center, with very little evidence suggesting that a real shift in their regional presence is under way. This empirical result is perhaps very surprising, and would be best discussed at length in a separate Section, dedicated to the study of the growth and development determinants on perhaps a global scale. It is suggested that the multinational corporations, in reality, are interested in the high-wage and high comparative-price level environments of Western Europe, with a few exceptions to be reported from Northern Ireland, Northern England, Wales and East Germany, where the MNCs seemed to have cashed in on comprehensive state and regional investment programs money. In Map 8, we report the transnational corporations' investment in Europe. See also Tausch 2005b.
Our final regional growth equation shows that there is indeed a process of regional convergence taking place in Europe. Significant positive predictors of the economic growth rate were:
· Economic Lisbon Indicators (average of re-scaled values relative to the EU-27 mean), 2004–2005
· Female 15–64 unemployment rate
· Long-term unemployment (% of total unemployment)
· Population growth (average annual % change), 1995–2004
· R&D expenditure (% of GDP), 2004
· Total population (1000 inhabitants), 2004
· Unemployment rate (%), 2005
Significant negative predictors were:
· Young (15–24) unemployment rate
- GDP/head in PPS (Index, EU27=100), 2004
- Ages 55–64 unemployment rate
- Employment in industry
- Employment rate (%), 2005
- Percent population above age 65+
Large reserves of labor, like existing high female unemployment, a high population reserve, and a high population growth rate, all worked in favor of economic growth. In the same fashion, we can say that already saturated labor markets in terms of high employment in industry, and a high employment rate, all worked against a high economic growth rate. Interestingly enough, however, there is a fourth phenomenon at work, and which also intervenes in the regional development equation – the discrimination mechanisms and blockades against employment of the young and elderly, which manifest themselves in high unemployment rates of the young and of the elderly (and discrimination against immigrants) are today an important impediment against regional economic growth. Therefore, we can say that the following four factors explain ¾ of regional economic growth in Europe:
· Regional convergence => poorer regions grow faster
- Research and development, fulfilling the Lisbon agenda
- Regions with untapped labor reserves grow faster than the others
- Discrimination in employment against the young and the elderly work against growth
The empirical results from our regression of economic growth in Europe 1995–2004 on its determinants at the regional level are reported in Table 9. F-test results suggest that the determinants of growth are jointly statistically different from zero. With exception of two determinants (population density and low educational attainment rate), all other determinants are significantly different from zero. The model explains 76.9 % of the variations in economic growth. Based on their impact, the indicators are divided into three groups. The category A variables has significant and positive effects on economic growth, while category C has significant and negative effects. The B category variables have no effects on economic growth.
Table 9. The determinants of economic growth in Europe, 1995–2004, at a regional level
|
Determinants of Lisbon process |
Beta |
T-value |
Error probability |
|
A. Category of Indicators: |
|
|
|
|
Female 15–64 unemployment rate |
0,321 |
3,111 |
0,002 |
|
Economic Lisbon Indicators (average of re-scaled values relative to the EU-27 mean), 2004–2005 |
0,305 |
6,092 |
0,000 |
|
Long-term unemployment (% of total unemployment) |
0,182 |
2,054 |
0,041 |
|
R&D expenditure (% of GDP), 2004 |
0,163 |
3,489 |
0,001 |
|
Unemployment rate (%), 2005 |
0,087 |
1,783 |
0,075 |
|
Population growth (average annual % change), 1995–2004 |
0,081 |
2,813 |
0,005 |
|
Total population (1000 inhabitants), 2004 |
5,00E-02 |
1,874 |
0,062 |
|
B. Category of Indicators: |
|
|
|
|
Population density (inh./km²), 2004 |
0,035 |
1,353 |
0,177 |
|
Low educational attainment rate |
–0,049 |
–1,036 |
0,301 |
|
C. Category of Indicators: |
|
|
|
|
Employment Agriculture |
–0,173 |
–5,295 |
0,000 |
|
Young (15–24) unemployment rate |
–0,275 |
–4,803 |
0,000 |
|
GDP/head in PPS (Index, EU27=100), 2004 |
–0,289 |
–5,143 |
0,000 |
|
Ages 55–64 unemployment rate |
–0,366 |
–4,493 |
0,000 |
|
Employment industry |
–0,388 |
–8,905 |
0,000 |
|
Employment rate (%), 2005 |
–1,196 |
–6,867 |
0,000 |
|
% population above age 65 + |
–1,504 |
–8,560 |
0,000 |
|
Constant |
|
6,683 |
0,000 |
Source: Our own calculations from Info Regio sources. Predictors, failing the significance test at the 10 % level, are printed in indented letters.
NOTE. Adj. R^2 = 76.9%, df. = 362; F = 76.512, error probability = 0.000.
In a way, our results are also confirmed by the recent study on behalf of the Commission, written by a team of the Copenhagen Economics Institute under the leadership of Magnus Blomström (European Commission 2007).
8. Conclusions
In this paper, we analyzed the Lisbon performance of the countries of the European Union from a long-term, structural perspective. The Lisbon indicator performance is analyzed by factor analytical means. We conclude that only a Schumpeterian vision of capitalism as a process of "creative destruction" – or rather – "destructive creation" can explain these contradictions, which we empirically reveal in this analysis, and which beset the "Lisbon process" from the very beginning.[5]
Our factor and correlation analysis, on which the factors are based, tells us that a majority of the kernel Lisbon indicators go indeed hand in hand with the: high comparative price levels, 2005; high freight transport, 2004; high greenhouse gas emissions, 2003; low business investment rate 2004; and low youth educational attainment (20–24). We conclude that in reality we are faced with four underlying and contradictory processes of the Lisbon reality including: a Lisbon productivity factor; the avoidance or existence of a high eco-social exclusion; the employment performance; and the neo-liberal European model, which is not clearly and positively linked to the other factors. The interaction of these factors shows that the productivity factor is positively correlated with eco-social exclusion and the employment performance but negatively correlated with neo-liberalism. Eco-social exclusion is negatively associated with employment performance but positively associated with the neo-liberal model, and finally the neo-liberal model reduces the employment performance.
For Schumpeter and his elitist-conservative visions of society, the decay of values in capitalist society was an all-important element in his pessimistic theory, developed in Capitalism, Socialism, and Democracy (1950). For Schumpeter, the disappearance of the enterprising, male-dominated capitalist family was an all-important element in his theory. Nevertheless, it is not the disappearance of the enterprising capitalist family, which threatens the future of capitalism in Europe, but the often still existing incompatibility of work and family life, which explains more than 60 % of Lisbon process failure.
We then proceeded to analyze with multiple regression techniques the recent European Commission data on regional growth in Europe. Patterns of discrimination against the young and the elderly on the labor market are incompatible with long-run economic growth. The results show that the following four factors explain ¾ of regional economic growth in Europe: regional convergence – poorer regions grow faster; research and development, fulfilling the Lisbon agenda; regions with untapped labor reserves grow faster than other regions; and discrimination in employment against the young and the elderly work against growth.
This essay has shown the potentials of quantitative analysis in the social sciences and in the debate about the European Union's economic competition with America, the so-called "Lisbon process". Russian science, historically always open to the use of quantitative methods and mathematics, will, we hope, find the explained methodology, described in this article, as well as the exemplary results, applied to the politically highly relevant question of the results of this economic competition between Europe and the United States of America, very useful.
Our article tried to show how this advanced model – factor analysis and principal components analysis – could be applied to highly controversial social policy questions. The neo-liberal political concept, so relevant for many of the EU's present policy makers, will not lead Europe towards more growth, stability, and social convergence. Rather, at the end of the day, the opposite could be the case, i.e. the neo-liberal strategy of lowering comparative price levels at all costs will inhibit the very aims of the "Lisbon Process".
On this sober note, we leave it to our readers to start their own investigations about the phenomena described in this article.
Bibliography
Agénor, P. R. 2003. Does Globalisation Hurt the Poor? Unpublished manuscript. Washington, DC: World Bank.
An, C. B., and S. H. Jeon. 2006. Demographic Change and Economic Growth: An Inverted-U Shape Relationship. Economics Letters 92(3): 447–454.
Andersen, T. M., and T. T. Herbertsson. 2003. Measuring Globalization. IZA Discussion Paper 817. Bonn: IZA.
Archibugi, D., and A. Coco. 2004. A New Indicator of Technological Capabilities for Developed and Developing Countries (ArCo). World Development 32(4): 629–654.
Barro, R. J., and J-W. Lee. 2000. International Data on Educational Attainment: Updates and Implications. CID Working Paper 42. Centre for International Development at Harvard University.
Bloom, D., and D. Canning. 2004. Global Demographic Change: Dimensions and Economic Significance. NBER Working Paper 10817.
Bloom, D. et al. 2003. The Demographic Dividend: A New Perspective on the Economic Consequences of Population Change. Santa Monica, CA: RAND, MR-1274.
Clauss, G., and H. Ebner. 1978. Grundlagen der Statistik. Fuer Psychologen, Paedagogen und Soziologen. Berlin: Volk and Wissen.
Dreher, A. 2005. Does Globalization Affect Growth? Empirical Evidence from a New Index. Unpublished manuscript. University of Konstanz, Department of Economics.
Eur-Lex. 2005. Communication to the Spring Council: Working Together for Growth and Jobs – A New Start for the Lisbon Strategy. COM 24 (http://europa.eu.int/eur-lex/lex/LexUriServ/site/en/com/2005/ com2005_0024en01.pdf).
European Commission. 2003. Joint Report on Social Exclusion Summarizing the Results of the Examination of the National Action Plans for Social Inclusion (2003–2005). Brussels.
European Commission. 2005a. The Economic Costs of Non-Lisbon. A Survey of the Literature on the Economic Impact of Lisbon-Type Reforms. SEC 385 (http://europa.eu.int/growthandjobs/pdf/SEC2005_385_en.pdf).
European Commission. 2005b. A New Start for the Lisbon Strategy (http://europa. eu.int/growthandjobs/index_en.htm).
European Commission. 2007. Growing Regions, Growing Europe. Fourth Report on Economic and Social Cohesion (including main regional data). (http://ec.europa.eu/ regional_policy/sources/docoffic/official/repor_en.htm; http://ec.europa.eu/regional_ policy/sources/docoffic/official/reports/cohesion4/index_en.htm).
European Commission. 2008. Growing Regions, Growing Europe. Fifth Progress Report on Economic and Social Cohesion (http://ec.europa.eu/regional_policy/sources/ docoffic/official/reports/interim5/com_2008_371_en.pdf).
European Roundtable of Industrialists, ERT. 2001. European Pensions. An Appeal for Reform. Pension Schemes that Europe Can Really Afford. Brussels: ERT.
Fahey, T. et al. 2005. First European Quality of Life Survey: Income Inequalities and Deprivation. Dublin: European Foundation for the Improvement of Living and Wokring Conditions.
Grupp, H., and M. E. Mogee. 2004. Indicators of National Science and Technology Policy: How Robust are Composite Indicators? Research Policy 33: 1373–1384.
Heshmati, A. 2003. Productivity Growth, Efficiency and Outsourcing in Manufacturing and Services. Journal of Economic Surveys 17(1): 79–112.
Heshmati, A. 2006.Measurement of a Multidimensional Index of Globalization. Global Economy Journal 6(2): 1–28.
Heshmati, A., and J.-E. Oh. 2006. Alternative Composite Lisbon Development Strategy Indices: A Comparison of EU, USA, Japan and Korea. The European Journal of Comparative Economics 3(2): 133–170.
Heshmati, A., and A. Tausch. 2007. (Eds.).Roadmap to Bangalore? Globalization, the EU's Lisbon Process and the Structures of Global Inequality. New York: Nova Science Publishers.
Hotelling, H. 1933. Analysis of a Complex of Statistical Variables into Principal Components. Journal of Educational Psychology 24: 417–441; 24: 498–520.
Jackson, D. J., and E. F. Borgatta. 1981. (Eds.). Factor Analysis and Measurement in Sociological Research. A Multi-Dimensional Perspective. London and Beverly Hills: Sage.
Kang, S. M. 2002. A Sensitivity Analysis of the Korean Composite Environmental Index. Ecological Economics 43: 159–174.
Kearney, A. T., Inc., and the Carnegie Endowment for International Peace. 2002. Globalization's Last Hurrah? Foreign Policy January/February: 38–51.
Kearney, A. T., Inc., and the Carnegie Endowment for International Peace. 2003. Measuring Globalization: Who's up, who's down? Foreign Policy January/February: 60–72.
Khaltourina, D. A., and A. V. Korotayev. 2008. Potential for Alcohol Policy to Decrease the Mortality Crisis in Russia. Evaluation and the Health Professions 31(3): 272–281.
Kim, J. O., and Ch. W. Mueller. 1978a. Factor Analysis. Statistical Methods and Practical Issues. Beverly Hills and London: Sage Publications.
Kim, J. O., and Ch. W. Mueller. 1978b. Introduction to Factor Analysis. What It Is and How to Do It. Beverly Hills and London: Sage Publications.
Kornai, J. 2005. The Great Transformation of Central Eastern Europe: Success and Disappointment. Presidential Address, I. E. A. 14th World Congress, Marrakech, Morocco, Presentation on 29th August, 2005. Plenary session (http://www.economics. harvard.edu/faculty/kornai/files/Pres_Address_Morocco.pdf).
Korotayev, A., and D. Khaltourina. 2008. Russian Demographic Crisis in Cross-National Perspective. Russia and Globalization: Identity, Security, and Society in an Era of Change / Ed. by D. W. Blum, pp. 37–78. Baltimore, MD: Johns Hopkins University Press.
Kreisky, E. 2007. Demokratie, Markt und Geschlecht. Die maskuline Welt des Joseph A. Schumpeter. Demokratie. Modus und Telos, Wien-Köln-Weimar / Hg. von A. S. Markovits und K. S. Rosenberger, S. 39–60 (http://evakreisky.at/onlinetexte/schumpeter _kreisky.php).
Lockwood, B. 2004. How Robust is the Foreign Policy-Kearney Globalization Index? The World Economy 27: 507–523.
Lockwood, B., and M. Redoano. 2005. The CSGR Globalization Index: An Introductory Guide. CSGR Working Paper 155/04.
Mahler, V. A. 2001. Economic Globalization, Domestic Politics and Income Inequality in the Developed Countries: A Cross-National Analysis. Luxembourg Income Study Working Paper: 273.
Noorbakhsh, F. 1998. The Human Development Index: Some Technical Issues and Alternative Indices. Journal of International Development 10: 589–605.
Papadopoulos, F., and P. Tsakloglou. 2003. Social Exclusion in the EU: A Capability- Based Approach. Unpublished paper. Athens.
Pearson, K. 1901. On Lines and Planes of Closest Fit to Systems of Points in Space. Philosophical Magazine 6(2): 559–572.
Polanyi, K. 1957 [1944]. The Great Transformation. The Political and Economic Origins of Our Time. Boston, MA: Beacon Press.
Schumpeter, J. A. 1934. The Theory of Economic Development. An Inquiry into Profits, Capital, Credit, Interest, and the Business Cycle. Cambridge, MA: Harvard University Press.
Schumpeter, J. A. 1939. Business Cycles. A Theoretical, Historical, and Statistical Analysis of the Capitalist Process. New York – London: McGraw-Hill Book Company.
Schumpeter, J. A. 1942. The Process of Creative Destruction. London: Unwin.
Schumpeter, J. A. 1950. Capitalism, Socialism and Democracy. 3d ed. New York – London: Harper & Row.
Schumpeter, J. A. 1954. History of Economic Analysis. New York: Oxford University Press.
Schumpeter, J. A. 1969. The Theory of Economic Development: An Inquiry into Profits, Capital, Credit, Interest, and the Business Cycle. London – Oxford: Oxford University Press.
SPSS. 2007. Statistical Package for the Social Sciences, User Guide. Version 14, August 2007.
Tausch, A. 1987. Schumpeter Mannes-Bild. Emanzipation und Partnerschaft 14(2): 11–18.
Tausch, A. 2002. The European Union and the World System. The European Union in the World System Perspective / Ed. by Ryszard Stemplowski, pp. 45–93. Warsaw: Collections PISM (Polish Institute for International Affairs).
Tausch, A. 2003a. (Ed.). Three Pillars of Wisdom: A Reader on Globalization, World Bank Pension Models and Welfare Society. Hauppauge, NY: Nova Science.
Tausch, A. 2003b. Social Cohesion, Sustainable Development and Turkey's Accession to the European Union. Alternatives: Turkish Journal of International Relations 2(1): 1–18.
Tausch, A. 2003c. The European Union: Global Challenge or Global Governance? 14 World System Hypotheses and Two Scenarios on the Future of the Union. Globalization: Critical Perspectives / Ed. by G. Kohler and E. J. Chaves, pp. 93–197. Hauppauge, NY: Nova Science Publishers.
Tausch, A. 2004. Towards a European Perspective for the Common Mediterranean House and the Positive Development Capability of Islamic Countries. European Neighbourhood Policy: Political, Economic and Social Issues / Ed. by F. Attina and R. Rossi, pp. 145–168. Catania: University of Catania.
Tausch, A. 2005a. Tectonic Shifts in the Structure of International Inequality. Centro Argentino de Estudios Internacionales, Working Papers, Working Paper N° 11, Fecha de Publicación: 14/11/05 (http://caei.com.ar/teoria.htm).
Tausch, A. 2005b. Did Recent Trends in World Society Make Multinational Corporations Penetration Irrelevant? Historia Actual On-Line 6 (http://www.hapress.com/ abst.php?a=n06a05).
Tausch, A. 2005c. Europe, the Muslim Mediterranean and the End of the Era of Global Confrontation. Alternatives. Turkish Journal of International Relations 3(4) 004: 1–29.
Tausch, A. 2005d. Is Islam Really a Development Blockade? Insight Turkey 7(1): 124–135.
Tausch, A. 2007. The City on the Hill? The Latin Americanization of Europe and the Lost Competition with the USA. Amsterdam: Rozenberg and Dutch University Press.
Tausch, A., and Chr. Ghymers. 2007. From the "Washington" Towards a "Vienna Consensus"? A Quantitative Analysis on Globalization, Development and Global Governance. Hauppauge, NY: Nova Science.
Tausch, A., and P. Herrmann. 2001. Globalization and European Integration. Huntington, NY: Nova Science.
Tausch, A. and A. Heshmati. 2006. Turkey and the Lisbon Process. A Short Research Note on the Position of Turkey on a New "Lisbon Strategy Index" (LSI). Ankara Institute for Turkish Policy Studies, ANKAM. Insight Turkey 8(2): 7–18.
Tausch, A., and F. Prager. 1993. Towards a Socio-Liberal Theory of World Development. Basingstoke and New York: Macmillan/St. Martin's Press.
Tucker, C. M. 2003. The Lisbon Strategy and the Open Method of Coordination: A New Vision and the Revolutionary Potential of Soft Governance in the European Union. Berkeley: Department of Political Science, University of California. (http://ec.europa.eu/growthandjobs/pdf/pdf_groups/Table_4/Tucker/cTucker_Lisbon%20ideology_OMC_APSA_paper.pdf)
Ueberla, K. 1971. Faktorenanalyse. Eine systematische Einfuehrung fuer Psychologen, Mediziner, Wirtschafts- und Sozialwissenschaftler. 2nd ed. Berlin, Heidelberg, New York: Springer.
[1] The Berkeley-California-based political scientist Christopher Tucker made an excellent point by saying: "First, there is nearly universal agreement that political ideologies must have coherence (i.e. consistency/constraint). This implies that they must contrast with external ideologies or the general political culture, and that they have over time shown stability. In contrast to opinions, causal beliefs, norms, or interest group platforms, ideologies are characterized by a hierarchical ordering of thought capped off with higher levels of abstractions concerning politics, power, and the related domains of social life. For example, a cornerstone of Lisbon is that it rejects neo-liberal models of economic growth in the US, which is often used as the benchmarks for what the EU wants (competitiveness) and does not want (social inequality, low quality jobs etc.). Lisbon proffers a synthetic strategic plan that conceptualizes social cohesion, employment, and economic growth as mutually interdependent sides (i.e. the Lisbon triangle) in a knowledge-based economy. From this abstraction, more specific attitudes are derived from higher order abstractions, like inclusion policies, and activating social policies" (Tucker 2003).
Tucker also correctly points out in his electronic paper that "it appears that the most powerful committee of experts (i.e. the EFC) is farthest away from the Lisbon ideology, both substantively and procedurally. It appears that they think that the other two sides (employment & social) other than the economic side of the Lisbon triangle is 'pollution'. This may raise doubts that the 'softer' sides of Lisbon Strategy are likely to be able to counter the 'hard' side of economic integration" (Ibid.).
[2] For work on social exclusion see Papadopoulos and Tsakloglou 2003.
[3] See also Tausch 2003a.
[4] The full text of this noteworthy declaration can be read at: http://www.rpfrance.eu/article. php3?id_article=66.
[5] For a selection of other related research by Tausch see Tausch 2002, 2003a, 2003b, 2003c, 2004, 2005a, 2005b, 2005c, 2005d, 2007; and Tausch and Prager 1993.
[1] For a survey of the literature on the Lisbon strategy and its evaluation see European Commission (2003, 2005a), European Commission Report (2005b), and Eur-Lex (2005).
[2] For a selection of Schumpeter's major work see Schumpeter (1934, 1939, 1942, 1950, 1954, 1969).
[3] For a short survey of the Lisbon process see European Commission Report (2005a) and also http://www.euractiv.com/Article?tcmuri=tcm:29-117510-16&type=LinksDossier
[4] http://epp.eurostat.cec.eu.int/portal/page?_pageid=1133,1403427,1133_1403432&_dad=portal&_ schema =PORTAL
[5] For recent surveys on the literature on the use of composite indices in different development research context see also Archibugi and Coco (2004), Grupp and Mogee (2004), Heshmati (2003) and Andersen and Herbertsson (2003).
[6] See also Andersen and Herbertsson (2003).
[7] "The European Commission tacitly admitted yesterday that plans agreed on at the European Union's Lisbon summit five years ago to overtake the United States by 2010 as the world's best-performing economy have been unsuccessful. Instead, the gap in the economies of the EU and the United States continues to grow, it admitted. The president of the European Commission, Jose Manuel Barroso, has unveiled a more modest blueprint that seeks to boost economic growth and job creation through an emphasis on innovation and a better business climate." (Radio Free Europe/Radio Liberty at http://www.rferl.org/featuresarticle/2005/02/9d6b0dc8-95de-4584-ac9d-dbfc08932d27.html)
[8] But Liechtenstein appears, all of a sudden, in the Table on greenhouse gas emissions, without serving as a comparison country anywhere else.
[9] For a brief and readily available introduction, this article might suffice: http://en.wikipedia.org/ wiki/Factor_analysis, as well as Clauss and Ebner (1978). For a more thorough treatment of the subject, see the classical presentations of this methodology by Kim and Mueller (1978a, 1978b); Ueberla (1968). For an advanced treatment of factor analysis, see Jackson and Borgatta (1981).
[10] Our version is SPSS version 14, August 2007.
[11] For the social policy makers, it would be important to base their calculations of poverty in Europe on European-wide poverty rates, an exercise, already performed by colleague Tony Fahey (2005) from Ireland.