Relationship Between Genome Size and Organismal Complexity in the Lineage Leading from Prokaryotes to Mammals

Almanac: History & Mathematics:Big History Aspects
Abstract
The lack of a strict relationship between genome size and organismal complexity (level of organization) is largely due to size variability of the facultative part of the genome. However, there is a direct relationship between the level of organization and the minimal genome size (MGS) in the lineage leading from prokaryotes to mammals, in which the tendency towards increasing complexity is especially clear. The dynamics of MGS in this lineage can be adequately described by the model of hyperexponential growth. This implies the existence of nonlinear positive feedbacks that account for the acceleration of MGS growth. The nature of these feedbacks is discussed, including the formation of new genes by means of recombination of the fragments of existing genes, formation of ‘niches’ for new genes in the course of evolution of gene networks, and the expansion of regulatory regions. Hyperexponential growth of different variables related to the level of organization of the biosphere and society (biodiversity, MGS, size and complexity of organisms, world population, technological development, urbanization, etc.) suggests that the evolution of the biosphere and humanity in the direction of increasing complexity is a self-accelerating (autocatalytic) process.
Keywords: genome size, evolution, level of organization, complexity.
The problem of a possible connection between genome size and level of morphophysiological organization (complexity) of organisms has been a focus of attention of biologists for a while. A hypothesis of a positive correlation existing between these parameters seems logical because it appears that to create more complex organisms in the course of ontogeny a larger ‘developmental program’ should be necessary. However, until very recently no strict correlation of this kind could be revealed (Gregory 2005). Attempts to reveal regular growth of a genome in isolated evolutionary lineages were usually unsuccessful (Thomas 1971; Gregory and Hebert 1999; Gregory 2005, 2008). On the other hand, the size of a genome was noted to considerably increase over the transition from prokaryotes to eukaryotes and from unicellular eukaryotes to multicellular eukaryotes. There are also indications of the existence of a positive relationship between the size of unique genome sequences and level of organization. In addition there is general growth of the genome in the most ‘progressive’ evolutionary lineage leading from prokaryotes to mammals (this lineage most clearly shows the trend toward morphophysiological progress) (Raff and Kaufman 1986; Patthy 1999; Sharov 2006). This paper aims at the analysis of the relationship between the genome and organismal complexity in this evolutionary lineage. The minimal genome size (MGS) within a large taxon was used as a measure of genome complexity. It is shown below that this evolutionary lineage displays an increase of MGS, which is adequately described by a biexponential variety of the model of hyperexponential growth. Previously models of hyperexponential (primarily hyperbolic) growth have been successfully used to describe the dynamics of some demographic and macrosociological parameters (population, levels of technological and economic development, urbanization, literacy, etc.) (Korotayev, Komarova, and Khaltourina 2007; Korotayev, Malkov, and Khaltourina 2006, 2007; Grinin and Korotayev 2009). In addition, it has been shown that the hyperbolic model can be used to describe the dynamics of taxonomic diversity of the Phanerozoic biota (Markov and Korotayev 2008, 2009). The hyperexponential growth usually suggests the presence of complex nonlinear positive feedback facilitating growth acceleration of a parameter under consideration.
Minimal Genome Size as a Measure of Necessary (Nonredundant) Amount of Genetic Information
We consider minimal (as opposed to mean, or maximum) genome size in each group because genomes of most organisms are known to contain a large amount of so-called ‘junk DNA’, for which no function has yet been identified. This amount may greatly vary even within a class or order. The amount of ‘junk DNA’ is largely determined by factors not directly linked to life and adaptations of an organism. A large amount of ‘junk DNA’ consists of mobile genetic elements (MGE). For instance, mobile elements compose roughly 50 % of primate genomes (Xing et al. 2007). Presence of ‘extra’ DNA in the genome places an additional load on the organism, which has to use more resources for its replication; the genome size may influence the cell size, rates of replication and cell division, etc. (Gregory 2005; Gregory and Hebert 1999). While there is a conventional hypothesis on the redundancy of MGE, introns and other non-coding sections, MGE are sources of genetic variability, while fragments of these selfish elements are actually dynamic reservoirs for new cellular functions (‘domesticated elements’) (Miller et al. 1999; Volff 2006). MGE are shown to play a significant role in the evolution of eukaryotes including evolution towards increased complexity (Bowen and Jordan 2002; Muotri et al. 2007).
A dynamic equilibrium between the trends toward longer and shorter ‘junk DNA’ sections is established in the course of evolution. The former trend results from spontaneous self-duplication of MGE, while the latter – from deletions (Gregory 2004b). MGE loss is generally advantageous because of the economy of resources used for synthesis and upkeep of ‘extra DNA’ in each cell. If one of two trends prevails, the genome ‘inflates’ or ‘shrinks’. The prevalence of the first trend can be related to the appearance of a new form of MGE with a higher replication rate or with loosening of cellular systems of MGE control. The second trend may prevail if the loss of extra fragments gives a significant adaptive advantage. A typical example is the advantage of having a reduced genome in birds and bats compared to flightless tetrapods, because of the reduced body weight. ‘Extra’ DNA is present in each cell and its upkeep and replication requires numerous ‘extra’ proteins, which results in positive correlation between the genome size and cell size (Organ et al. 2007). Therefore, selection favored loss of ‘junk DNA’ in flying vertebrates, which led to the reduction in genome size (Hughes and Hughes 1995). It is noteworthy that neither increased complexity, nor increased genome size are uniform evolutionary tendencies. For instance, the evolution of prokaryotes is dominated by a reduction in genome size rather than by its increase (Ochman 2005). A similar pattern was apparently present in the evolution of Saurischia and birds (Organ et al. 2007). The physiology of a particular organism may affect the genome size. For instance, in prokaryotes, with their imperfect systems of DNA repair and distribution (absence of mitosis), the genome cannot grow beyond some maximum limit (Sharov 2006): the maximum genome size in bacteria is 13.03 Mb (Sorangium cellulosum), in archaea 5.75 Mb (Methanosarcina acetivorans).[1] Genome growth in prokaryotes may be restricted by large population size, which slows down genetic drift (Lynch and Conery 2003). On the other hand, the existing level of complexity of an organism suggests that the genome cannot be reduced below a particular minimum level. We suggest that MGS in a large group of organisms can be used for an approximation of the amount of essential (non-redundant) genetic information necessary for the existence of representatives of a taxon under consideration. A more precise proxy is difficult to obtain because there is no reliable means to differentiate genuinely redundant sections in DNA from functional ones (e.g., from non-coding sequences performing regulatory functions).
Materials and Methods
We compared MGS in nine successive groups of organisms that ‘nest one inside the other’ (see Table 1). The succession of groups corresponds to the evolutionary lineage from the earliest prokaryotes to mammals. The choice of an organism with minimal genome in each group was made without taking into account intracellular symbionts and parasites, which are often subjected to genetic simplification and to some extent lose the right to be called independent organisms (see e.g., Nakabachi et al. 2006). Intracellular symbionts exploit the host organism's genes instead of their own lost genes, allowing them to survive without many genes which are absolutely essential for free-living organisms in the same group. Genes of symbionts can be transferred to the host organism's genome where they continue functioning to the mutual benefit of the symbiont and the host (as happened in the symbiosis of early eukaryotes with the future mitochondria and plastids) (Stegemann et al. 2003; Markov and Kulikov 2005).
Each of the successive groups under consideration is a subset of the previous one, and is the subset within which organisms achieved the highest level of complexity. It is characteristic that within each group, the smallest genome size was recorded for those members of the group, which were not included in the subsequent subset. For instance, group 6 (tetrapods), the smallest genome, is characteristic for a representative of amphibians, i.e., lower tetrapods, rather than for some members of a higher subset 7 (amniotes), although amniotes are included in tetrapods. This alone shows that a correlation exists between MGS and organismal complexity.
Table 1. Minimal (nonredundant) genome size (MGS) in nine nested groups of organisms
|
Group |
MGS (Mb) |
Approximate time of |
Species with the smallest genome |
|
1. All living |
1.3 |
4000 |
Marine free-living bacterium Pelagibacter ubique, strain HTCC1062 |
|
2. Eukaryotes |
9.2 |
2000 |
The sac fungus Ashbya gossypii with the smallest genome among free-living eukaryotes |
|
3. Animals (Metazoa) |
19.6 |
1250 |
Nematode Pratylenchus coffeae |
|
4. Chordates |
68.6 |
575 |
Oikopleura dioica appendicularium, representing the subphylum Tunicata in the phylum Chordata |
|
5. Vertebrates |
342 |
540 |
Bony fish Tetraodon fluviatilis |
|
6. Tetrapods |
931 |
375 |
Frog Limnodynastes ornatus |
|
7. Amniotes |
951 |
315 |
Pheasant Phasianus colchicus |
|
8. Mammals |
1695 |
220 |
Bat Miniopterus schreibersi |
|
9. Primates |
2215 |
65 |
Collared Titi monkey Callicebus torquatus |
Note: Data on the size of the minimal genomes in groups are based on the following sources: Pellicciari et al. 1982; Gregory 2004a, 2008; Dietrich et al. 2004; Complete … 2008; Eukaryotic genome sequencing projects 2008. Approximate dating of the appearance of groups is based on the molecular and paleontological data from: Marshall and Schultze 1992; Shu et al. 1999; Heges and Kumar 2003; Battistuzzi et al. 2004; Fedonkin 2006; Falcon-Lang et al. 2007. Some data suggest earlier appearance of eukaryotes, probably 2.7 Ga (Rozanov 2003), although one of the most important facts indicating this (presence of eukaryotic biomarkers in the Archean rocks) was recently questioned by Rasmussen et al. (2008). Therefore, we use a more conservative estimate of 2 Ga, agreed among most authors, and supported by molecular data.
We had to exclude some intermediate levels which lack reliable data. Following the logic used above, it was possible to place an intermediate group of gnathostomes between subset 5 (vertebrates) and 6 (tetrapods). This was not done because of the insufficient data on agnathans, i.e., the vertebrates that are not included in gnathostomes. Agnathans were diverse in the Paleozoic, but in the recent biota they are represented by only two highly specialized groups – lampreys and hagfishes, among which species with small genomes have not been yet identified (Gregory 2008). However, this does not necessarily mean that in Paleozoic agnathans genomes were as large as in extant lampreys and hagfishes (based on data presented in this paper, we suggest that this was not the case). Nevertheless, it has to be acknowledged that taking into account such relicts or poorly studied groups could to some extent obscure patterns discussed in this paper. One important question that inevitably emerges in any study using regression analysis is the selection of adequate models. An oversimplified model may occasionally not reveal essential details in patterns studied, whereas an overcomplicated model may accidentally focus on a background constituent of the experimental data (noise). Taking this into consideration we studied two classes of models: biparametric and triparametric ones. Biparametric models are generally more reliable and less affected by measurement errors, whereas triparametric models are more informative (when the given data are sufficiently precise).
We studied two families of biparametric models: exponential and hyperbolic. The exponential models can be generalized as: L = Ae(–BT), where L – MGS of a taxon (in Mb); A, B are adjustment parameters, T – time from a supposed appearance of a taxon (in Myr). Hyperbolic models are described as L = A/(B + T). Because the value of L in the lineage from prokaryotes to mammals changes by more than three orders of magnitude, the use of logarithmic scale is reasonable (we used natural logarithms of MGS). We have also considered three families of triparametric models: power exponential, power hyperbolic, and biexponential. The power exponential model is described by a formula L = Ae(–ВТN), where N is the third adjustment parameter. The power hyperbolic model is described by a generalized formula L = A/(B + T)N. The biexponential model is described as L = CeAe(–ВТ), where the third parameter is the coefficient C. Optimal parameters of the models were chosen directly by selection of numbers using the least square method.
Table 2. Data previously used to substantiate the exponential growth of nonredundant genome size
|
Group |
Nonredundant |
Time of appearance |
|
1. Prokaryotes |
0.5 |
3500 |
|
2. Eukaryotes |
2.9 |
2000 |
|
3. Worms |
72.8 |
1000 |
|
4. Fishes |
133.3 |
500 |
|
5. Mammals |
480 |
125 |
Source: Sharov 2006.
Results
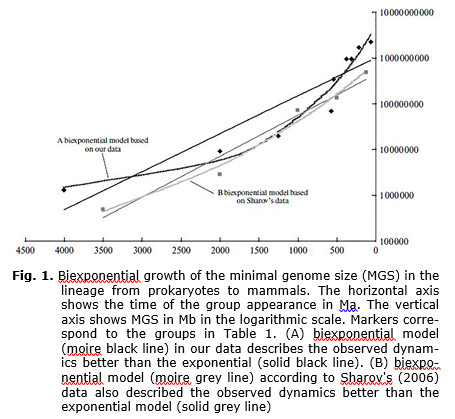
Of the biparametric models considered, the given data (Plate 1) are best described by an exponential model with values of parameters A = 1.002 × 10⁹, B = 0.00191; the Pearson's correlation coefficient is relatively high (R2 = 0.914). Of triparametric models the best fitted is a biexponential model with the values: A = 8.41, B = 7.98 × 10⁻⁴, C = 1.069 × 10⁸. The correlation with the observed data is higher than for a simple exponential model (R2 = 0.979) (which is understandable because triparametric models generally allow a more precise approximation of the existing data than the biparametric models). As a control, the parameters of the exponential and biexponential models were calculated based on Sharov's data (Sharov 2006; Table 2; see Discussion). For the exponential model the following optimal values of parameters were calculated: A = 4.37 × 10⁸, B = 0.00206, for biexponential: A = 11.75, B = 2.88 × 10⁻⁴, and C = 6.077 × 10³. Note that Sharov, using an exponential model, obtained similar results.
The MGS growth dynamics in the evolutionary lineage considered is shown in Fig. 1 (black diamonds). Sharov's data are shown as grey squares. Graphs corresponding to optimal biparametric models are shown by solid lines, black (our data) or grey (Sharov's data), whereas curves corresponding to triparametric models as moire black strips (for our data) and grey (for Sharov's data) lines.
Discussion
Exponential or hyperexponential growth?
The analysis of size dynamics of a ‘non-redundant’ genome in a given evolutionary lineage (Sharov 2006) leads to a conclusion that this parameter grows exponentially. Our analysis partly repeats Sharov's work; however, we estimate the essential genome size differently and also use more detailed data. Sharov built his exponential graph based on five points that in their biological sense correspond to groups 1, 2, 3, 5, and 8 considered herein (see Tables 1, 2). Why, then, did Sharov suggest exponential growth, while we more or less confidently suggest more accelerated, hyperexponential growth? This is firstly because Sharov's paper did not consider any other models except for exponential, and secondly because of different methods for estimating the non-redundant genome. For groups 1 and 2 Sharov used genome size of parasitic microorganisms, whereas we use minimal genomes of free-living species. However, these differences do not much influence the correlation of data with either exponential or biexponential models. The essential genome size in group 3, according to Sharov, is 72.8 (this is the genome size of the nematode Caenorhabditis elegans excluding 25 % that are supposedly non-functional). Our estimate (19.6) is more realistic, because this is the genome size of another nematode (Pratylenchus coffeae). Obviously, the genome of C. elegans, even excluding ‘nonfunctional’ regions, has many regions that are absent in other round worms. For fish and mammals, Sharov's estimates are lower than ours because Sharov did not consider those parts of genome that are supposedly non-functional (65 % of the fish genome and 85 % of the mammal genome). However, criteria used by Sharov to estimate the size of the ‘nonfunctional’ genome regions apparently do not take into account that many noncoding regions, with function as yet unidentified, may perform important regulatory functions, or code functional RNA. For instance, in mammal genomes many regions previously considered as nonfunctional are transcribed. In addition, these regions have recently been found to contain a whole class of previously unknown genes coding large RNA molecules with regulatory functions (Guttman et al. 2009). There are many indications of a very important role of MGE in eukaryote evolution, including evolution towards increased complexity (Miller et al. 1999; Bowen and Jordan 2002; Muotri et al. 2007). In our opinion, the adequate interpretation of the minimal necessary genome in vertebrates can be obtained from organisms in which a decrease in genome size has adaptive signifycance. Apparently flying vertebrates (birds and bats) can provide this evidence (Hughes A. and Hughes M. 1995; Organ et al. 2007). We considered their genomes as ‘minimally necessary’ for groups 7 (amniotes) and 8 (mammals). Sharov's data also differ from ours because, according to Sharov, mammals appeared ca. 125 Ma (Early Cretaceous). We cannot agree with this estimate because mammals are known as early as the Late Triassic (ca. 220 Ma), whereas 125 Ma is the time of the earliest find of placental mammals (Ji et al. 2002).
Comparison of our Biparametric Model with Sharov's Results
Despite the above disparities of the initial data, the slopes of the exponential lines on the resulting logarithmic graph (Fig. 1) are very similar. This indirectly supports the adequacy of rough estimates given by exponential models. Simpler biparametric models apparently give rougher local estimates, but global estimates obtained that way are more reliable. Therefore, it is possible that estimates of the appearance of life in the Universe (at least 7 Ga) obtained by Sharov from extrapolation of models into the past, can be considered rather seriously (but only if such extrapolation itself is assumed to be reliable).
The absence of a direct correlation between organismal complexity and genome size is well substantiated. For instance, unicellular eukaryotes include taxa with a genome that exceeds all studied genomes of multicellular animals. Amphibians include species with genomes larger than in mammals, etc. (Thomas 1971; Gregory and Hebert 1999; Gregory 2005). Some reasons for high variability of genome size are mentioned above. However, in the evolutionary lineage from prokaryotes to mammals, in which the trend toward increased complexity was the strongest, positive correlation between the nonredundant genome size and organismal complexity is clearly displayed (Patthy 1999; Sharov 2006). This agrees with theoretically expected results based on an interpretation of genome as a ‘program’ of the development and function of an organism. It is natural to expect that more complex organisms would have a more complex and hence larger ‘program’. For instance, it has been proposed that the size of the functional nonredundant regions of the genome can be considered as a measure of the biological complexity of organisms (Adami, Ofria, and Collier 2000). We think that MGS within a large group of organisms is a good approximation to the size of the nonredundant genome, which is difficult to calculate. Thus, the hypothesis of relationships between MGS and organismal complexity does not contradict conventional wisdom.
Vendian – Cambrian Acceleration of MGS Growth
Despite a generally good approximation of the MGS dynamics from the biexponential formula, the graph shows a considerable discrepancy between the observed data and the approximating curve in the latest Proterozoic (Vendian) and Cambrian. A sharp acceleration of MGS growth in the Vendian – Cambrian coincides with the adaptive radiation of Metazoa (Vendian – Cambrian explosion). This time apparently corresponds to the appearance of the first chordates (point 4 on the graph), and then vertebrates (point 5). The most obvious reason for the sharp increase in MGS growth at the time of the appearance of vertebrates is the occurrence of two whole-genome duplications; this was a key event in the early evolution of the vertebrates (Putnam et al. 2008).
It should be taken into account that in the period under consideration the biosphere underwent a fundamental restructuring. A sharp increase in MGS, perhaps, reflects the transition of MGS from one stable (exponential?) growth trajectory to another, which could be to some extent a consequence (or demonstration) of this global change. Study of complex systems with nonlinear positive feedbacks developing over a large time scale hyperexponentially (and hyperbolically) shows that in many cases such global evolutionary motion of a system when studied at a smaller scale becomes fragmented into a number of stages separated by phase transitions, the succession of which forms large-scale hyperexponential dynamics. A system usually has so-called ‘attractors’, near which it exists in the condition of a local optimum and can persist in this way for a long time until the external pressure or changes gradually accumulating in it push the system away from the attractor. After that, the system again evolves rapidly until after the next phase transition it is trapped by the next attractor. Recent papers (Korotayev 2006, 2007; Korotayev and Grinin 2007; Korotayev, Komarova, and Khaltourina 2007a; Korotayev, Malkov, and Khaltourina 2007b; Grinin and Korotayev 2007, 2009) give examples of similar behavior in the social World System, which was until very recently evolving towards the hyperexponential (including hyperbolic) growth in its basic macrosociological parameters (size of populations, levels of technical, economic, and sociocultural development, degree of urbanization and political complexity, etc.). It can be suggested that the sharp change in the MGS dynamics in the Vendian–Cambrian might have resulted from the fact that the system (biosphere) at that time was leaving its then attractor (the world of prokaryotes and unicellular eukaryotes) and beginning to transform in a process of phase transition into the world of multicellular organisms. Interestingly, at the end of the Proterozoic – beginning of the Paleozoic, the maximum size of living organisms sharply increased (by many orders of magnitude), which is related, among other things, to the sharp growth in the concentration of free oxygen (Payne et al. 2009). We mentioned above that a positive correlation can be traced between the size of an organism and genome size.
Positive Feedback Providing Hyperexponential MGS Growth
Similar to the human population dynamics and other macrosociological parameters, and the biodiversity dynamics (Markov and Korotayev 2009), the hyperexponential genome growth is supposedly provided by complex positive feedbacks. The hypothesis that the genome growth in evolution was governed by positive feedbacks is discussed by Sharov (2006), who has suggested the following mechanisms of genome growth based on positive feedback:
1) A genome can be considered as an assemblage of symbiotic self-replicating elements, or as a hypercycle (Eigen and Schuster 1977). For instance, the gene responsible for higher precision of DNA replication facilitates more precise copying of all other genes in the cell, and this advantage involves not only genes that are already present, but also those that will appear in the future. Thus, already existing genes can facilitate the invasion and affixation of new genes into the genome.
2) New genes are often produced by duplication or recombination of already existing genes. Therefore, a large genome represents more initial material for the formation of new genes.
3) Large genomes support a higher diversity of metabolic networks and morphological elements and thus provide more potential niches for new genes (Sharov 2006).
To understand which of the supposed positive feedbacks can provide hyperexponential MGS growth, they should be discussed in greater detail. Firstly, the exponential model corresponds to cases when the variable under consideration grows with a rate proportional to the variable's value (dL/dT ~ L), whereas in biexponential models the growth is proportional to its current value multiplied by its logarithm (dL/dT ~ Lln(L)). The presence of the second factor determines the hyperexponential growth of the parameter under consideration. Even greater acceleration of the variable's growth is observed in another kind of hyperexponential dynamics, i.e., hyperbolic growth. In that case the variable's growth rate is proportional to the square of its value: dL/dT ~ L2 (the solution of this differential equation is a hyperbolic function, see e.g., Kapitsa 1992, 1999; Korotayev 2006: 119–120). Note that the biexponential dynamics is an intermediate between the exponential and hyperbolic dynamics.
The analysis of existing data on the mechanisms of genome growth suggests that some positive feedbacks governing MGS growth could, with the course of time, give rise to exponential dynamics, while others could result in the hyperbolic dynamics, whereas their joint action leads to the intermediate result, i.e., biexponential dynamics. Let us consider duplication of the DNA fragments, as one of the major mechanisms of genome growth. In the simplest case it can be assumed that the probability of duplication of a DNA fragment of fixed length is a constant value. Because the number of such fragments is proportional to the genome length, its growth rate due to random duplications should also be proportional to its length. With the course of time, this should lead to exponential genome growth. However, the triparametric model indicates a considerable deviation from the exponential law, especially after the appearance of the metazoans. Hyperexponential growth can be related to the formation of new functional (coding and regulatory) regions of DNA based on the combinatory principle. New genes are often formed due to recombination of fragments of existing genes (Patthy 1999). It is easy to demonstrate that the number of potentially possible new combinations of fragments (i.e., new genes that can potentially be formed in such way) is approximately proportional to the squared number of existing genes. In an idealized situation each gene consists of two domains (functional blocks); new genes are formed by merging of copies of two domains, originating from two different genes. In this situation, each pair of genes can potentially give rise to four new genes (if the order of the domain arrangement in a new gene is not taken into account). Hence, the total number of potentially possible new genes can be calculated as 2(N2 – N), where N is the number of genes in a genome. Considering that genomes of free-living organisms contain quite a high number of genes (from thousands to tens of thousands), the formula can be simplified as 2(N2 – N) ≈ 2N2. Assuming that the growth rate of the number of genes is proportional to the number of potentially possible new genes, we obtain the following expression: dN/dt = kN2, which corresponds to the hyperbolic growth of the number of genes. A similar deduction can also be applied to noncoding regulatory sequences, which apparently can also be formed by recombination of fragments of existing regulatory sequences. As noted above, the combined action of factors, some of which facilitate exponential, and some hyperbolic MGS growth, can lead to an intermediate kind of dynamics, for example, biexponential growth. It is important that the above mechanism of formation of new genes by recombination of domains (or exons) of old genes is found in Metazoa much more often than in other organisms. Most new genes of animals that formed in such a way (i.e., module, multidomain genes), appeared early in the evolution of Metazoa (Ibid.), which coincides with the period of sharp acceleration of MGS growth at the end of the Neoproterozoic – beginning of Paleozoic. It is noted that most of these genes are related to specific features of animals such as cell and tissue differentiation, intercellular interactions, and other aspects of function of a metazoan animal organism as an entity. In other words, these genes are directly related to coding of organismal complexity in Metazoa (Patthy 1999). The predominance of this mechanism capable to provide hyperexponential genome growth in animals (as opposed to other multicellular organisms) explains rather well why this growth type is distinctly recognized in the evolutionary lineage considered. The hyperexponential MGS growth may also be connected with patterns of the evolution of gene networks (Kolchanov et al. 2000; Kolchanov, Suslov, and Shumnyi 2003; Kolchanov, Suslov, and Gunbin 2004). According to the principle of combinatory coding of complexity, the increase in complexity of gene networks proceeds not only due to the increase of the number of genes involved in their work but also through the increased complexity of mechanism of their interactions (mutual regulation). Evidently, the potential number of intergene interactions, direct or indirect, should grow proportionally to the number genes squared (because potentially any gene can interact with any other gene in the genome). Regulatory regions of DNA (various enhancers containing binding sites of transcriptional regulators) are used to perform intergene interactions. It is known that the increased complexity of metazoans is largely provided by the appearance of new regulatory sequences (Mikkelsen et al. 2007). Thus, growth in the number of genes should create new niches for regulatory sequences, and the number of niches should grow proportionally to the number of genes squared. The picture will become more complicated if it is taken into account that the regulatory sequences themselves can interact with each other, for example, due to competition for the same regulatory proteins, and the same gene may be regulated by the coordinated work of the entire complex of various regulatory sequences and transcription factors (Kolchanov et al. 2000; Takahashi et al. 2008). It is important that new regulatory sequences often appear by ‘domestication’ of MGE, which thus are effectively transformed from ‘junk DNA’ to functionally important genome components (Miller et al. 1999; Mikkelsen et al. 2007). More so, new regulatory proteins (transcription factors) can also be formed by domestication of MGE genes (Lin et al. 2007). This mechanism of growth of the functional regions of the genome due to the transformation of ‘junk DNA’ into functional DNA, apparently should lead to a situation when growth of nonfunctional regions of the genome in a long term should facilitate the acceleration of MGS growth.
Note that organism size growth (partly co-ordinated to MGS growth) leads to reduction in population size and hence to an increase in genetic drift (i.e., to higher probability of random fixation of neutral and slightly harmful genetic changes). Therefore, new copies of reproducing MGE have more chance of being fixed in a small population than in a large one. This can lead to passive growth of ‘junk’ regions of the genome in organisms with small populations, for which large size and large genomes are characteristic (Lynch and Conery 2003). This is partly supported by the well-known fact that as the genome's (and organism's) size grows, the proportion of noncoding regions grows as well. For instance, in the prokaryotes to mammals lineage considered, the genome size grows approximately by three orders of magnitude (from a few million to a few billion Mb), whereas the number of protein-coding genes increases only by one order of magnitude (from a few thousand to a few tens of thou-sands). On the other hand, it is known that the genome of complex organisms contains many functional non-coding regions, which play an important role in the evolution of complexity (Miller et al. 1999; Bowen and Jordan 2002; Volff 2006; Mikkelsen et al. 2007; Muotri et al. 2007). In other words, an increase in the complexity and size of organisms can lead to an increase in both ‘junk’ and functional noncoding regions.
Apparently, an increase in complexity in organisms can precede the genome growth and stimulate it due to the mechanism of ‘escape from adaptive conflict’ during duplication of genes. As complexity increases, many genes can acquire additional functions, i.e., becoming multifunctional. Such genes are in a state of adaptive conflict: selection cannot efficiently optimize them to perform one of the functions because that would result in the reduction in efficiency of other functions performed by the gene. New gene copies which appeared as a result of gene duplications can specialize to perform various functions. This considerably lowers the probability that the new copies that appeared as a result of duplications will be redundant and will be lost (Des Marais and Rausher 2008). This mechanism played an important role in the early evolution of vertebrates, when after two whole-genome duplications, many newly formed extra gene copies remained in descendants and acquired new functions (Putnam et al. 2008). It is possible to assume the connection between the increase in biodiversity and genome size in the most highly organized representatives of the biota. Growth of biodiversity leads to increased complexity and heterogeneity of the biotic environment. This creates predisposition to the development of complex adaptations and hence, complex organisms. Increased complexity of organisms in turn facilitates further genome growth. Computer simulations have shown that in organisms evolving in an ‘information-rich’ (complex and heterogenous) environment, the genome grows because it embraces information about the environment and of how to function most efficiently in this environment. In contrast, in organisms evolving in an information-impoverished environment the genome size decreases (Adami et al. 2000; Ofria, Adami, and Collier 2003).
It is noteworthy that the dynamics of the hyperexponential growth of biodiversity and MGS in the lineage from prokaryotes to mammals are essentially different. In the former, a period of explosive growth occurs in the last 100–150 Ma (Late Mesozoic – Cenozoic). The first signs of the beginning of the end of the blow-up regime are recorded for the second half of the Cenozoic (Markov and Korotayev 2009). In the MGS dynamics, the period of explosive growth corresponds to the Paleozoic and essentially finished in the Triassic with the entry of mammals. Thus, the MGS growth dynamics shows the end of the regime with hyperexponential acceleration as early as the beginning – middle of the Mesozoic, 100–200 Myr earlier than in biodiversity growth. It is possible that genome growth to some extent contributed toward biodiversity growth by creating additional levels of freedom for genetic transformations (although it is necessary to remember that the explosive diversity growth in the Mesozoic and Cenozoic occurred mainly due to comparatively simply organized animals, such as mollusks and insects, and to a lesser extent due to teleosts, birds, and mammals).
The morphological complexity of organisms in the lineage under consideration probably also grew at least exponentially (or even hyperexponentially), although it is difficult to check because of the absence of reliable estimates of the level of morphological complexity in the groups considered.
The decrease in the MGS growth rate after the appearance of mammals does not mean that the increase of complexity slowed down to the same extent. If the phenotype is understood in the wide sense, including not only morphology but also behavior, and extrasomatic adaptations (beaver dams, bird nests, etc.) (Dawkins 1982), it becomes apparent that the phenotype complexity growth rate did not slow down in the Mesozoic and Cenozoic. Growth of encephalization quotients of mammals in the Cenozoic was accompanied by an increase in ability to learn and increased complexity of behavior (including social behavior). More so, this increase gradually created a basis for biological evolution to transform into cultural and social evolution (Grinin, Markov, and Korotayev 2008). These phenomena can be considered as stages of one accelerating global process of extraction of information from the environment by the biota and its preservation on an ‘external carrier’. DNA initially worked as such a carrier, but after the appearance of the more efficient means of processing, transmission and storage of information in a complex nervous system (particularly the mammalian brain with a developed neocortex), and then speech and writing, the evolutionary pressure towards the increase of the informational capacity of the genome apparently weakened. Although the subsequent progressive changes were not accompanied by an accelerated MGS growth, some of them apparently required the development of more complex mechanisms of gene regulation (Mikkelsen et al. 2007).
Alternative splicing, a process of editing of matrix RNA molecules through which a cell can synthesize more than one different protein based on the same gene is an example of a mechanism allowing an increase in the ‘useful’ complexity and informational capacity of the genome without increasing its size. It has been shown that about 94 % of human genes undergo alternative splicing, whereas in lower animals alternative splicing is found in the minority of genes (e.g., about 15 % in C. elegans) (Wang et al. 2008; Pan et al. 2008). This discovery answers the intriguing question of why the human genome contains approximately the same number of genes as a much less complexly organized worm C. elegans (about 20,000). It has been shown that the diversity of proteins in the human organism is in fact (as would be expected) much higher than in the worm, although this diversity is achieved not by genome growth, but by the development of alternative splicing.
The existing data on mechanisms and rates of genome growth are still insufficient to build adequate mathematical models of this process. The main difficulty is the absence of rigid quantitative evaluations of the relative contribution of different mechanisms of genome growth in the total dynamics of this growth.
The discussion of possible extrapolation of the model curves onto the past has remained beyond the scope of this paper. The results of such a procedure were interpreted by Sharov (2006) as evidence of the extraterrestrial origin of life. The validity and methods of such extrapolation and the conclusions that can be made based on it require detailed discussion, which will be presented in a separate paper. Here we shall only note that there are arguments both ‘for’ and ‘against’ the hypothesis that the sharp discontinuity of the curve in the left side of the model graph (see Fig. 1), i.e., at the time of the supposed appearance of the prokaryotic cell, can be used as an argument supporting the hypothesis of extraterrestrial abiogenesis.
Conclusions
In the evolution of the biosphere, as in the evolution of society, some parameters reflecting the general level of the development or complexity of the system changed in time in accordance with the hyperexponential (and often hyperbolic) mode. In the biosphere such parameters include biodiversity and nonredundant genome size in the most complex organisms, and also apparently maximum size of organisms and maximum level of complexity of their organization. The hyperexponential growth of these parameters suggests that the evolution of the biosphere towards general increased complexity, like social and cultural evolution of mankind, is regulated by nonlinear positive feedback and is a self-accelerating process. In other words it is possible that complexity itself is the reason for the progressive increase in complexity of biological and social systems.
Acknowledgments
The authors are grateful to A. D. Panov, A. S. Rautian, and A. A. Fomin for discussion of ideas considered in this paper and valuable recommendations.
References
Adami C., Ofria C., and Collier T. C. 2000. Evolution of Biological Complexity. Proceedings of the National Academy of Sciences 97(9): 4463–4468.
Battistuzzi F. U., Feijao A., and Hedges S. B. 2004. A Genomic Timescale of Prokaryote Evolution: Insights into the Origin of Methanogenesis, Phototrophy, and the Colonization of Land. BMC Evolutionary Biology 4: 44.
Bowen N. J., and Jordan I. K. 2002. Transposable Elements and the Evolution of Eukaryotic Complexity. Current Issues in Molecular Biology 4(3): 65–76.
Complete Microbial Genomes. 2008. URL: http: www.ncbi.nlm.nih.gov/genomes/ lproks.cgi. Date accessed: 11.10.2008.
Dawkins R. 1982. The Extended Phenotype: The Long Reach of the Gene. Oxford: Oxford University Press.
Dietrich F. S., Voegeli S., Brachat S. et al. 2004. The Ashbya gossypii Genome as a Tool for Mapping the Ancient Saccharomyces cerevisiae Genome. Science 304(5668): 304–307.
Eigen M., and Schuster P. 1977. The Hypercycle. A Principle of Natural Self-Organization. Part A: Emergence of the Hypercycle. Naturwissenschaften 64(11): 541–565.
Eukaryotic Genome Sequencing Projects. 2008. URL: http: www.ncbi.nlm.nih.gov, genomes/leuks.cgi. Date accessed: 11.10.2008.
Falcon-Lang H. J., Benton M. J., and Stimson M. 2007. Ecology of Earliest Reptiles Inferred from Basal Pennsylvanian Trackways. Journal of the Geological Society 164(6): 1113–1118.
Fedonkin M. A. 2006. Two Records of Life: Experience of Comparison (Paleobiology and Genomics on the Early Stages of the Biosphere Evolution). Problems of Geology and Mineralogy / Ed. by A. M. Pystin, pp. 331–350. Syktyvkar: Geoprint. In Russian (Федонкин М. А. Две летописи жизни: опыт сопоставления (Палеобиология и геномика о ранних этапах эволюции биосферы). Проблемы геологии и минералогии / Ред. А. М. Пыстин, с. 331–350. Сыктывкар: Геопринт).
Gregory T. R. 2004а. Macroevolution, Hierarchy Theory, and the C-Value Enigma. Paleobiology 30(2): 179– 202.
Gregory T. R. 2004b. Insertion-Deletion Biases and the Evolution of Genome Size. Gene 324: 15–34.
Gregory T. R. 2005. The C-Value Enigma in Plants and Animals: A Review of Parallels and an Appeal for Partnership. Annals of Botany 95(1): 133–146.
Gregory T. R. 2008. Animal Genome Size Database. URL: http: www.genomesize. com.
Gregory T. R., and Hebert P. D. N. 1999. The Modulation of DNA Content: Proximate Causes and Ultimate Consequences. Genome Research 9(4): 317–324.
Grinin
L. E., and Korotayev A. V. 2007. The Political Development of
World-System: Formal and Quantitative Analysis. History and Mathematics: Macrohistorical Dynamics of the Society and
State / Ed. by S. Yu. Malkov, pp. 49–101. Moscow: KomKniga/URSS. In Russian (Гринин Л. Е., Коротаев А. В.
Политическое развитие Мир-Системы: формальный и количественный анализ. История и Математика: макроисторическая динамика общества и государства / Ред.
С. Ю. Малков, Л. Е. Гринин, А. В. Коротаев,
с. 49–101. М.: КомКнига).
Grinin L. E., and Korotayev A. V. 2009. Social Macroevolution: The Genesis and Transformations of the World System. Moscow: LIBROKOM/URSS. In Russian (Гринин Л. Е., Коротаев А. В. Социальная макроэволюция: Генезис и трансформации Мир-системы. М.: Либроком/УРСС).
Grinin L. E., Markov A. V., and Korotayev A. V. 2008. Macroevolution in Living Nature and Society. Moscow: LKI/URSS. In Russian (Гринин Л. Е., Марков А. В., Коротаев А. В. Макроэволюция в живой природе и обществе. М.: ЛКИ/УРСС).
Guttman M., Amit I., Garber M. et al. 2009. Chromatin Signature Reveals over a Thousand Highly Conserved Large Non-Coding RNAs in Mammals. Nature 458 (7235): 253–227.
Heges S. B., and Kumar S. 2003. Genomic Clocks and Evolutionary Timescales. Trends in Genetics 19(4): 200–206.
Hughes A. L., and Hughes M. K. 1995. Small Genomes for Better Flyers. Nature 377(6548): 391.
Ji Q., Luo Z.-X., Yuan C.-X. et al. 2002. The Earliest Known Eutherian Mammal. Nature 416(6883): 816–822.
Kapitsa S. P. 1992. A Mathematical Model of the World Population Growth. Matematicheskoye modelirovaniye 4(6): 65–79. In Russian (Капица С. П. Математическая модель роста народонаселения мира. Математическое моделирование 4(6): 65–79).
Kapitsa S. P. 1999. General Theory of the Growth of Humankind: How Many People Have Lived,
Live, and Are to Live on Earth. Moscow: Nauka. In Russian (Капи-
ца С. П. Общая теория роста человечества: Сколько людей жило, живет и будет жить
на Земле. М.: Наука).
Kolchanov N. A., Anan'ko E. A., Kolpakov F. A. et al. 2000. Gene Networks. Molecular Biology 34(4): 533–544, 449–460.
Kolchanov N. A., Suslov V. V., and Shumnyi V. K. 2003. Molecular Evolution of Genetic Systems. Paleontological Journal 6: 58–71; 37(6): 617–629.
Kolchanov N. A., Suslov V. V., and Gunbin K. V. 2004. Biological Evolution Simulation: Genetic Regulatory Systems and Biological Complexity Encoding. Vestnik VOGiS 8(2): 86–89.
Korotayev A. V. 2006. The World System History Periodization and Mathematical Models of Socio-Historical Processes. History and Mathematics: The Problems of Periodization of Historical Macroprocesses / Ed. by L. E. Grinin, A. V. Korotayev, and S. Yu. Malkov, pp. 116–167. Moscow: KomKniga/URSS. In Russian (Коротаев А. В. Периодизация мировой системы и математические модели социально-исторических процессов. История и математика: проблемы периодизации исторических макропроцессов / Ред. Л. Е. Гринин, А. В. Коротаев, С. Ю. Малков, с. 116–167. М.: КомКнига / URSS).
Korotayev A. V. 2007. The World System Urbanization Macrodynamics: A Quantitative Analysis. History and Mathematics: Macrohistorical Dynamics of the Society and State / Ed. by S. Yu. Malkov, L. E. Grinin, and A.V. Korotayev, pp. 21–39. Moscow: KomKniga/URSS. In Russian (Коротаев А. В. Макродинамика урбанизации Мир-системы: количественный анализ. История и математика: макроисторическая динамика общества и государства / Ред. С. Ю. Малков, Л. Гринин, А. В. Коротаев, с. 21–39. М.: КомКнига / УРСС).
Korotayev A. V., and Grinin L. E. 2007. Urbanization and Political Development of the World System: Comparative Quantitative Analysis. History and Mathematics: Macrohistorical Dynamics of the Society and State / Ed. by S. Yu. Malkov, L. E. Grinin, and A. V. Korotayev, pp. 102–141. Moscow: KomKniga/URSS. In Russian (Коротаев А. В., Гринин Л. Е. Урбанизация и политическое развитие Мир-Системы: сравнительный количественный анализ. История и математика: Макроисторическая динамика общества и государства / Ред. С. Ю. Малков, Л. Е. Гринин, А. В. Коротаев, с. 102–141. М.: КомКнига / URSS).
Korotayev A. V., Malkov A., and Khaltourina D. 2006. Introduction to Social Macrodynamics: Compact Macromodels of the World System Growth. Moscow: URSS.
Korotayev A. V., Komarova N. L., and Khaltourina D. A. 2007. Laws of History. Secular Cycles and Millennial Trends. Demography. Economics. War. Moscow: URSS/KomKniga. In Russian (Коротаев А. В., Комарова Н. Л., Халтурина Д. А. Законы истории. Светские циклы и тысячелетние тенденции. Демография. Экономика. Война. М.: УРСС / КомКнига).
Korotayev A. V., Malkov A. S., and Khaltourina D. A. 2007. Laws of History: Mathematical Simulation of the Development of the World System: Demography, Economics, Culture. Moscow: URSS/KomKniga. In Russian (Коротаев А. В., Малков А. С., Халтурина Д. А. Законы истории: Математическое моделирование развития мировой системы: Демография, экономика, культура. М.: УРСС / КомКнига).
Lin R., Ding L., Casola C. et al. 2007. Transposase-Derived Transcription Factors Regulate Light Signaling in Arabidopsis. Science 318(5854): 1302–1305.
Lynch M., and Conery J. S. 2003. The Origins of Genome Complexity. Science 302(5649): 1401–1404.
Markov A. V., and Kulikov A. M. 2005. Origin of Eukaryota: Conclusions Based on the Analysis of Protein Homologies in the Three Superkingdoms. Paleontological Journal 4: 3–18; 39(4): 345–357.
Markov A. V., and Korotayev A. V. 2008. Hyperbolic Growth of Marine and Continental Biodiversity through the Phanerozoic and Community Evolution. Zhurnal obshchey biologii 69(3): 175–194. In Russian (Марков А. В., Коротаев А. В. Гиперболический рост разнообразия морской и континентальной биот фанерозоя и эволюция сообществ. Журнал общей биологии 69(3): 175–194).
Markov A. V., Korotayev A. V. 2009. Hyperbolic Increase in Living Nature and Society. Moscow: URSS. In Russian (Марков А. В., Коротаев А. В. Гиперболический рост в живой природе и обществе. М.: URSS).
Marshall C., and Schultze H.-P. 1992. Relative Importance of Molecular, Neontological, and Paleontological Data in Understanding the Biology of the Vertebrate Invasion of Land. Journal of Molecular Evolution 35(2): 93–101.
Mikkelsen T. S., Wakefield M. J., Aken B. et al. 2007. Genome of the Marsupial Monodelphis Domestica Reveals Innovation in Non-Coding Sequences. Nature 447(7141): 167–177.
Miller W. J., McDonald J. F., Nouaud D., and Anxolabehere D. 1999. Molecular Domestication – More than a Sporadic Episode in Evolution. Genetica 107(1–3): 197–207.
Muotri A. R., Marchetto M. C., Coufal N. G., and Gage F. H. 2007. The Necessary Junk: New Functions for Transposable Elements. Human Molecular Genetics 16 (Spec. 2), R159–R167.
Nakabachi A., Yamashita A., Toh H. et al. 2006. The 160 – Kilobase Genome of the Bacterial Endosymbiont Carsonella. Science 314(5797): 267.
Ochman H. 2005. Genomes on the Shrink. Proceedings of the National Academy of Sciences USA 102(34): 11959–11960.
Ofria C., Adami C., and Collier T. C. 2003. Selective Pressures on Genomes in Molecular Evolution. Journal of Theoretical Biology 222(4): 477–483.
Organ C. L., Shedlock A. M., Meade A. et al. 2007. Origin of Avian Genome Size and Structure in Non-Avian Dinosaurs. Nature 446(7132): 180–184.
Pan Q., Shai O., Lee L. J. et al. 2008. Deep Surveying of Alternative Splicing Complexity in the Human Transcriptome by High-Throughput Sequencing. Natural Genetics 40(12): 1413–1415.
Patthy L. 1999. Genome Evolution and the Evolution of Exon-Shuffling – a Review. Gene 238(1): 103–114.
Payne J. L., Boyer A. G., Brown J. H. et al. 2009. Two-Phase Increase in the Maximum Size of Life over 3.5 Billion Years Reflects Biological Innovation and Environmental Opportunity. Proceedings of the National Academy of Sciences, USA 106(1): 24–27.
Pellicciari C., Formenti D., Redi C. A., and Manfredi Romanini M. G. 1982. DNA Content Variability in Primates. Journal of Human Evolution 11(2): 131–141.
Putnam N. H., Butts T., Ferrier D. E. K. et al. 2008. The Amphioxus Genome and the Evolution of the Chordate Karyotype. Nature 453(71198): 1064–1071.
Raff R. A., and Kaufman T. C. 1986. Embryos, Genes, and Evolution: The Developmental Genetic Basis of Evolutionary Change. New York: Macmillan 1983; Moscow: Mir.
Rasmussen B., Fletcher I. R., Brocks J. J., and Kilburn M. R. 2008. Reassessing the First Appearance of Eukaryotes and Cyanobacteria. Nature 455(7216): 1101–1104.
Rozanov A. Yu. 2003. Fossil Bacteria, Sedimentogenesis, and the Early Biospheric Evolution. Paleontological Journal 6: 41–49; 37(6): 600–608.
Sharov A. A. 2006. Genome Increase as a Clock for the Origin and Evolution of Life. Biology Direct 1: 17.
Shu D. G., Luo H-L., Conway M. S. et al. 1999. Lower Cambrian Vertebrates from South China. Nature 402(6757): 42–46.
Stegemann S., Hartmann S., Ruf S., and Bock R. 2003. High Frequency Gene Transfer from the Chloroplast
Genome to the Nucleus. Proceedings of the
National Aca-
demy of Sciences USA 100(15): 8828–8833.
Takahashi
K., Hayashi N., Shimokawa T. et al.
2008. Cooperative Regulation
of Fc Receptor Gamma-Chain Gene Expression by Multiple Transcription Factors,
Inclu-
ding Sp1, GABP, and Elf-1. Journal of Biological
Chemistry 283(22): 15134–15141.
Thomas C. A. J. 1971. The Genetic Organization of Chromosomes. Annual Review of Genetics 5: 237–256.
Volff J. N. 2006. Turning Junk into Gold: Domestication of Transposable Elements and the Creation of New Genes in Eukaryotes. Bioessays 28(9): 913–922.
Wang E. T., Sandberg R., Luo S. et al. 2008. Alternative Isoform Regulation in Human Tissue Transcriptomes. Nature 456(7221): 470–476.
Xing J., Witherspoon D. J., Ray D. A. et al. 2007. Mobile DNA Elements in Primate and Human Evolution. Yearbook of Physical Anthropology (Suppl. 45): 2–19.
[1] URL: http: www.ncbi.nlm.nih.gov/genomes/lproks.cgi.