Sociopolitical Destabilization Dimensions in Comparative Global and Regional Perspective

Almanac: History & Mathematics:Entropy and Destabilization
DOI: https://doi.org/10.30884/978-5-7057-6233-0_06
This paper examines empirically political instability using a principal component analysis. Conducted tests allow us to identify its three types: (1) ‘armed destabilization’ with the main contributions on the part of number of killed in terror attacks, number of terror attacks, and guerilla warfare; (2) ‘mass protest destabilization’ with the main contributions on the part of anti-government demonstrations, riots, and general strikes; and (3) ‘elite destabilization’ with the main contributions on the part of governmental crises, coups and coup attempts, assassinations, and purges. Our analysis further demonstrates that some MENA countries are the most violently destabilized in the whole world for the period of 1970–2018 among all other countries. These results are supported by the mean factor score values of socio-political destabilization principal components for four world-system regions for three observation periods which show that, both for 1970–2018 and after 2011 periods, the Afrasian instability macrozone in general, and the MENA region in particular, turn out as the areas of the highest mean values of armed destabilization factor scores. Moreover, the conducted tests show that MENA is the only region where mass protest destabilization component is associated with repressions both for the general observation period (1970–2018) and for the period after the Arab Spring (since 2011) while for other regions the correlation with purges/repressions indicator is insignificant, though positive (South America and Sub-Saharan Africa) or even insignificant and negative (Western Europe). This appears to imply that in the MENA region protests are accompanied by mass repressions much more systematically than in the other parts of the world. However, we find the presence of number of terror attacks among the significant contributors to mass protest destabilization for Sub-Saharan Africa, which suggests that the mass protest destabilization in that part of the world is also of a rather special type involving a very substantial violent component. In the meantime, the principal component analysis of the destabilization in the MENA region (considered as a semi-peripheral world-system area) in comparison with South America (another world-system area), Western Europe (regarded as a part of the world-system core), and Sub-Saharan Africa (as a part of the world-system core) has yielded the following results. In general, we find that the highest percent of the destabilization variance is explained by the mass protest principal component for the world-system core (represented by Western Europe); and the lowest percent of the destabilization variance is explained by the armed destabilization principal component precisely for this part of the world. We also found that the highest percent of the destabilization variance is explained by the armed principal component for the world-system periphery (represented by Sub-Saharan Africa); and the lowest percent of the destabilization variance is explained by the mass protest destabilization principal component precisely for Sub-Saharan Africa. The world-system semi-periphery appears here in between those poles. The MENA region (which is the core of the Afrasian instability macrozone) ranks the second for both mass protests and armed destabilization, thus displaying very high levels of both (whereas South America occupies an intermediate place between MENA and Western Europe).
Keywords: MENA, the Afrasian instability macrozone, the Arab Spring, the World System, principal component analysis, socio-political destabilization, repressions, Sub-Saharan Africa, Western Europe, Latin America.
Triggered by the Arab Spring, the global wave of socio-political destabilization resulted in a very significant growth of socio-political instability in absolutely all world-system zones in different ways and not completely synchronously (Grinin and Korotayev 2012; Кorotayev, Meshcherina et al. 2016, 2019; Korotayev, Shishkina, and Issaev 2016; Akaev et al. 2017; Korotayev, Shishkina, and Lukhmanova 2017; Ortmans et al. 2017; Korotayev, Meshcherina, and Shishkina 2018; Korotayev, Romanov, and Medvedev 2019; Khokhlov et al. 2021; Korotayev, Shishkina, and Khokhlova 2022).
The factors of this socio-political destabilization of 2011 in Middle East and North Africa (MENA) have attracted serious attention of various researchers. The existing research on the analysis of socio-political destabilization in MENA countries shows that a number of political factors (regime type, intra-elite conflict, ineffective instruments of power transfer), social factors (presence of intertribal, interconfessional, and other social conflicts and contradictions), demographic factors (demographic structural risks, e.g., the ‘youth bulge’, unemployment among young people with higher education, etc.), historical factors (large-scale conflicts in the near past), religious factors (in particular, the inclusion of Islamists in the legal political processes), economic factors (e.g., the second wave of agflation that led to an explosive growth of food prices), and some subjective (socio-psychological and cultural-historical) factors played an important role in the genesis of explosive sociopolitical destabilization in the Arab countries in 2011 (Bilyuga 2017; Butenschȍn 2015; Grinin and Korotayev 2012; Grinin et al. 2016, 2019; Hussain and Howard 2013; Korotayev et al. 2011; Korotayev and Zinkina 2011, 2022; Malik and Awadallah 2013; Slinko et al. 2017; Steinert-Threlkeld 2017).
At the same time, little has been said about destabilization dimensions and their peculiarities for this region after the Arab Spring. Using descriptive statistics methods, we have distinguished between mass protest destabilization periods in MENA states on the observation of 19 countries (2011–2013 and since 2016) and terror destabilization period (2013–2016) which coincides with the rise of radical Islamist terrorism in the region (Korotayev and Khokhlova 2022).
However, it still remains unclear whether MENA is the most destabilized region, which types of destabilization are typical of it, what the features of these destabilization types are and what are their characteristics compared to other world-system zones.
Types of Destabilization Processes
Much has been written about the problem of socio-political destabilization typology. In general, researchers distinguish between internal and inter-state socio-political destabilization types, whereas all acts of violence, conflict situations and contentious socio-political events are considered as destabilization processes (see, e.g., Flanigan and Fogelman 1970; Hibbs 1973; Gurr and Lichbach 1986; Alesina et al. 1996; Benson and Kugler 1998; de Haan 2007; Jong-A-Pin 2009; Celestino and Gleditsch 2013; Klomp and de Haan 2013).
The first attempts to perform a principal component analysis for destabilization indicators were made in order to highlight the main destabilization types already in the 1960s and 1970s (Tanter 1966; Hibbs 1973). In these studies, limited to 1948–1967 period, researchers tended to identify ‘anomic violence’ type of destabilization which includes anti-government demonstrations, strikes and riots, and ‘civil war’ type as the second destabilization dimension, which includes armed insurgencies and assassinations.
Douglas Hibbs' (1973) 108 nation aggregate data analysis of causal structures that underlie mass political violence within nations (for 1948–1967 period) showed that coups were positively related to the past coups experience, and defense expenditure as a proportion of total government expenditure, and negatively correlated with the development level of (non-military) socio-political institutions. He defined the focus of his investigation as events of domestic violence that have non-systemic character and direct and immediate political significance as well as involve collective or mass actions. The variables that fit his theoretical dimensions are Riots, Guerilla Warfare, General Strikes, Assassinations, Deaths from Political Violence, and Anti-Government Demonstrations (Hibbs 1973: 19). Hibbs' (1973) analysis identified two dimensions (factors): ‘anomic violence’, which included riots, anti-government demonstrations and strikes, and ‘civil war’ that combined such forms of political violence as armed assaults, murders and assassinations.
Richard Jong-A-Pin (2009) came up with the following four types of socio-political destabilization: mass civil protest (demonstrations, riots and strikes); politically motivated violence (civil war, guerilla warfare, revolutions, assassinations, internal conflicts, ethnic conflicts); instability within the political regime (strikes, fractionalization, ruling party incumbent period, society polarization, general elections number, governmental crises) and instability of the political regime (constitutional changes, coups, political regime changes, government change and religious factors).
Elena Slinko and others using principal component analysis identify the following four types of socio-political destabilization in their cross-national research using CNTS database: mass protest destabilization (with the main contributions on the part of anti-government demonstrations, general strikes, and riots); abrupt regime change (predominantly due to coups); armed destabilizati-on (terror attacks, etc.) and intraelite destabilization (with the main contributions on the part of political crises, assassinations, purges and coups) (Slinko et al. 2018). The analysis of the relationship between socio-political and economic indicators with four types of instability by Slinko and others shows that each type of destabilization has its own socio-political conditions that contribute to the risk of its occurrence (Ibid.). They also demonstrate that various dimensions of socio-political destabilization affect destabilization types differently. At the same time, the chronological frameworks of the paper are limited by 2010 due to, as they explain, the ‘structural shift’ (Akaev et al. 2017; Korotayev et al. 2018) caused by the events of the Arab Spring.
This research aims to contribute to this literature block with world-systems destabilization typology study in order to determine the place of MENA and the Afrasian instability macrozone in the hierarchy of the most destabilized regions of the world for the observation period including 2011–2018 (in contrast to Slinko et al. 2018), and investigate its specific destabilization dimensions peculiarities.
Research Design, Materials and Method
Immanuel Wallerstein's world-systems approach is central for the present research (Wallerstein 1974, 1979, 1980, 1987, 1988, 2004). As he noted, this system consists of the following three components:
1) ‘core’ (in relation to the modern World System, this component refers to the high-income OECD countries with developed industrial/postindustrial economics and strong state);
2) ‘periphery’, countries and regions specialized on the resource extraction which have predominantly agricultural economy and weak state (the most underdeveloped low income third world countries);
3) ‘semi-periphery’ (modernized countries of the ‘second wave’; socialist countries of the 20th century, all the BRICS countries of the 21st century, middle income third world countries).
According to Wallerstein, capitalist world-system is founded on the non-equivalent division of labor and exploitation of the periphery by the core (of course, this point needs now important qualifications [see, e.g., Grinin and Korotayev 2015; Korotayev, Zinkina et al. 2011; Korotayev, Goldstone et al. 2015). Core countries force the periphery to supply raw materials at lower prices, which contributes to the prosperity of the center and the impoverishment of the periphery (Wallerstein 1974, 1979, 1980, 1987, 1988, 2004).
Therefore, following Wallerstein, the countries of Western Europe will be taken as an example of the world-system ‘core’, Sub-Saharan Africa as the ‘periphery’ whereas South America and MENA countries will be taken as examples of ‘semi-periphery’ zones.
One can suppose that the ‘semi-periphery’ regions are the most unstable among the three abovementioned world-system zones due to the fact that the highest risks of socio-political instability are characteristic of the countries with intermediate values of GDP per capita which are typical for this world-system zone, not the countries with the highest or lowest values, as it is observed that until a certain value of GDP per capita is reached, economic growth predicts an increase in the risks of sociopolitical destabilization (Bilyuga et al. 2016; Korotayev, Bilyuga et al. 2016, 2017a, 2017b, 2018; Korotayev, Vaskin et al. 2017, 2018, 2021; Korotayev, Khohlova et al. 2018; Vaskin et al. 2018; Korotayev, Sawyer, Grinin et al. 2020; Korotayev, Sawyer et al. 2021; Korotayev, Med-vedev et al. 2022). At the same time, the destabilization period after the Arab Spring (2011) had a serious effect on the socio-political dynamics of the MENA semi-periphery zone (Akaev et al. 2017; Korotayev et al. 2018).
Thus, our first hypothesis is as follows:
Latin America and MENA regions as semi-periphery zones of the world-system countries are the most unstable among the four for the period before the Arab Spring, while for the whole observation period as well as after 2011 the highest destabilization values will be observed for MENA region due to the Arab Spring effect.
At the same time, taking into account the Arab Spring phenomena and growth of terrorism threat level in MENA region in 2013–2014 with the Islamic State of Iraq and Levant (ISIS) expansion (Korotayev and Khokhlova 2022), we hypothesize that:
MENA region countries are the most violently destabilized among the four analyzed regions.
The total dataset for 1970–2018 includes 10,133 observations, among them 1,201 for MENA, 1,244 for Western Europe, 588 for South America and 2,255 for Sub-Saharan Africa.
We use the Cross-National Time-Series Database (CNTS [Banks and Wilson 2020]) as the principal database for this research. In addition to the CNTS, we use the Global Terrorism Database (START 2020) for the variables indicating number of terrorist attacks and number of people killed in terrorist attacks whereas we take the number of coups and coup attempts from the Coups d'Etat 1946–2017 database (Center for Systemic Peace 2020).
To identify the principal components (types of instability) for the whole world, a principal components analysis is used. To extract an adequate number of principal components eigenvalues, we use a modified version of the Kaiser criterion, according to which the eigenvalue must be greater than 0.95, and Cattell's scree test (Cattell 1966).
Tests
Cross-National Investigation
At the first stage, we identify the principal components for the world destabilization processes in order to determine ‘typical’ for the cross-national sample components using only CNTS database indicators to understand which variables should be included. Firstly, we use observation period of 1946[1] – 2018.
Table 1. Principal components eigenvalues
|
Component number |
Eigenvalue |
% of Variance |
|
1 |
2.219 |
27.74 |
|
2 |
1.377 |
17.21 |
|
3 |
0.981 |
12.26 |
|
4 |
0.921 |
11.51 |
|
5 |
0.824 |
10.30 |
|
6 |
0.757 |
9.5 |
|
7 |
0.524 |
6.66 |
|
8 |
0.397 |
5 |
Source: Banks and Wilson 2020.
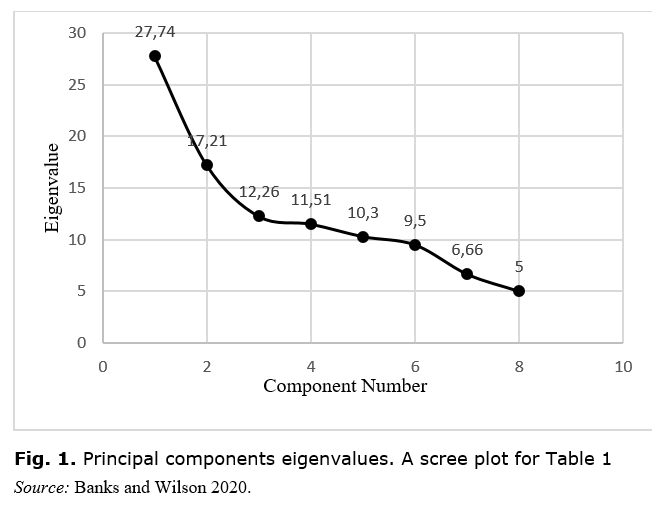
The principal components analysis, with factors rotated by varimax method, gave the following results from 1946 till 2018 for the whole world sample (see Table 2).
Table 2. Loadings of three principal components for the first factor analysis (the whole world)
|
Political instability indicators |
PC1 |
PC2 |
PC3 |
|
Cnts_domestic1 (Assassinations) |
–0.029 |
0.409 |
0.597 |
|
Cnts_domestic2 (General strikes) |
0.789 |
0.094 |
–0.010 |
|
Cnts_domestic3 (Guerrilla warfare/ Terrorist attacks) |
0.183 |
–0.177 |
0.798 |
|
Cnts_domestic4 (Governmental crisis) |
0.132 |
0.642 |
0.055 |
|
Cnts_domestic5 (Repressions) |
0.113 |
0.551 |
–0.175 |
|
Cnts_domestic6 (Riots) |
0.821 |
0.100 |
0.148 |
|
Cnts_domestic7 (Coups and Coup Attempts) |
–0.070 |
0.701 |
0.155 |
|
Cnts_domestic8 (Anti-government demonstrations) |
0.844 |
0.005 |
0.051 |
Source: Banks and Wilson 2020; START 2020; Center for Systemic Peace 2020.
The first component coincides with the result obtained by Hibbs (1973) and Jong-A-Pin (2009). In general, it includes mass protest actions, which may contain separate acts of aggression, but do not lead to large-scale violence. This component can be called ‘mass protest destabilization’. The second component deals with instability involving mainly elites and counter-elites rather than masses of population and we called it ‘elite destabilization’. The scale of such conflicts may vary from political crises to assassinations, purges/repressions as well as coups and coup attempts. Finally, the third component includes indicators that involve armed violence with the highest loading belonging to guerilla warfare/major terrorist attacks. It is remarkable that among mass destabilization indicators the highest loading belongs to riots that are the only form of mass protest actions that may involve a substantial degree of violence[2] (unlike antigovernment demonstrations[3] and general strikes). We will call this factor ‘armed destabilization’.
At the second stage, we add to our factor analysis three more socio-political destabilization indicators: number of terrorist attacks and number of the killed people in terrorist attacks from the Global Terrorist Database (START 2020)[4] and number of coups and coup attempts from the Coups d'Etat 1946–2017 (Center for Systemic Peace 2018) (see Tables 3, 4). The observation period is 1970–2018.
Table 3. Principal components eigenvalues
|
Component number |
Eigenvalue |
% of
Variance |
|
1 |
2.802 |
25.5 |
|
2 |
1.865 |
16.96 |
|
3 |
1.574 |
14.31 |
|
4 |
0.946 |
8.60 |
|
5 |
0.924 |
8.40 |
|
6 |
0.820 |
7.45 |
|
7 |
0.610 |
5.54 |
|
8 |
0.502 |
4.56 |
|
9 |
0.470 |
4.27 |
|
10 |
0.350 |
3.18 |
|
11 |
0.137 |
1.24 |
Source: Banks and Wilson 2020; START 2020; Center for Systemic Peace 2020.
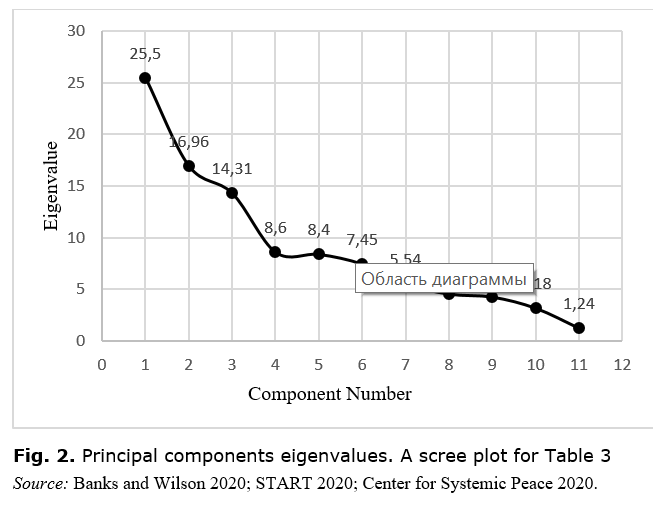
The principal components analysis, with factors rotated by varimax method, gave the following results for the whole world sample from 1970 till 2018 (see Table 4).
Table 4. Loadings of three principal components for the whole world with the number of people killed in terrorist attacks, number of terror attacks and coups and coup attempts (1970–2018)
|
Political instability indicators |
PC1 |
PC2 |
PC3 |
|
Cnts_domestic1 (Assassinations) |
0.276 |
0.013 |
0.465 |
|
Cnts_domestic2 (General strikes) |
0.022 |
0.804 |
0.067 |
|
Cnts_domestic3 (Guerrilla warfare) Number of Terror Attacks Number of Killed |
0.774 0.913 0.927 |
0.133 0.131 –0.028 |
–0.046 0.086 0.077 |
|
Cnts_domestic4 (Governmental crisis) |
0.044 |
0.144 |
0.524 |
|
Cnts_domestic5 (Repressions) |
–0.018 |
0.198 |
0.314 |
|
Cnts_domestic6 (Riots) Cnts_domestic7 (‘Revolutions’) |
0.139 0.019 |
0.842 –0.065 |
0.069 0.756 |
|
Coups and Coup Attempts |
–0.080 |
–0.057 |
0.685 |
|
Cnts_domestic8 (Anti-government demonstrations) |
0.085 |
0.849 |
0.031 |
Source: Banks and Wilson 2020; START 2020; Center for Systemic Peace 2020.
Table 4 shows the opposite from the Table 1 results on the world sample with three new variables added to the model: the first component represents ‘armed destabilization’ type with the crucial values for number of terrorist attacks, number of killed in terrorist attacks, domestic3 (guerrilla warfare) and cnts_domestic1 (assassinations). The second column of data represents ‘mass destabilization’ type while previously in Table 1 this type of destabilization described the first principal component. The last column demonstrates ‘elite destabilization’ and covers approximately 15 % of variance of the world instability phenomena. Moreover, taking into account the methodological perspective, Table 4 shows that cnts_domestic7 and coups and coup attempts variables practically replicate each other in terms of the values strength and correlations directions and, as we suppose, are mutually exclusive. Thus, at the third stage, we get rid of the cnts_domestic7 (revolutions) variable and it becomes obvious that it does not bring crucial difference to our new test results (see Tables 5, 6).
Table 5. Principal components eigenvalues for the whole world (version with substituted Cnts_domestic7 with Coups and Coup Attempts 1970–2018)
|
Component number |
Eigenvalue |
% of Variance |
|
1 |
2.784 |
27.83 |
|
2 |
1.865 |
18.65 |
|
3 |
1.262 |
12.62 |
|
4 |
0.946 |
9.46 |
|
5 |
0.898 |
8.98 |
|
6 |
0.782 |
7.82 |
|
7 |
0.503 |
5.03 |
|
8 |
0.472 |
4.72 |
|
9 |
0.350 |
3.5 |
|
10 |
0.137 |
1.37 |
Source: Banks and Wilson 2020; START 2020; Center for Systemic Peace 2020.
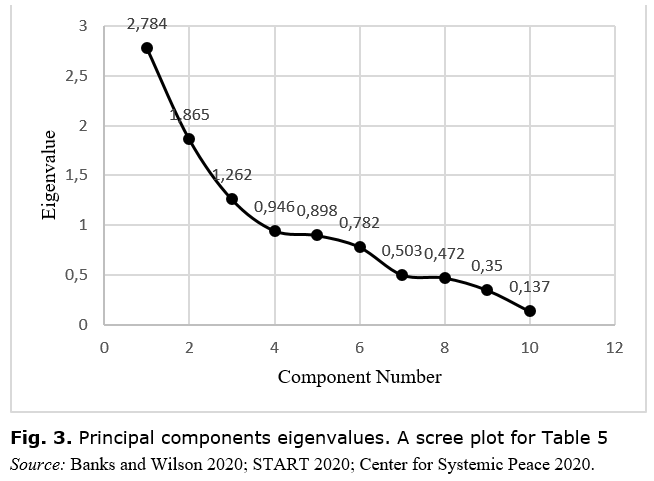
The principal components analysis with factors rotated by varimax method gave the following results for the whole world sample from 1970 till 2018 with no cnts_domestic7 index (see Table 6).
Table 6. Loadings of three principal components (version without cnts_domestic7, 1970–2018)
|
Political instability indicators |
PC1 |
PC2 |
PC3 |
|
Cnts_domestic1 (Assassinations) |
0.270 |
–0.016 |
0.534 |
|
Cnts_domestic2 (General strikes) |
0.019 |
0.804 |
0.084 |
|
Cnts_domestic3 (Guerrilla warfare) Number of Terror Attacks Number of Killed |
0.775 0.913 0.928 |
0.139 0.131 –0.026 |
–0.048 0.091 0.068 |
|
Cnts_domestic4 (Governmental crisis) |
0.032 |
0.097 |
0.667 |
|
Cnts_domestic5 (Repressions) |
–0.027 |
0.166 |
0.424 |
|
Cnts_domestic6 (Riots) Coups and Coup Attempts |
0.137 –0.074 |
0.843 –0.072 |
0.085 0.637 |
|
Cnts_domestic8 (Anti-government demonstrations) |
0.084 |
0.853 |
0.032 |
Source: Banks and Wilson 2020; START 2020; Center for Systemic Peace 2020.
The test results from Table 6 confirm that the model presented in Table 6 can work without cnts_domestic7 variable: while excluding this indicator, we get practically the same results for the three principal components which reflect ‘armed destabilization’, ‘mass destabilization’ and ‘elite destabilization’ respectively as in Table 4. Hereafter, the list of variables in all the next tests will be the same as in Tables 5, 6.
In order to find out which countries most contribute to the abovementioned components we use mean values and provide top-20 most destabilized countries of the world in terms mass protest and armed destabilization factors (see Table 7).
Table 7. Top-20 most unstable countries from the perspective of armed and mass protest types of destabilization, 1970–2018
|
Armed Destabilization |
Mass Protest Destabilization |
||||
|
Number |
Country name |
Value |
Number |
Country name |
Value |
|
1 |
Iraq |
4.320 |
1 |
India |
3.793 |
|
2 |
Afghanistan |
2.808 |
2 |
South Africa |
1.144 |
|
3 |
Pakistan |
1.577 |
3 |
USA |
1.139 |
|
4 |
India |
1.090 |
4 |
China |
1.025 |
|
5 |
Colombia |
1.085 |
5 |
Greece |
1.021 |
|
6 |
Ukraine |
1.044 |
6 |
France |
0.959 |
|
7 |
Nigeria |
1.042 |
7 |
Bangladesh |
0.829 |
|
8 |
Somalia |
0.711 |
8 |
Pakistan |
0.762 |
|
9 |
Syria |
0.703 |
9 |
UK |
0.754 |
|
10 |
Philippines |
0.689 |
10 |
Spain |
0.746 |
Continuation of the Table
|
1 |
2 |
3 |
4 |
5 |
6 |
|
11 |
Yemen |
0.564 |
11 |
USSR |
0.738 |
|
12 |
El Salvador |
0.499 |
12 |
Israel |
0.713 |
|
13 |
Peru |
0.467 |
13 |
Argentina |
0.682 |
|
14 |
South Sudan |
0.430 |
14 |
Italy |
0.624 |
|
15 |
Sri Lanka |
0.426 |
15 |
Korea |
0.578 |
|
16 |
Turkey |
0.376 |
16 |
Russia |
0.553 |
|
17 |
Algeria |
0.314 |
17 |
Egypt |
0.499 |
|
18 |
Egypt |
0.254 |
18 |
Nepal |
0.498 |
|
19 |
UK |
0.248 |
19 |
Bolivia |
0.469 |
|
20 |
Libya |
0.216 |
20 |
Chile |
0.441 |
Note: MENA region/Afrasian instability macrozone countries are highlighted with darker color.
Sources: Banks and Wilson 2020; START 2020; Center for Systemic Peace 2020.
Table 7 demonstrates that almost half of the world's most violently destabilized countries are located in MENA region, for example Iraq, Afghanistan, Somalia, Syria, Yemen, South Sudan, Turkey, Algeria, Egypt and Libya. It should also be noted that Pakistan which sometimes is included in the ‘Greater Middle East’ and the ‘Broader Middle East and North Africa (BMENA)’ (see, e.g., Perthes 2004; Latif and Abbas 2011; Markakis 2015), and Nigeria, where Islamic radical movement Boko Haram (now Islamic State's West Africa Province, ISWAP)[5] operates which pledged its alliance to ISIS[6] in 2015, are also among the top-20 most violently destabilized countries. Moreover, two of MENA countries, Iraq and Afghanistan, occupy the first two places and are followed by Pakistan which comes third. Together, the values for the MENA countries, which are part of ‘semi-periphery system’ together with Pakistan, Nigeria, and Mali (see Table 2) comprise more than 70 % of the total violent destabilization factor score points for top-20 violently destabilized countries of the world.
One should also note that both Pakistan, Nigeria, Mali, Somalia, and South Sudan belong to the Afrasian Instability Zone (which includes, in addition to the Greater Middle East, the macro Sahel zone of the Sub-Saharan Africa with Nigeria, as well as such highly destabilized countries as Mali, Somalia and South Sudan). This macrozone has been shown to be characterized by especially high levels of violent destabilization (Korotayev, Issaev et al. 2016; Korotayev, Grinin, Malkov et al. 2021, etc.). Hence, this study provides additional support for this conclusion.
Besides, the top-20 violently destabilized countries of the world also include Colombia and Peru which are the countries of the South America region which is the second ‘semi-periphery zone’. Other countries, namely India, Ukraine, the Philippines, El Salvador and Sri Lanka belong to the regions which are not analyzed in this study (except for the UK which is a Western European state).
Concerning mass protest destabilization type, it is obvious that is not very typical for the ‘semi-periphery’ zones: only Pakistan, Israel and Egypt occupy the 8th, 12th and 17th places respectively out of top-20 most non-violently destabilized countries. The largest share of this destabilization factor belongs to Western Europe countries, India and China. At the same time, we observe countries of South America in the top-20 non-violently destabilized countries of the world, for example Argentina, Bolivia and Chile.
At the next stage, we divide the observation period into two and analyze how the countries list changes (see Table 8).
Table 8. Top-20 most unstable countries in terms of armed destabilization for the periods before and after the Arab Spring
|
1970–2010 |
2011–2018 |
||||
|
Number |
Country name |
Value |
Number |
Country name |
Value |
|
1 |
Colombia |
3.148 |
1 |
Iraq |
8.158 |
|
2 |
Iraq |
3.008 |
2 |
Afghanistan |
6.908 |
|
3 |
India |
2.193 |
3 |
Pakistan |
3.138 |
|
4 |
Peru |
2.012 |
4 |
Nigeria |
2.722 |
|
5 |
El Salvador |
1.783 |
5 |
Somalia |
2.205 |
|
6 |
Sri Lanka |
1.655 |
6 |
Syria |
1.895 |
|
7 |
Pakistan |
1.305 |
7 |
Yemen |
1.637 |
|
8 |
Philippines |
1.235 |
8 |
Ukraine |
1.527 |
|
9 |
Guatemala |
1.235 |
9 |
Philippines |
1.149 |
|
10 |
Afghanistan |
1.162 |
10 |
India |
1.083 |
|
11 |
Algeria |
1.116 |
11 |
Libya |
0.846 |
|
12 |
UK |
0.948 |
12 |
Egypt |
0.580 |
|
13 |
Nicaragua |
0.869 |
13 |
Turkey |
0.417 |
|
14 |
Turkey |
0.861 |
14 |
Colombia |
0.372 |
|
15 |
Lebanon |
0.857 |
15 |
Thailand |
0.346 |
|
16 |
Spain |
0.781 |
16 |
DRC |
0.232 |
|
17 |
USA |
0.395 |
17 |
Cameroon |
0.209 |
|
18 |
Russia |
0.344 |
18 |
Mali |
0.168 |
|
19 |
Italy |
0.343 |
19 |
Burundi |
0.152 |
|
20 |
Angola |
0.336 |
20 |
Mozambique |
0.086 |
Note: MENA region/Afrasian instability macrozone countries are highlighted with darker color.
Table 8 demonstrates that MENA countries as part of ‘semi-periphery zone’ occupy more than a quarter of all the places in the list of top-20 most violently destabilized countries of the world before 2011. These countries are Iraq, Afghanistan, Algeria, Turkey and Lebanon (with Pakistan as the sixth country if we take into account BMENA/Afrasian instability macrozone). Moreover, Iraq and Colombia practically share the first place as their values are approximately the same for the period before 2011 (3.1 and 3 respectively), while other countries values are at least 1.5 times smaller.
South America ‘semi-periphery region’ countries also occupy a large share of the list: Colombia comes first, Peru takes the fourth place.
Since the Arab Spring, the values for the first two countries (Iraq and Afghanistan) comprise almost 45 % of all the countries values. In total, MENA countries values after 2011 comprise approximately 66 % of all top-20 most violently destabilized countries values. It must be noted that the first seven lines of the rating goes to MENA countries, Pakistan and Nigeria, the list is interrupted by Ukraine, the Philippines and India, which are not included in the four regions of the world-system zones of this paper. Thus, one can see that among the four analyzed regions MENA is the most violently destabilized. On the other hand, if we take into account the Afrasian instability zone as a whole, most of top-20 countries belong to it.
Table 9. Top-20 most unstable countries in terms of mass protests destabilization for the periods before and after the Arab Spring
|
1970–2010 |
2011–2018 |
||||
|
Number |
Country name |
Value |
Number |
Country name |
Value |
|
1 |
2 |
3 |
4 |
5 |
6 |
|
1 |
India |
2.91 |
1 |
India |
7.393 |
|
2 |
South Africa |
2.054 |
2 |
USA |
2.751 |
|
3 |
USSR |
1.714 |
3 |
Greece |
2.301 |
|
4 |
Korea |
1.585 |
4 |
China |
1.944 |
|
5 |
Israel |
1.472 |
5 |
France |
1.569 |
|
6 |
Argentina |
1.343 |
6 |
Egypt |
1.358 |
|
7 |
Pakistan |
1.214 |
7 |
UK |
1.189 |
|
8 |
Russia |
1.155 |
8 |
Bangladesh |
1.151 |
|
9 |
Spain |
1.069 |
9 |
Spain |
1.134 |
|
10 |
Italy |
1.02 |
10 |
Pakistan |
1.087 |
|
11 |
Bolivia |
1.029 |
11 |
South Africa |
0.996 |
Continuation of the Table
|
1 |
2 |
3 |
4 |
5 |
6 |
|
12 |
France |
1.018 |
12 |
Nepal |
0.92 |
|
13 |
Bangladesh |
0.952 |
13 |
Italy |
0.96 |
|
14 |
China |
0.851 |
14 |
Brazil |
0.864 |
|
15 |
UK |
0.838 |
15 |
Venezuela |
0.832 |
|
16 |
Haiti |
0.771 |
16 |
Turkey |
0.727 |
|
17 |
Poland |
0.731 |
17 |
Mexico |
0.657 |
|
18 |
Serbia |
0.716 |
18 |
Sudan |
0.64 |
|
19 |
Indonesia |
0.655 |
19 |
Chile |
0.633 |
|
20 |
Yugoslavia |
0.6 |
20 |
Bahrain |
0.617 |
Note: MENA region/Afrasian instability macrozone countries are highlighted with darker color.
Table 9 demonstrates that except for Israel none of MENA countries are included in top-20 most non-violently unstable countries of the world before 2011 (in addition to Pakistan from the Afrasian instability macrozone). Serious mass protest destabilization type in MENA occurs after the Arab Spring, and predictably affects Egypt, Turkey, Sudan and Bahrain. However, together their values explain 11 % of the 20 countries list.
To sum up, the preliminary results of the factor analysis of socio-political destabilization on the world sample show that MENA countries which belong to ‘semi-periphery’ world-system zone are the most violently destabilized for the period of 1970–2018 in the whole world: together with Pakistan, Nigeria, Somalia and Mali (from the Afrasian instability macrozone) their values comprise more than 70 % of the total values for top-20 destabilized countries. Serious escalation of armed destabilization occurs predictably after 2011, when the countries of this region occupy more than two thirds of values of the top-20 violently destabilized states of the world.
The next task is to identify what the MENA region socio-political destabilization factors peculiarities are and which indicators each of the three mentioned dimensions includes.
Middle East and North Africa
In this section, we use principal component (PC) analysis in order to investigate the peculiarities of MENA socio-political destabilization dimensions for 1970–2018 (see Tables 10, 11).
Table 10. Principal components (PC) eigenvalues for MENA (1970–2018)
|
Component number |
Eigenvalue |
% of
Variance |
|
1 |
2.966 |
29.66 |
|
2 |
2.205 |
22.05 |
|
3 |
1.205 |
12.05 |
|
4 |
1.024 |
10.24 |
|
5 |
0.777 |
7.77 |
|
6 |
0.648 |
6.49 |
|
7 |
0.583 |
5.84 |
|
8 |
0.294 |
2.94 |
|
9 |
0.237 |
2.38 |
|
10 |
0.061 |
0.61 |
Sources: Banks and Wilson 2020; START 2020; Center for Systemic Peace 2020.
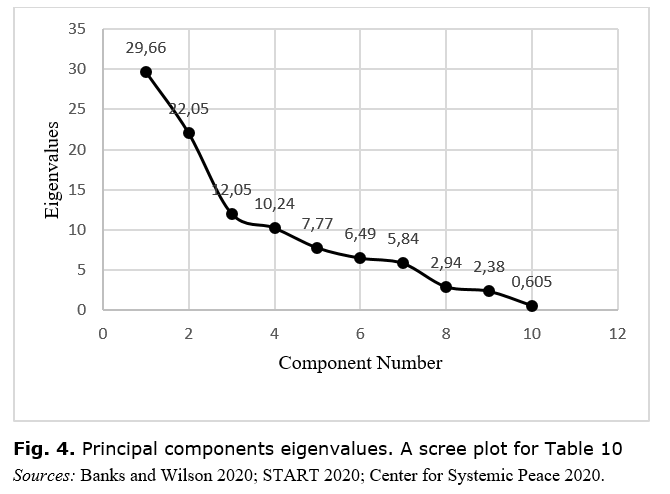
The principal components analysis, with factors rotated by varimax method, gave the following results for MENA in 1970–2018 (see Table 11).
Table 11. Loadings of three principal components for MENA (1970–2018)
|
Political instability indicators |
PC1 |
PC2 |
PC3 |
PC4 |
|
Cnts_domestic1 (Assassinations) |
0.266 |
0.047 |
0.728 |
–0.016 |
|
Cnts_domestic2 (General strikes) |
–0.096 |
0.691 |
0.204 |
–0.152 |
|
Cnts_domestic3 (Guerrilla warfare) Number of Terror Attacks Number of Killed |
0.896 0.944 0.948 |
0.060 0.050 0.000 |
–0.037 0.174 0.158 |
0.008 –0.006 –0.021 |
|
Cnts_domestic4 (Governmental crises) |
–0.022 |
0.124 |
0.821 |
0.119 |
|
Cnts_domestic5 (Purges/Repressions) |
0.025 |
0.508 |
–0.062 |
0.551 |
|
Cnts_domestic6 (Riots) Coups and Coup Attempts |
0.125 –0.032 |
0.829 –0.090 |
0.080 0.132 |
0.078 0.883 |
|
Cnts_domestic8 (Anti-government demonstrations) |
0.072 |
0.887 |
–0.018 |
0.079 |
Note: PC = principal component.
Sources: Banks and Wilson 2020; START 2020; Center for Systemic Peace 2020.
Table 11 demonstrates that the PC1 of destabilization for MENA for 1970–2018 is the ‘armed’ one, which comprises approximately 30 % of all instability phenomena, according to Table 3. We also see that PC1 is produced mostly by guerilla warfare, number of terror attacks and number of people killed in those attacks and to a smaller extent by assassinations. The PC2 reflects mass protest destabilization which encompasses 22 % of variance explained. It must be noted that besides those indicators which are typical for mass destabilization on the world sample (see Table 6), like general strikes, riots and anti-government demonstrations indicators, MENA mass destabilization PC2 also includes purges/repressions with loadings twice higher than PC2 assassinations indicator for the world sample does. This appears to imply that in the MENA region protests are associated with repressions much stronger than in the other parts of the world. The elite destabilization for MENA is divided into two components: PC3 and PC4, which together comprise 22 % of variance that is comparable with PC2 – mass protest destabilization component.[7]
Further we analyze the same components after dividing the observation period into two: before and after 2011 (see Tables 12, 13).
Table 12. Principal components eigenvalues for MENA for the periods before and after the Arab Spring
|
1970–2010 |
2011–2018 |
||||
|
Component number |
Eigenvalue |
% of Variance |
Component number |
Eigenvalue |
% of Variance |
|
1 |
2.843 |
28.43 |
1 |
2.991 |
29.91 |
|
2 |
1.815 |
18.15 |
2 |
2.386 |
23.87 |
|
3 |
1.320 |
13.2 |
3 |
1.116 |
11.16 |
|
4 |
0.891 |
8.91 |
4 |
0.985 |
9.85 |
|
5 |
0.788 |
7.88 |
5 |
0.712 |
7.12 |
|
6 |
0.696 |
6.96 |
6 |
0.675 |
6.75 |
|
7 |
0.632 |
6.32 |
7 |
0.592 |
5.92 |
|
8 |
0.545 |
5.45 |
8 |
0.275 |
2.75 |
|
9 |
0.321 |
3.21 |
9 |
0.216 |
2.16 |
|
10 |
0.150 |
1.49 |
10 |
0.051 |
0.51 |
Sources: Banks and Wilson 2020; START 2020; Center for Systemic Peace 2020.
Table 13. Loadings of principal components for MENA for the periods before and after the Arab Spring
|
Political instability indicators |
1970–2010 |
2011–2018 |
|||||
|
PC1 |
PC2 |
PC3 |
PC1 |
PC2 |
PC3 |
PC4 |
|
|
Cnts_domestic1 (Assassinations) |
0.594 |
0.250 |
0.232 |
0.261 |
–0.008 |
0.690 |
–0.144 |
|
Cnts_domestic2 (General strikes) |
–0.023 |
0.709 |
–0.054 |
–0.101 |
0.742 |
0.010 |
–0.283 |
|
Domestic3 (Guerrilla warfare) |
0.304 |
0.115 |
0.523 |
0.903 |
–0.045 |
–0.029 |
0.072 |
|
Number of Terror Attacks |
0.922 |
0.015 |
–0.038 |
0.944 |
–0.023 |
0.197 |
0.007 |
|
Number of Killed |
0.922 |
–0.024 |
–0.025 |
0.954 |
–0.062 |
0.134 |
–0.043 |
|
Cnts_domestic4 (Governmental crisis) |
0.324 |
0.525 |
0.345 |
–0.027 |
0.017 |
0.862 |
0.145 |
|
Cnts_domestic5 (Repressions) |
0.018 |
0.028 |
0.727 |
–0.072 |
0.605 |
0.000 |
0.317 |
|
Cnts_domestic6 (Riots) |
0.032 |
0.876 |
0.022 |
0.057 |
0.737 |
0.037 |
0.352 |
|
Coups and Coup Attempts |
–0.092 |
–0.048 |
0.687 |
0.025 |
0.153 |
0.032 |
0.882 |
|
Cnts_domestic8 (Anti-government demonstrations) |
0.106 |
0.792 |
0.046 |
–0.023 |
0.898 |
–0.024 |
0.057 |
Sources: Banks and Wilson 2020; START 2020; Center for Systemic Peace 2020.
As shown in Tables 12, 13, the loadings of socio-political destabilization indicators in the MENA region before and after the 2011 turbulence have their own peculiarities. Although, PC1 for the both periods is ‘armed’ and PC2 for both periods describes ‘mass protest’ destabilization; PC3 for both periods represents ‘elite destabilization’ (in fact, PC4 for 2011–2018 observation period also reflects primarily elite destabilization), the results are different as regards the component indicator sets. Assassinations indicator is significant for all of the three destabilization dimensions with the highest eigenvalues before 2011. Before 2011, PC1, besides guerilla warfare, number of terror attacks and number of people killed in terror attacks (which were typical for 1970–2010 observation period) as well as assassinations also includes governmental crises, while for PC1 for the period after 2011 this is not true. It is also possible to indicate an increase in the values of guerilla warfare, number of terror attacks and number of people killed in terror attacks after 2011: the largest escalation is observed for guerilla warfare which grows from 0.304 to 0.903. Predictably, significant increase is observed for the loadings of number of terror attacks and number of people killed in terror attacks indicators. Thus, this implies the decline of the role of assassinations in the armed destabilization in MENA region after 2010 and the increase of importance of the guerilla warfare.
PC2 for MENA, besides general strikes, riots and anti-government demonstrations[8] include assassinations before 2011 and repressions after the start of the Arab Spring. Since 2011 there has been a different change in PC2: one can see that there is no assassinations indicator for the 2011–2018 observation period. Moreover, the loading value for riots indicator which includes certain violence (see Banks and Wilson 2020) is lower than the value before 2011. In gene-ral, one may observe the decline of the assassinations contribution to the mass protest destabilization after 2010 (note that the same is shown above with the respect to the bloody destabilization component). After 2010, one can also see the increasing contribution of general strikes and anti-government demonstrations to the mass protest destabilization and appearance of purges/repressions as a significant contributor. This seems to be associated with the fact that after 2010 in MENA mass protests became especially tightly associated with repressions (this was not observed, e.g., in Western Europe and South America and quite predictably the repressions are not found among the contributors to the respective principal component [see below]).
It is important to note that while the percent of variance explained for armed destabilization before and after the Arab Spring hardly changed (from 28.43 % to 29.91 %), this loading value growth for mass protest destabilization is very significant (from 18.15 % to 23.87 %).[9]
As a result, MENA destabilization types have their special features shown in the indicators sets. It is observed that the role of assassinations in the armed destabilization in MENA region after 2010 declined while guerilla warfare indicator increased in its value. The same trend for assassinations is indicated for mass protest destabilization before and after 2010 while the loading values for general strikes and anti-government demonstrations significantly grew. Moreover, purges/repressions as a crucial contributor is observed for mass protest destabilization after the start of the Arab Spring. It is also shown that the percent of variance explained for armed destabilization before and after the Arab Spring hardly changed (from 28.43 % to 29.91 %), this value growth for mass protest destabilization is very significant (from 18.15 % to 23.87 %).
Western Europe
At the next stage, we replicate the same tests for Western Europe. In Table 14 we identify the main components (types of instability) for the region and use the same principal components analysis for 1970–2018 in order to compare the results further with the ones for MENA.
Table 14. Principal components eigenvalues for Western Europe (all years)
|
Component number |
Eigenvalue |
% of Variance |
|
1 |
2.954 |
29.54 |
|
2 |
1.531 |
15.306 |
|
3 |
1.363 |
13.63 |
|
4 |
0.997 |
9.97 |
|
5 |
0.803 |
8.03 |
|
6 |
0.655 |
6.55 |
|
7 |
0.557 |
5.57 |
|
8 |
0.539 |
5.39 |
|
9 |
0.336 |
3.36 |
|
10 |
0.267 |
2.67 |
Sources: Banks and Wilson 2020; START 2020; Center for Systemic Peace 2020.
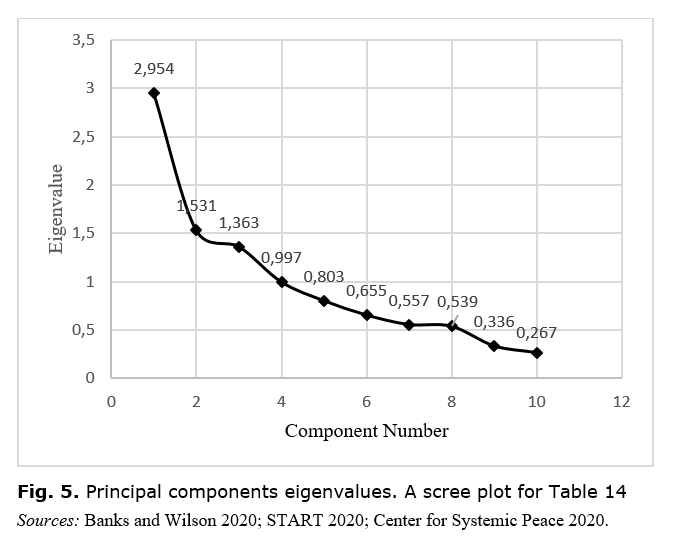
The principal components analysis, with factors rotated by varimax method, yields the following results for Western Europe in 1970–2018 (see Table 15).
Table 15. Loadings of principal components for Western Europe (1970–2018)
|
Political instability indicators |
PC1 |
PC2 |
PC3 |
PC4 |
|
Cnts_domestic1 (Assassinations) |
–0.007 |
0.572 |
0.003 |
0.538 |
|
Cnts_domestic2 (General strikes) |
0.748 |
0.015 |
–0.043 |
0.210 |
|
Cnts_domestic3 (Guerrilla warfare) Number of Terror Attacks Number of Killed |
0.535 |
0.463 0.878 0.835 |
0.144 –0.034 0.022 |
–0.125 0.100 –0.093 |
|
0.178 0.073 |
||||
|
Cnts_domestic4 (Governmental crisis) |
0.176 |
–0.061 |
0.057 |
0.802 |
|
Cnts_domestic5 (Repressions) |
0.037 |
–0.025 |
0.881 |
–0.111 |
|
Cnts_domestic6 (Riots) Coups and Coup Attempts |
0.825 |
0.143 0.065 |
0.037 |
0.074 |
|
0.013 |
0.674 |
0.445 |
||
|
Cnts_domestic8 (Anti-government demonstrations) |
0.848 |
0.069 |
0.021 |
0.018 |
Predictably, the world-system center represented by Western European countries, is still 30 % much more vulnerable to ‘mass protest destabilization’ type rather than to ‘armed destabilization’ which constitutes half of the first component (15 %). It is predictable that the ‘armed destabilization’ is especially typical for Western Europe before the 21st century as well as elite destabilization type after the last democratic transitions occurred in 1975 in the region.[10] These hypotheses may be proved after splitting the sample into the two periods before and after 2011 (see Tables 16 and 17).
Table 16. Principal components eigenvalues for Western Europe for the periods before and after the Arab Spring
|
1970–2010 |
2011–2018 |
||||
|
Component number |
Eigenvalue |
% of Variance |
Component number |
Eigenvalue |
% of Variance |
|
1 |
3.094 |
30.94 |
1 |
3.191 |
39.88 |
|
2 |
1.477 |
14.77 |
2 |
1.278 |
15.98 |
|
3 |
1.095 |
10.95 |
3 |
1.122 |
14.02 |
|
4 |
0.941 |
9.41 |
4 |
0.814 |
10.18 |
|
5 |
0.876 |
8.76 |
5 |
0.588 |
7.35 |
|
6 |
0.637 |
6.37 |
6 |
0.451 |
5.64 |
|
7 |
0.622 |
6.22 |
7 |
0.316 |
3.95 |
|
8 |
0.571 |
5.72 |
8 |
0.240 |
3 |
|
9 |
0.443 |
4.34 |
|
|
|
|
10 |
0.243 |
2.43 |
|
|
|
Sources: Banks and Wilson 2020; START 2020; Center for Systemic Peace 2020.
The principal components analysis, with factors rotated by varimax method, yields the following results for Western Europe in 1970–2010 and 2011–2018 (see Table 17).
Table 17. Loadings of principal components for Western Europe for the periods before and after the Arab Spring[11]
|
Political instability |
1970–2010 |
2011–2018 |
||||
|
PC1 |
PC2 |
PC3 |
PC1 |
PC2 |
PC3 |
|
|
1 |
2 |
3 |
4 |
5 |
6 |
7 |
|
Cnts_domestic1 (Assassinations) |
0.522 |
0.295 |
0.091 |
–0.027 |
–0.119 |
0.866 |
Continuation of the Table
|
1 |
2 |
3 |
4 |
5 |
6 |
7 |
|
Cnts_domestic2 (General strikes) |
0.147 |
0.710 |
–0.072 |
0.817 |
0.166 |
–0.123 |
|
Cnts_domestic3 (Guerrilla warfare) |
0.615 |
0.166 |
0.129 |
0.367 |
0.712 |
0.281 |
|
Number of Terror Attacks |
0.880 |
0.163 |
–0.058 |
0.302 |
0.430 |
0.638 |
|
Number of Killed |
0.844 |
–0.035 |
–0.040 |
0.093 |
0.789 |
–0.108 |
|
Cnts_domestic4 (Governmental crisis) |
–0.089 |
0.690 |
0.123 |
0.569 |
–0.484 |
–0.088 |
|
Cnts_domestic5 (Purges) |
0.018 |
–0.042 |
0.829 |
|
|
|
|
Cnts_domestic6 (Riots) |
0.338 |
0.594 |
0.102 |
0.759 |
0.222 |
0.372 |
|
Coups and Coup Attempts |
0.061 |
0.230 |
0.745 |
|
|
|
|
Cnts_domestic8 |
0.304 |
0.658 |
0.148 |
0.720 |
0.256 |
0.395 |
Sources: Banks and Wilson 2020; START 2020; Center for Systemic Peace 2020.
In fact, Tables 16, 17 suggest that for Western Europe before the Arab Spring, PC1, although not that obviously like for MENA sample, represents armed destabilization with the highest loadings for assassinations, guerilla warfare, number of terror attacks, number of people killed in terror attacks, accompanied by riots and anti-government demonstrations. This component explains 30 % of variance. Mass protest destabilization indicator is represented by PC2 which does not explain even 15 % of variance and besides general strikes, riots and anti-government demonstrations is accompanied by assassinations and governmental crisis indicators.[12]
The results for the period after the Arab Spring are different as, obviously, PC1 swamps with PC2, so the highest loadings of PC1 reflect mass protest destabilization and are driven by general strikes, riots and anti-government demonstrations. The armed destabilization component for Western Europe for 2011–2018 splits into two while we observe no pronounced elite destabilization PC for the region after 2011.
On the whole, Western Europe is predictably more unstable than MENA in terms of mass protest destabilization which is accompanied by governmental crises whereas no purges/mass repressions are observed for the region after 2010 while this indicator becomes the key contributor for MENA (and the Afrasian instability macrozone, as a whole) after the Arab Spring.
South America
At the next stage, we replicate the same tests for the South America region. In Table 18 we identify the main types of instability for the region using the principal components analysis for 1970–2018.
Table 18. Principal components eigenvalues for South America (1970–2018)
|
Component number |
Eigenvalue |
% of Variance |
|
1 |
2.198 |
21.99 |
|
2 |
1.956 |
19.56 |
|
3 |
1.336 |
13.36 |
|
4 |
1.034 |
10.34 |
|
5 |
0.896 |
8.96 |
|
6 |
0.785 |
7.85 |
|
7 |
0.725 |
7.25 |
|
8 |
0.648 |
6.48 |
|
9 |
0.295 |
2.95 |
|
10 |
0.127 |
1.27 |
Sources: Banks and Wilson 2020; START 2020; Center for Systemic Peace 2020.
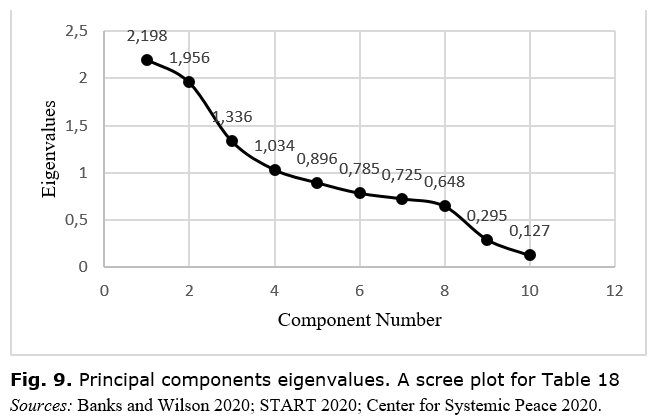
Table 19. Loadings of principal components for South America (1970–2018)
|
Political instability indicators |
PC1 |
PC2 |
PC3 |
PC4 |
|
Cnts_domestic1 (Assassinations) |
0.566 |
0.019 |
0.076 |
0.338 |
|
Cnts_domestic2 (General strikes) |
0.099 |
0.479 |
0.416 |
–0.369 |
|
Cnts_domestic3 (Guerrilla warfare) Number of Terror Attacks Number of Killed |
0.199 |
0.413 0.057 –0.009 |
0.093 –0.018 0.011 |
–0.176 –0.100 –0.100 |
|
0,930 0,918 |
||||
|
Cnts_domestic4 (Governmental crisis) |
0.079 |
0.119 |
0.768 |
0.004 |
|
Cnts_domestic5 (Repressions) |
0.008 |
0.116 |
0.155 |
0.839 |
|
Cnts_domestic6 (Riots) Coups and Coup Attempts |
–0.040 –0.056 |
0.876 |
–0.033 |
0.182 0.177 |
|
–0.091 |
0.777 |
|||
|
Cnts_domestic8 (Anti-government demonstrations) |
–0.083 |
0.852 |
–0.018 |
0.132 |
Sources: Banks and Wilson 2020; START 2020; Center for Systemic Peace 2020.
Tables 18 and 19 show that as well as for MENA, PC1 for South America reflects armed destabilization type factor with typical ‘armed’ indicators (see Table 6) like assassinations, number of terror attacks and number of people killed in them. PC2 also deals with ‘typical’ (see Table 6) mass protest instability indicators involving general strikes, riots and anti-government demonstrations, so this component may be called ‘mass protest destabilization’ type. ‘Elite destabilization’ in South America is divided into PC3 and PC4 and has its own unusual features because of the region history.
At the next stage, we investigate what happens after the observation period is divided into two parts – before and after the Arab Spring.
Table 20. Principal components eigenvalues for South America for the periods before and after the Arab Spring
|
1970–2010 |
2011–2018 |
||||
|
Component |
Eigenvalue |
% of variance |
Component number |
Eigenvalue |
% of variance |
|
1 |
2 |
3 |
4 |
5 |
6 |
|
1 |
2.530 |
25.30 |
1 |
2.656 |
29.52 |
|
2 |
1.931 |
19.31 |
2 |
2.069 |
22.97 |
Continuation of the Table
|
1 |
2 |
3 |
4 |
5 |
6 |
|
3 |
1.286 |
12.86 |
3 |
1.304 |
14.49 |
|
4 |
0.988 |
9.88 |
4 |
0.994 |
11.05 |
|
5 |
0.829 |
8.29 |
5 |
0.648 |
7.2 |
|
6 |
0.705 |
7.05 |
6 |
0.583 |
6.47 |
|
7 |
0.693 |
6.93 |
7 |
0.441 |
4.9 |
|
8 |
0.5 |
5 |
8 |
0.257 |
2.86 |
|
9 |
0.417 |
4.17 |
9 |
0.050 |
0.553 |
|
10 |
0.121 |
1.21 |
|
|
|
Sources: Banks and Wilson 2020; START 2020; Center for Systemic Peace 2020.
Table 21. Loadings of principal components for South America for the periods before and after the Arab Spring
|
Political
|
1970–2010 |
2011–2018 |
||||||
|
PC1 |
PC2 |
PC3 |
PC4 |
PC1 |
PC2 |
PC3 |
PC4 |
|
|
Cnts_domestic1 (Assassinations) |
0.515 |
0.102 |
–0.024 |
0.500 |
0.087 |
0.001 |
0.858 |
–0.065 |
|
Cnts_domestic2 (General strikes) |
0.134 |
0.610 |
0.280 |
–0.273 |
0.285 |
0.645 |
–0.241 |
–0.300 |
|
Cnts_domestic3 (Guerrilla warfare) |
0.488 |
0.056 |
0.500 |
0.367 |
0.772 |
0.237 |
–0.131 |
–0.032 |
|
Number of Terror Attacks |
0.925 |
0.030 |
–0.026 |
–0.050 |
0.955 |
0.003 |
0.007 |
–0.024 |
|
Number of Killed |
0.920 |
–0.040 |
0.023 |
–0.084 |
0.950 |
–0.057 |
0.102 |
–0.030 |
|
Cnts_domestic4 (Governmental crisis) |
0.089 |
0.316 |
0.733 |
0.069 |
–0.029 |
0.084 |
–0.081 |
0.956 |
|
Cnts_domestic5 (Repressions) |
–0.108 |
0.023 |
0.145 |
0.800 |
–0.100 |
0.235 |
0.751 |
–0.002 |
|
Cnts_domestic6 (Riots) |
–0.004 |
0.784 |
0.024 |
0.256 |
0.058 |
0.853 |
0.207 |
0.066 |
|
Coups and Coup Attempts |
–0.113 |
–0.059 |
0.785 |
0.044 |
|
|
|
|
|
Cnts_domestic8 (Anti-govern- |
–0.043 |
0.828 |
0.017 |
0.017 |
–0.062 |
0.834 |
0.221 |
0.209 |
Sources: Banks and Wilson 2020; START 2020; Center for Systemic Peace 2020.
After dividing the observation period into two (before and after the Arab Spring) we see that 2011 phenomena had an effect on the socio-political dynamics of South America countries: the percent of variance for all three types of destabilization sharply grew. Like for MENA countries, PC1 for the both periods is defined as armed destabilization component which comprises 26–30 % of variance explained, mass protest destabilization (PC2) comprises 19–23 % of variance and elite destabilization (PC3 and PC4) makes 13–24 % of variance explained.
Before 2011, PC1 highest loading indicators are the same as for MENA, for example assassinations, guerilla warfare, number of terror attacks and number of people killed in terror attacks (see Table 4). PC2 includes typical indicators (see Table 6) set which consists of general strikes, riots and anti-government demonstrations.
Since 2011, PC1 for South America which reflects armed destabilization is accompanied by general strikes instead of assassinations; one could also observe some growth for assassinations, guerilla warfare, number of terror attacks and number of people killed in terror attacks indicators values, the largest escalation is noticed for guerilla warfare (from 0.490 to 0.771). Small growth of PC2 (mass protest destabilization) key indicators (general strikes, riots and anti-government demonstrations) is observed. One should note that although South America is the ‘semi-periphery’ zone of the World-System, like MENA region, its PC2 does not include ‘purges/mass repressions’ indicator which MENA PC2 (‘mass protest’ destabilization component) does.
Sub-Saharan Africa
At the next stage, we replicate the same tests for Sub-Saharan Africa. In Table 22 we identify the main principal components (types of instability) for the region for 1970–2018.
Table 22. Principal component eigenvalues for Sub-Saharan Africa (1970–2018)
|
Component number |
Eigenvalue |
% of
Variance |
|
1 |
3.209 |
32.09 |
|
2 |
1.653 |
16.52 |
|
3 |
1.395 |
13.95 |
|
4 |
0.970 |
9.7 |
|
5 |
0.765 |
7.65 |
|
6 |
0.703 |
7.03 |
|
7 |
0.654 |
6.54 |
|
8 |
0.289 |
2.89 |
|
9 |
0.197 |
1.97 |
|
10 |
0.164 |
1.64 |
Sources: Banks and Wilson 2020; START 2020; Center for Systemic Peace 2020.
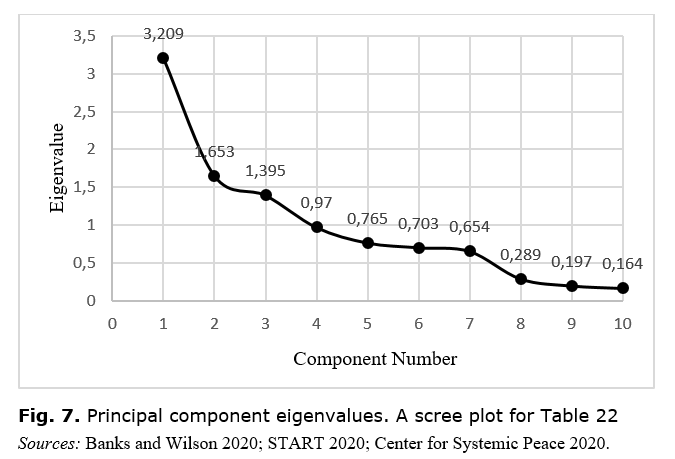
Table 23. Loadings of principal components for Sub-Saharan Africa (1970–2018)
|
Political instability indicators |
PC1 |
PC2 |
PC3 |
PC4 |
|
Cnts_domestic1 (Assassinations) |
0.139 |
0.003 |
0.731 |
0.222 |
|
Cnts_domestic2 (General strikes) |
0.039 |
0.700 |
0.048 |
0.154 |
|
Cnts_domestic3 (Guerrilla warfare) Number of Terror Attacks Number of Killed |
0.918 0.888 0.939 |
0.123 0.280 0.048 |
0.047 0.071 0.038 |
–0.020 –0.033 0.019 |
|
Cnts_domestic4 (Governmental crisis) |
–0.031 |
0.184 |
0.022 |
0.773 |
|
Cnts_domestic5 (Repressions) |
–0.022 |
0.103 |
0.844 |
–0.022 |
|
Cnts_domestic6 (Riots) Coups and Coup Attempts |
0.105 0.002 |
0.856 |
0.084 0.146 |
–0.028 |
|
–0.067 |
0.757 |
|||
|
Cnts_domestic8 (‘Anti-government demonstrations’) |
0.283 |
0.835 |
–0.006 |
–0.008 |
Sources: Banks and Wilson 2020; START 2020; Center for Systemic Peace 2020.
Tables 22 and 23 show that Sub-Saharan Africa is the leader among the four regions analyzed in terms of percentage of variance by type of armed destabilization over 1970–2018, accounting for 32 % of the explained variance, which is 2 % higher than for MENA. PC1 includes the highest loadings for guerilla warfare, number of terror attacks and number of people killed in terror attacks indicators which are ‘typical’ for this type of destabilization for the world sample (see Table 6).
Mass protest destabilization (PC2) explains only 16 % of variance which is the lowest result for all the four regions. PC2 includes the highest loadings for general strikes, riots and anti-government demonstrations which are ‘typical’ for the mass protest type of instability for the world sample.
The test results with the observation period divided into two are presented in Tables 24 and 25.
Table 24. Principal components eigenvalues for Sub-Saharan Africa for the periods before and after the Arab Spring
|
1970–2010 |
2011–2018 |
||||
|
Component |
Eigenvalue |
% of Variance |
Component number |
Eigenvalue |
% of Variance |
|
1 |
2.625 |
26.25 |
1 |
3.339 |
33.4 |
|
2 |
1.486 |
16.82 |
2 |
1.790 |
17.91 |
|
3 |
1.270 |
12.70 |
3 |
1.511 |
15.11 |
|
4 |
0.972 |
9.72 |
4 |
0.971 |
9.71 |
|
5 |
0.866 |
8.66 |
5 |
0.783 |
7.83 |
|
6 |
0.762 |
7.62 |
6 |
0.541 |
5.71 |
|
7 |
0.738 |
7.39 |
7 |
0.462 |
4.63 |
|
8 |
0.677 |
6.77 |
8 |
0.289 |
2.9 |
|
9 |
0.396 |
3,96 |
9 |
0.154 |
1.54 |
|
10 |
0.208 |
2.08 |
10 |
0.129 |
1.3 |
Sources: Banks and Wilson 2020; START 2020; Center for Systemic Peace 2020.
Table 25. Loadings of principal components for Sub-Saharan Africa for the periods before and after the Arab Spring
|
Political instability indicators |
1970–2010 |
2011–2018 |
||||||
|
PC1 |
PC2 |
PC3 |
PC4 |
PC1 |
PC2 |
PC3 |
PC4 |
|
|
1 |
2 |
3 |
4 |
5 |
6 |
7 |
8 |
9 |
|
Cnts_domestic1 (Assassinations) |
0.059 |
0.123 |
0.638 |
0.224 |
0.261 |
–0.026 |
0.759 |
–0.051 |
|
Cnts_domestic2 (General strikes) |
0.412 |
0.391 |
0.073 |
0.331 |
0.015 |
0.801 |
–0.050 |
0.011 |
|
Cnts_domestic3 (Guerrilla warfare) |
0.005 |
0.232 |
0.707 |
–0.170 |
0.920 |
0.163 |
0.056 |
–0.028 |
|
Number |
0.369 |
0.779 |
0.059 |
–0.032 |
0.919 |
0.229 |
0.067 |
–0.035 |
Continuation of the Table
|
1 |
2 |
3 |
4 |
5 |
6 |
7 |
8 |
9 |
|
Number |
–0.076 |
0.848 |
0.098 |
–0.034 |
0.951 |
0.047 |
0.035 |
0.011 |
|
Cnts_domestic4 (Governmental crisis) |
0.142 |
0.085 |
0.104 |
0.736 |
–0.029 |
0.120 |
–0.021 |
0.944 |
|
Cnts_domestic5 (Repressions) |
0.065 |
–0.143 |
0.682 |
0.207 |
–0.043 |
0.105 |
0.791 |
–0.202 |
|
Cnts_dome |
0.908 |
0.085 |
0.077 |
–0.009 |
0.127 |
0.869 |
0.072 |
0.064 |
|
Coups and Coup Attempts |
–0.052 |
–0.042 |
0.094 |
0.750 |
–0.053 |
–0.077 |
0.640 |
0.227 |
|
Cnts_domestic8 (Anti-government demonstrations) |
0.923 |
0.072 |
0.027 |
0.070 |
0.302 |
0.819 |
–0.015 |
0.072 |
Sources: Banks and Wilson 2020; START 2020; Center for Systemic Peace 2020.
Tables 24 and 25 demonstrate that after dividing the observation period into two (before and after the Arab Spring) the percentage of variance explained by armed destabilization reaches its all-time highs of 33 % for 2011–2018 period for the Sub-Saharan Africa countries. The differences in percent of values of the principal components for the region before and after the Arab Spring show that the 2011 phenomena for Sub-Saharan region resulted predominantly in the escalation of armed destabilization while a relatively small mass protest destabilization escalation is observed.
It must be noted that before 2011 PC1 for Sub-Saharan Africa has the highest loadings of mass protest destabilization indicators (which is not typical for MENA region, MENA PC1 reflects armed destabilization) and includes general strikes, riots and anti-government demonstrations accompanied by number of terror attacks indicator, which is a unique feature for Sub-Saharan region (where, in fact, the first PC turns out to be a mixture of the mass protest and armed destabilization). One can state that the presence of number of terror attacks among the significant contributors to mass protest destabilization for Sub-Saharan Africa before 2011 suggests that the mass protest destabilization in that part of the world was of a rather special type involving a rather substantial violent component.
The second principal component before 2011 comes as armed destabilization with its highest values of guerilla warfare, number of terror attacks, number of people killed in terror attacks and general strikes, which is not typical for other regions either.
After 2011, Sub-Saharan Africa principal components coincide with MENA's, with armed destabilization type coming as PC1, followed by mass pro-test destabilization as PC2. Strong loadings escalation for armed destabilization indicators is observed after 2011. It also includes assassinations and anti-government demonstrations after 2011, but no longer includes general strikes.
It is interesting that PC2 indicators set after 2011 is the same as before the Arab Spring for Sub-Saharan Africa region (of a special interest is that the number of terrorist attacks remains among significant contributors to mass protest destabilization).[13]
Discussion
Using the tests results above on the percent of variance explained by each type of socio-political instability factor for the abovementioned four world-system regions in 1970–2018 (see Tables 10, 14, 18, and 22), it is possible to provide the next general comparisons (see Figs 8 and 9).
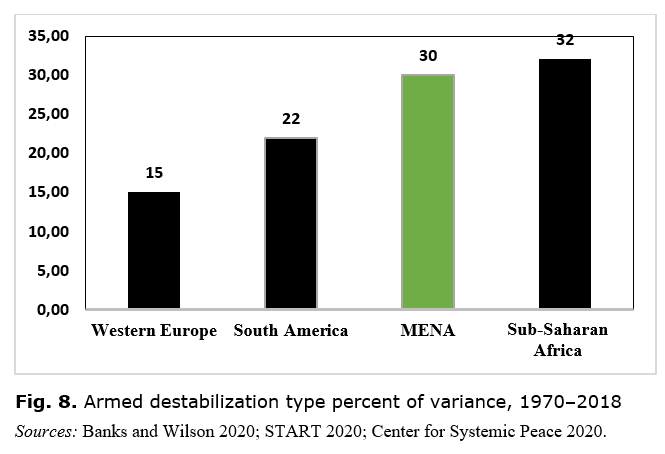
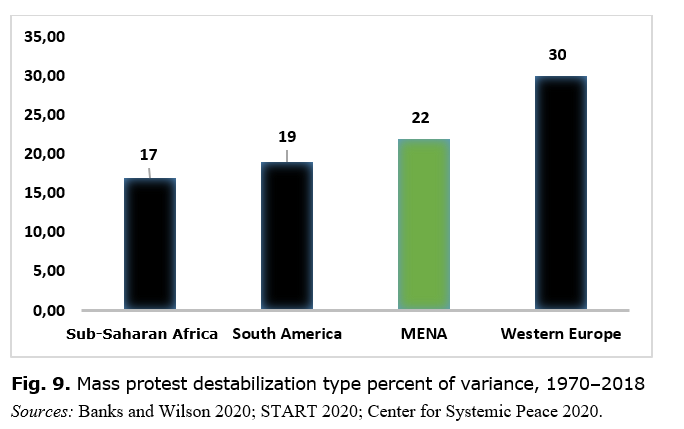
From the figures above one can conclude that armed and mass protest destabilization types in MENA for 1970–2018 together cover the largest percent of variance explained among the four analyzed regions (52 %), which proves our first hypothesis that MENA region as a ‘semi-periphery’ world-system zone turns out to be the most socio-politically unstable region in the world. The MENA region is followed by Sub-Saharan Africa (49 %), Western Europe (45 %) and South America (41 %), which shows that South America, on the contrary, being a ‘semi-periphery zone’ as well as MENA, is the least unstable region among the abovementioned four.[14]
Socio-political destabilization characteristics of the MENA region can be described by a relatively high armed destabilization level accompanied by a relatively high mass protest destabilization level. For Sub-Saharan Africa, the highest level of armed destabilization type is accompanied by the lowest level of mass protest destabilization rate. On the contrary, for Western Europe, the highest level of mass protest destabilization is accompanied by the lowest level of armed destabilization type. Finally, South America is characterized by intermediate levels of armed and mass protest destabilization.
Conclusions
The present paper aims to determine MENA's (and the Afrasian instability zone as a whole) place in the hierarchy of the most destabilized regions of the World System for the observation period including the phase after the Arab Spring (2011–2018) as well as before 2011 and to investigate the region's unique destabilization peculiarities.
Our analysis based on CNTS, Global Terrorism and Center for Systemic Peace databases shows that some MENA countries which belong to MENA ‘semi-periphery’ world-system zone are on the list of top-20 most violently destabilized states of the world for the period of 1970–2018: together with Pakistan, Nigeria, and Mali (that belong to the Afrasian instability macrozone) their values comprise more than 70 % of the total values. In MENA, armed destabilization serious escalation predictably occurred after 2011, when countries in this region account for 66 % of factor score values of the top-20 violently destabilized states of the world.
In addition, our principal component analysis allows defining the following important patterns in the development of socio-political destabilization in the MENA region.
Firstly, regarding armed destabilization in MENA, one can observe the decline of the role of assassinations indicator for the region after 2010 and the increase of importance of the guerilla warfare indicator.
Secondly, regarding mass protest destabilization peculiarities in MENA, it is found that after 2010 one could identify the increasing significance of general strikes and anti-government demonstrations in comparison with the period before the Arab Spring and appearance of purges/repressions as a significant contributor to the abovementioned component for the region after 2010. The high values of the purges/repressions indicator loadings are typical both for the general observation period (1970–2018) and for the period after the Arab Spring (since 2011), while for other regions the loading values of this indicator are insignificant (South America and Sub-Saharan Africa) or even insignificant and negative (Western Europe for 1970–2018 and 1970–2010 observation periods; for 2011–2018 this indicator is equal to 0). This appears to imply that in the MENA region (and in the Afrasian instability zone as a whole) protests are accompanied by mass repressions much more systematically than in the other parts of the world. On the other hand, we find the presence of number of terror attacks among the significant contributors to mass protest destabilization for Sub-Saharan Africa, which suggests that this destabilization in that part of the world is of a rather special type involving a very substantial violent component.
Finally, one should note that for MENA while the percentage of variance ex-plained for armed destabilization before and after the Arab Spring remained almost unchanged (from 28.43 % to 29.91 %), the value growth for mass protest destabilization is very significant: from 18.15 % to 23.87 %. For Western Europe, the mass protest destabilization component explains a much higher percentage of variance than the same MENA factor for 1970–2018 (30 % and 22 % respectively) while Sub-Saharan Africa armed destabilization component explains a slightly higher percentage of variance than the same MENA factor for the same observation period (32 % and 30 % respectively). However, MENA turns out to be the most destabilized region taking mass protest and armed destabilization factors together (52 % of variance explained) for 1970–2018. South America's both mass protest and armed destabilization dimensions are smaller than MENA's for 1970–2018.
In general, we found that the highest percentage of the destabilization variance is explained by the mass protest principal component for the world-system core (represented by Western Europe). On the other hand, the lowest percentage of the destabilization variance is explained by the armed destabilization principal component precisely for this part of the world.
We also found that the highest percentage of the destabilization variance is explained by the armed principal component for the world-system periphery (represented by Sub-Saharan Africa). On the other hand, the lowest percent of the destabilization variance is explained by the mass protest destabilization principal component precisely for Sub-Saharan Africa.
The world-system semi-periphery appears here in between those poles. The MENA region (which is the core of the Afrasian instability macrozone) occupies the second highest places in terms of both mass protest and armed destabilization, thus displaying very high levels of both (whereas South America occupies an intermediate place between MENA and Western Europe).
References
Akaev A., Korotayev A., Issaev L. and Zinkina J. 2017. Technological Development and Protest Waves: Arab Spring as a Trigger of the Global Phase Transition? Technological Forecasting and Social Change 116: 316–321.
Alesina A., Ozler S., Roubini N., and Swagel P. 1996. Political Instability and Economic Growth. Journal of Economic Growth 1(2): 189–211.
Banks A., and Wilson K. 2020. Cross-National Time-Series Data Archive. Jerusalem, Israel: Databanks International. URL: http://www.databanksinternational.com.
Benson M., and Kugler J. 1998. Power Parity, Democracy, and the Severity of Internal Violence. Journal of Conflict Resolution 42(2): 196–209.
Bilyuga S. 2017. Type of Regime and Indices of Sociopolitical Instability: A Quantitative Analysis. Sravnitelnaya Politika 8: 95–112. In Russian (Билюга С. Тип режима и индексы социально-политической нестабильности опыт количественного анализа. Сравнительная политика 8: 95–112).
Bilyuga S., Shishkina A., Zinkina J., and Korotayev A. 2016. Global Correlation between GDP Per Capita and the Level of Sociopolitical Destabilization between 1960 and 2014: A Preliminary Quantitative Analysis. Globalistics and Globalization Studies / Ed. by L. E. Grinin, I. V. Ilyin, P. Herrmann, and A. V. Korotayev, pp. 213– 219. Volgograd: Uchitel.
Butenschȍn N. 2015. Arab Citizen and the Arab State: The ‘Arab Spring’ as a Critical Juncture in Contemporary Arab Politics. Democracy and Security 11: 111–128.
Cattell R. 1966. The Scree Test for the Number of Factors. Multivariate Behavioural Research 1(2): 245–276.
Celestino M., and Gleditsch K. S. 2013. Fresh Carnations or All Thorn, No Rose? Nonviolent Campaigns and Transitions in Autocracies. Journal of Peace Research 50(3): 385–400.
Center for Systemic Peace. 2020. Coups d'Etat 1946–2018. Vienna, VA: Center for Sys-temic Peace. URL: http://www.systemicpeace.org/inscr/CSPCoupsAnnualv2018.xls.
de Haan J. 2007. Political Institutions and Economic Growth Reconsidered. Public Choice 131(3–4): 281–292.
Flanigan W., and Edwin F. 1970. Patterns of Political Violence in Comparative Historical Perspective. Comparative Politics 3(1): 1–20.
Grinin L., and Korotayev A. 2012. Does ‘Arab Spring’ Mean the Beginning of World System Reconfiguration? World Futures 68: 471–505.
Grinin L. E., and Korotayev A. V. 2015. Great Divergence and Great Convergence. A Global Perspective. Cham: Springer International Publishing.
Grinin L., Issaev L., and Korotayev A. 2016. Revolutions and Instability in the Middle East. Moscow: Uchitel. In Russian (Гринин Л., Коротаев А. Революции и нестабильность на Ближнем Востоке. М.: Учитель).
Grinin L., Korotayev A., and Tausch A. 2019. Islamism, Arab Spring, and the Future of Democracy. World System and World Values Perspectives. Cham: Springer.
Gurr T., and Lichbach M. 1986. Forecasting Internal Conflict: A Competitive Evaluation of Empirical Theories. Comparative Political Studies 19(1): 3–38.
Hibbs D. 1973. Mass Political Violence: A Cross-National Causal Analysis. New York: Wiley.
Hussain M., and Howard P. 2013. What Best Explains Successful Protest Cascades? ICTs and the Fuzzy Causes of the Arab Spring. International Studies Review 15(1): 48–66.
Jong-A-Pin R. 2009. On the Measurement of Political Instability and Its Impact on Economic Growth. European Journal of Political Economy 25(1): 15–29.
Khokhlov N., Vasiliev A., Belichenko A., Kirdyankina P., and Korotayev A. 2021. Echo of Arab Spring in Western Europe: A Quantitative Analysis. Mezhdunarodnye Protsessy 19(2): 21–49. Doi.org/10.17994/IT.2021.19.2.65.7.
Klomp J., and de Haan J. 2013. Political Regime and Human Capital: A Cross-Country Analysis. Social Indicators Research 111(1): 45–73.
Korotayev A., Bilyuga S., and Shishkina A. 2016. GDP Per Capita, Protest Intensity and Regime Type: A Quantitative Analysis. Sravnitelnaya Politika 7(4): 72–94. In Russian (Коротаев А., Билюга С., Шишкина А. ВВП на душу населения, уровень протестной активности и тип режима: опыт количественного анализа. Сравнительная политика 7(4): 72–94).
Korotayev A., Bilyuga S., and Shishkina A. 2017a. Economic Growth and Socio-Political Destabilization: A Global Analysis. Polis – Politicheskiye Issledovaniya 2: 155–169. In Russian (Коротаев А., Билюга С., Шишкина А. Экономический рост и социально-политическая дестабилизация: опыт глобального анализа Полис. Политические исследования 2: 155–169).
Korotayev A., Bilyuga S., and Shishkina A. 2017b. GDP Per Capita, Intensity of Anti-Government Demonstrations and Level of Education (Cross-National Analysis). Politiya 84(1): 127–143. In Russian (Коротаев А., Билюга С., Шишкина А. ВВП на душу населения, интенсивность антиправительственных демонстраций и уровень образования (Кросс-национальный анализ). Полития 84(1): 127–143).
Korotayev A., Bilyuga S., and Shishkina A. 2018. GDP Per Capita and Protest Activity: A Quantitative Reanalysis. Cross-Cultural Research 52(4): 406–440.
Korotayev A., Goldstone J. A., and Zinkina J. 2015. Phases of Global Demographic Transition Correlate with Phases of the Great Divergence and Great Convergence. Technological Forecasting and Social Change 95: 163–169.
Korotayev A., Grinin L., Malkov S. et al. 2021. Sociopolitical Destabilization in the Countries of the Afrasian Instability Macrozone: Quantitative Analysis and Risk Forecasting. Moscow: Lenand / URSS. In Russian (Коротаев А., Гринин Л., Малков С. Социально-политическая дестабилизация в странах Афразийской макрозоны нестабильности: количественный анализ и прогнозирование рисков. М.: Ленанд/ УРСС).
Korotayev A., Issaev L., Rudenko M., Shishkina A., and Ivanov E. 2016. Afrasian Instability Zone and Its Historical Background. Social Evolution & History 15(2): 120–140.
Korotayev A., Khodunov A., Burova A., Malkov S., Khalturina D., and Zinkina J. 2012. Socio-Demographic Analysis of the Arab Spring. System Monitoring of Global and Regional Risks / Ed. by A. V. Korotayev, J. V. Zinkina, and A. S. Khodunov, pp. 28–76. Moscow: LIBROKOM. In Russian (Коротаев А. В., Ходунов А. С., Бурова А. Н., Малков С. Ю., Халтурина Д. А., Зинькина Ю. В. Социально-демографический анализ Арабской весны. Системный мониторинг глобальных и региональных рисков / Ред. А. В. Коротаев, Ю. В. Зинькина, А. С. Ходунов, с. 28–76. М.: Либроком).
Korotayev A., and Khokhlova A. 2022. Effect of the Arab Spring on Stabilization Capacity of the MENA Monarchies. Journal of Asian and African Studies 57(2): 289–307.
Korotayev A., Khokhlova A., and Tsirel S. 2018. Unemployment as a Predictor of Socio-Political Destabilization in Western and Eastern Europe. Ekonomicheskaya Sotsiologiya 19(2): 118–167. In Russian (Коротаев А. В., Хохлова А., Цирель С. Безработица как предиктор социально-политической дестабилизации в странах Западной и Восточной Европы. Экономическая социология 19(2): 118–167).
Korotayev A., Medvedev I., and Zinkina J. 2022. Global Systems for Sociopolitical Instability Forecasting and Their Efficiency. A Comparative Analysis. Comparative Sociology 21(1): 64–104. Doi: 10.1163/15691330-bja10050.
Korotayev A., Meshcherina K., Issaev L., Iskoskov A., Hern W., Kulikova E. et al. 2016. Arab Spring as a Trigger of Global Socio-Political Destabilization: Experience of Systemic Analysis. System Monitoring of Global and Regional Risks: Arab Spring in Global Context / Ed. by L. Grinin, A. Korotayev, L. Issaev, and K. Mescheri-na, pp. 22–126. Volgograd: Uchitel. In Russian (Коротаев А. В., Мещерина К. В., Исаев Л. М., Искосков А. С., Херн У. Д., Куликова Е. Д. Системный мониторинг глобальных и региональных рисков: Арабская весна в глобальном контексте / Ред. Л. Е. Гринин, А. В. Коротаев, Л. М. Исаев, К. В. Мещерина, с. 22–126. Волгоград: Учитель).
Korotayev A., Meshcherina K., and Katkova V. 2019. Arab Spring and Its Echo in Sub-Saharan Africa: A Quantitative Analysis. Asia and Africa Today 1: 17–24. Doi.org/10.31857/S032150750003339-4.
Korotayev A., Meshcherina K., and Shishkina A. 2018. A Wave of Global Sociopolitical Destabilization of the 2010s: A Quantitative Analysis. Democracy and Security 14(4): 331–357.
Korotayev A., Romanov D., and Medvedev I. 2019. Echo of the Arab Spring in Eastern Europe: A Quantitative Analysis. Sotsiologicheskoye obozreniye 18(1): 31–81. Doi.org/10.17323/1728-192x-2019-1-56-106. In Russian (Коротаев А. В., Романов Д. М., Медведев И. А. Эхо Арабской весны в Восточной Европе: опыт количественного анализа. Социологическое обозрение 18(1): 31–81).
Korotayev A., Shishkina A., and Issaev L. 2016. Arab Spring as a Global Phase Transition Trigger. Polis. Politicheskiye Issledovaniya 3: 108–122. Doi.org/10.17976/ jpps/2016.03.09.
Korotayev A., Shishkina A., and Khokhlova A. 2022. Global Echo of the Arab Spring. Handbook of Revolutions in the 21st Century: The New Waves of Revolutions, and the Causes and Effects of Disruptive Political Change / Ed. by J. Goldstone, L. Grinin, and A. Korotayev, pp. 813–849. Cham: Springer. Doi.org/10.1007/ 978-3-030-86468-2_31.
Korotayev A., Shishkina A., and Lukhmanova Z. 2017. The Global Socio-Political Destabilization Wave of 2011 and the Following Years: A Quantitative Analysis. Polis. Politicheskiye Issledovaniya 6: 150–168. Doi.org/10.17976/jpps/2017.06.11. In Russian (Коротаев А. В., Шишкина А. Р., Лухманова З. Волна глобальной социально-политической дестабилизации 2011–2015 гг.: количественный анализ. Полис. Политические исследования 6: 150–168. Doi.org/10.17976/jpps/2017. 06.11).
Korotayev A., Sawyer P., Grinin L., Romanov D., and Shishkina A. 2020. Socio-Economic Development and Anti-Government Protests in the Light of a New Quantitative Analysis of Global Databases. Sotsiologicheskiy Zhurnal 26(4): 61–78. In Russian (Коротаев А. В., Сойер П., Гринин Л., Романов Д., Шишкина А. Социально-экономическое развитие и антиправительственные протесты в свете новых результатов количественного анализа глобальных баз данных. Cоциологический журнал 26(4): 61–78).
Korotayev A., Sawyer P., and Romanov D. 2021. Socio-Economic Development and Protests. A Quantitative Reanalysis. Comparative Sociology 20(2): 195–222.
Korotayev A., Vaskin I., and Bilyuga S. 2017. Olson-Huntington Hypothesis on a Bell-Shaped Relationship Between the Level of Economic Development and Sociopolitical Destabilization: A Quantitative Analysis. Sotsiologicheskoye Obozreniye 16(1): 9–49. In Russian (Коротаев А. В., Васькин И., Билюга С. Гипотеза Олсона-Хантингтона о криволинейной зависимости между уровнем экономического развития и социально-политической дестабилизацией: опыт количественного анализа. Социологическое обозрение 16(1): 9–49).
Korotayev A., Vaskin I., Bilyuga S., and Ilyin I. 2018. Economic Development and Sociopolitical Destabilization: A Re-Analysis. Cliodynamics 9(1): 59–118.
Korotayev A., Vaskin I., and Tsirel S. 2021. Economic Growth, Education, and Terrorism: A Re-Analysis. Terrorism and Political Violence 33(3): 572–595.
Korotayev A., and Zinkina J. 2011. Egyptian Revolution: A Demographic Structural Analysis. Entelequia. Revista Interdisciplinar 13: 139–169.
Korotayev A., and Zinkina J. 2022. Egypt's 2011 Revolution. A Demographic Structural Analysis. Handbook of Revolutions in the 21st Century: The New Waves of Revolutions, and the Causes and Effects of Disruptive Political Change / Ed. by J. Goldstone, L. Grinin, and A. Korotayev, pp. 651–683. Cham: Springer. Doi.org/ 10.1007/978-3-030-86468-2_25.
Korotayev A., Zinkina J., Bogevolnov J., and Malkov A. 2011. Global Unconditional Convergence among Larger Economies after 1998? Journal of Globalization Studies 2(2): 25–62.
Latif M. I., and Abbas H. 2011. US Democracy Promotion and Popular Revolutions in the Middle East: Challenges and Opportunities. Pakistan Horizon 64(3): 25–42.
Malik A., and Awadallah B. 2013. The Economics of the Arab Spring. World Development 45: 296–313.
Markakis D. 2015. US Democracy Promotion in the Middle East: The Pursuit of Hegemony. London: Routledge.
Ortmans O., Mazzeo E., Meshcherina K., and Korotayev A. 2017. Modeling Social Pressures toward Political Instability in the United Kingdom after 1960: A Demographic Structural Analysis. Cliodynamics 8(2): 113–158. Doi.org/10.21237/C7 clio8237313.
Perthes V. 2004. America's ‘Greater Middle East’ and Europe: Key Issues for Dialogue. Middle East Policy 11(3): 85–97.
Slinko E., Bilyuga S., Zinkina J. and Korotayev A. 2017. Regime Type and Political Destabilization in Cross-National Perspective: A Re-Analysis. Cross-Cultural Research 51(1): 26–50.
Slinko E., Meshcherina K., Shulgin S., Zinkina J., Bilyuga S. and Korotayev A. 2018. Measuring Internal Political Destabilization Processes: Types of Instability and Their Relationship with Socio-Political and Economic Factors. System Monitoring of Global and Regional Risks: Socio-Political and Economic Destabilization: An Analysis of Country and Regional Situations from a World-Systems Perspective / Ed. by L. Grinin, A. Korotayev, and K. Meshcherina, pp. 95–114. Volgograd: Uchitel. In Russian (Слинько Е. В., Мещерина К. В., Шульгин С. Г., Зинькина Ю. В., Билюга С. Э., Коротаев А. В. Измерение внутриполитических дестабилизационных процессов: типы нестабильности и их связь с социально-политическими и экономическими факторами. Системный мониторинг глобальных и региональных рисков: Социально-политическая и экономическая дестабилизация: анализ страновых и региональных ситуаций в мир-системном аспекте / Ред. Л. Е. Гринин, А. В. Коротаев, К. В. Мещерина, с. 95–114. Волгоград: Учитель).
START [National Consortium for the Study of Terrorism and Responses to Terrorism]. 2020. Global Terrorism Database. College Park, MD: National Consortium for the Study of Terrorism and Responses to Terrorism. URL: https://www.start.umd.edu/gtd/.
Steinert-Threlkeld Z. 2017. Spontaneous Collective Action: Peripheral Mobilization during the Arab Spring. American Political Science Review 111(2): 379–403.
Tanter R. 1966. Dimensions of Conflict Behavior within and between Nations, 1958–60. Journal of Conflict Resolution 10(1): 41–64.
Vaskin I., Tsirel S., and Korotayev A. 2018. Economic Growth, Education and Terrorism: Experience in Quantitative Analysis. Sotsiologicheskiy zhurnal 24(2): 28–65. Doi.org/10.19181/socjour.2018.24.2.5844. In Russian (Васькин И. А., Цирель С. В., Коротаев А. В. Экономический рост, образование и терроризм: опыт количественного анализа. Социологический журнал 24(2): 28–65. Doi.org/10.19181/ socjour.2018.24.2.5844).
Wallerstein I. 1974, 1980, 1988. The Modern World-System. 3 vols. New York: Academic Press.
Wallerstein I. 1979. The Capitalist World Economy. Cambridge: Cambridge University Press.
Wallerstein I. 1987. World-Systems Analysis. Social Theory Today / Ed. by A. Giddens, and J. H. Turner, pp. 309–324. Cambridge: Cambridge University Press.
Wallerstein I. 2004. World-Systems Analysis: An Introduction. Durham, NC: Duke University Press.
Wilson K. 2020. User's Manual. Cross-National Time-Series Data Archive. Jerusalem: Databanks International.
* This article is an output of a research project implemented as part of the Basic Research Program at the HSE University in 2023 with support of the Russian Science Foundation (Project № 19-18-00155).
[1] Since CNTS database lacks the data for 1940–1945 because of WWII.
[2] CNTS explicitly defines riots as mass protest actions involving violence, i.e. ‘any violent demonstration or clash of more than 100 citizens involving the use of physical force’ (Wilson 2020: 5).
[3] CNTS explicitly defines antigovernment demonstration as non-violent mass protest actions, i.e. ‘any peaceful public gathering of at least 100 people for the primary purpose of displaying or voicing their opposition to government policies or authority, excluding demonstrations of a distinctly anti-foreign nature’ (Ibid.).
[4] One should note that due to the fact that Global Terrorism Database starts from 1970, our second factor analysis covers the period between 1970 and 2018.
[5] Terrorist organization banned in Russia.
[6] Terrorist organization banned in Russia.
[7] PC3 consists of cnts_domestic1 (assassinations) and cnts_domestic4 (governmental crisis) indicators, while PC4 is presented by coups and coups attempts and repressions. Such a division of one component into two deserves a separate investigation, so we decided to concentrate only on mass protest and armed destabilization in this paper. Elite destabilization for all the regions will be discussed in another article.
[8] These indicators are of the typical mass protest destabilization according to the tests results for the whole world sample (see Tables 5 and 6).
[9] Since elite destabilization factor is divided into two components after 2011 (PC3 and PC4) with its own features as PC3 contains only assassinations and governmental crisis indicators while PC4 – repressions, riots and coups and coup attempts, we consider the problem of elite destabilization factor to be a topic for a separate research.
[10] Obviously, ‘elite destabilization’ type is represented by a high value of coups and coup attempts as the chronological framework covers the third wave of democratization in Europe of 1974–1975.
[11] Since purges, coups and coup attempts indicators are equal to 0 for Europe after 2011 one should exclude these indicators from the model for 2011–2018 observation period.
[12] Concerning elite destabilization type (PC3) in Western Europe in 1970–2010, it is important to note that it consists of high loadings for repressions and coups and coup attempts indicators – the variables which are absent for the same observations for 2011–2018.
[13] Elite destabilization for both observed periods is divided into two and has its own features.
[14] We believe these discrepancies deserve to be investigated in a separate study.