An Equation-Based Systems Approach to Modeling Punctuated Equilibria Apparent in the Macropattern of Urbanization over Time

Almanac: Globalistics and Globalization Studies Global Evolution, Historical Globalistics and Globalization Studies
This paper presents a detailed description and explanation of a model of punctuated growth as that pattern of growth is related to population size, carrying capacity, and level of technology. General limits to modeling are introduced to give context to the results of the model, and the model itself is a set of differential equations representing the relationships between the aforementioned variables. It is noted that the pattern of punctuated equilibrium, first introduced by Eldridge and Gould as it applies to speciation, occurs throughout natural processes. A description of the construction of the model, an intuitive construction, is given, the model is then used to generate results consistent with the occurrence of both punctuation and stasis, and a simple mechanism is proposed to explain the interaction between population size, carrying capacity, and level of technology that would then produce the pattern of punctuation over time. Finally, further modifications of the model to give greater reality to the results are pre-sented.
Keywords: punctuated equilibrium, stasis, macropattern, complex system.
Introduction
It has been shown that the macropattern of urbanization over recorded history and in fact extending somewhat beyond that 5000 year threshold exhibits discontinuous or punctuated change (Harper 2017). Modeling such a process, especially if the models being constructed are mathematical in nature, is more difficult than modeling continuous processes and the results are potentially more tenuous. As a consequence, the modeler of non-continuous processes has to be every bit as sensitive to the limitations of modeling in general as does the modeler of continuous processes.
One time in a class discussion a student of mine blurted out, ‘You can't do that!’, referring to an equation I was introducing the class to. His energetic rebuttal was based on the fact that the equation in question was an oversimplification of what he perceived to be a very complex process. The equation in question was the Verhulst/Logistic equation of limited population growth, and, yes, ‘You can do that!’, but with an understanding of the limits of the model being used. In general terms, all models are wrong or more appropriately, incomplete, however, if they were not incomplete, they would not be models but, rather, the real thing; it is the nature of their incompleteness that is important to understand. In one sense, models can be described as either too good to be true; the logistic equation fits here, or too true to be good; any explicitly narrow model tailored only to represent a very clearly defined process would fall into this category. More formally, it has been shown that models can be designed to meet any two of three conditions, that of being precise, being general, and being real (Levins 1968). Models can then be real and precise, the previous limited case, real and general, or general and precise, in other words, too good to be true… or real. A little reflection on any of the previous three pairs of conditions should reveal why the third condition cannot be met by a model addressing the previous two. The model to be proposed here is certainly precise and it is hoped has general application, but it will not address any of the details of reality. This implies that the model is too good to be true, but it most certainly has heuristic worth and, as pointed out by Peter Turchin repeatedly [1], the application of mathematics to the processes of human history has both supplementary and complementary worth and also provides a very effective and formal tool of analysis and prediction.
The pattern of punctuation identified within the macropattern of urbanization is not unique to natural processes. The Eldridge and Gould paper (1972) represents a paradigm shift in the understanding of the mode of evolution. Evolutionary change as represented in the fossil record was shown to be episodic in many instances, and their model of stasis punctuated by evolutionary change provides the basis for the interpretation of a similar pattern identified in urban evolution. Of specific interest here is the explanation of stasis as variation in the system, in their case, a biological species and in the case here the urbanized portion of the world-system population. While Eldridge and Gould also provided a mechanism for such punctuated change based on the theory of allopatric speciation, there is no default mechanism of urbanization that can be called on to provide an explanation of change in urbanization. However, the rudiments of a very general mechanism of punctuated change which can be applied to the historical pattern of urbanization will be presented below.
While Eldridge and Gould established the reality of punctuated equilibrium in speciation, a more general process has since been presented by the late Per Bak (1996) and a number of his collaborators, in particular, Flyvbjerg et al. (1993), and their research should be mentioned here, as it is applicable to complex systems in general. Basically, these researchers were able to show that a pattern of punctuated equilibrium in a simple computer-modeled system which is based on selective elimination and broad upgrade could also produce a punctuated pattern akin to the pattern of punctuated equilibrium identified by Eldridge and Gould. This model is essentially agent-based as opposed to equation-based and does not consider specific parameters such as those to be analyzed by the equation-based model proposed here.
There are three final points to be considered. First, is the level of model complexity used. It will be the intent of the modeling effort here to use as simple a model as will still yield functional results. Clearly, it is important to follow the admonition of Einstein and actually a host of others to be simple but not too simple. Then there is the reality of the status of scientific knowledge to consider. The vast majority of scientific knowledge is provisional knowledge, consistent with the evidence and models at hand but subject to adjustment and even rejection, as both the conceptual knowledge and data of (any given field of) science changes. Negative knowledge, what something is not then becomes a potential contributor to scientific advancement.
The final point of consideration is the composition and structure of the model itself, specifically which parameters and their interactions are to be modeled. The model presented here will consider three-component parameters: population size, the carrying capacity for that population, and the level of technology accessible to the population. One of the purposes of the paper is to show the impact of reciprocal interaction between subcomponents of the total system population in the light of both the level of technology available and the carrying capacity that both limits and is altered by interactions with the other components.
The specific model being investigated here is as follows:
|
dN1/dt = r1N1[K – (N1 + N2)], dN2/dt = r2N2[K – (N1 + N2)], r1 = r10 + aN2, r2 = r20 + bN1, dK/dt = (T – N)/K, and dT/dt = T/[K – (N1 + N2)], |
(1) (2)
(3) (4) |
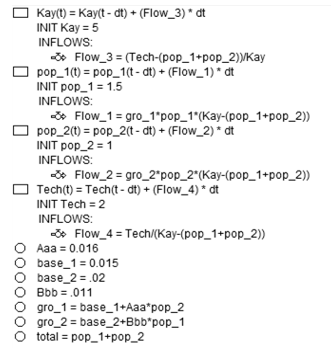
where N1 and N2 represent positively interacting populations, r1 and r2 represent the growth rates of the two populations, K is the carrying capacity, T represents the (relative) level of technological expertise of the associated population sizes and carrying capacity, a and b are tuned constants. (It is presumed that the notation, dN/dt et al., is understood to represent the rate of change of the variable in question over the change in time and that the equations are understood to be differential equations representing change in a given variable rather than the variable itself). In turn, the growth rates, r1 and r2, are a function of both a base rate of growth of their respective populations and also of positive feedback between the populations in this model. While systems of differential equations such as the one above are potentially solvable analytically, and insight may also be gained graphically via phase plane analysis, this model was investigated using, STELLA, a software explicitly designed to analyze differential equations.
The model was derived intuitively, and the motivation, explanation, and background for this intuition will now be given. The model was constructed keeping the following precepts in mind. First, the model was to be as simple as possible but still be functional. This is to say that it had to exhibit the characteristics of the phenomenon being modeled but at the same time have the minimal complexity necessary for exhibiting those characteristics. Second, since the phenomenon being modeled was the punctuated growth of the macropattern of urbanization over time, the model had to exhibit both phases of punctuation and intervening phases of stasis. Finally, since it has been clearly demonstrated that human population growth is hyperbolic and not simply exponential, hyperbolic growth had to be the mode of positive change in the face of both carrying capacity and technological limitations.
This last factor of hyperbolic growth will be considered first. In 1960 von Forester, Mora and Amiot were the first to demonstrate that human population growth was best modeled as a greater-than-exponential process. This was more lucidly and elegantly confirmed by the work of Korotayev, Malkov, and Khaltourina (2006) who showed that human population growth could be described by the differential equation, dN/dt = aN2, having the solution, Nt = C/(t0 – tn), where C is a fitted constant, t0 is the so-called doomsday date, and tn is some time prior to doomsday. A possible mechanism was proposed by Harper (n.d.), in which a two-population system was analyzed with each population contributing positively to the growth rate of the other population. It was then shown that the pattern of growth of such a system was greater-than-exponential. This feature of the model is incorporated in the equations, r1 = r10 + aN2 and r2 = r20 + bN1, representing the growth rates in the two-population system being analyzed here.
As this model has been analyzed numerically using the software program, STELLA, of which a flow chart and copy of the equations are included in an Appendix, the revealed aspects of punctuation and stasis, terms first coined by Eldridge and Gould (1972), emerged only as a result of running the simulation, i.e. punctuation and stasis are emergent phenomena occurring within the constraints of a limited range of variables. A priori, the aspects of punctuation and stasis were not predictable from analysis of the structure of the model. This has significant implications with respect to the general nature of the model and the three key variables, N, K, and T, i.e. population size, carrying capacity, and technology. The specifics of these implications will be treated further on in this paper. It is also of interest that this model is relatively simple, yet produces the structured results that it does.
With respect to the simplicity of the model, and excluding for the moment any further discussion of the embedded feature of hyperbolic growth, the model can be represented more generally by three equations:
|
dN/dt = rN(K – N), dK/dt = (T – N)/K, and dT/dt = T/(K – N), |
(5) (3) (6) |
where all symbols are identified as before. This reduced model is given here to emphasize the generality of these relationships. In particular, it should be noticed that the Eq. 6 focuses on two simple relationships, the difference between the magnitudes of technology and population, with technology as an upper limit to population, and the ratio of this difference to the magnitude of carrying capacity. This relationship implies that with increasing exploitation of technology, carrying capacity is reduced, i.e. the numerator shrinks with respect to the denominator. In turn, equation (6) also a ratio, consists of the magnitude of technology in the numerator being divided by the difference between carrying capacity and population size. In this instance, as population approaches its limit as defined by K, the magnitude of this ratio increases. This implies that as resources become scarce, improvements in technology will occur to (possibly) avert a crisis. These relationships, those of dK/dt and dT/dt, are stated as simply as possible with no other variables, no coefficients or exponents, to complicate interpretation of the behavior of the model. Also, equation (5) is a variant of the Verhulst/logistic equation in its simplest form, and is meant simply as a place-holder for the more elaborated form of population interaction given initially.
It should also be noted that the actual model being presented here represents a two-population model, clearly a simplification that is on the face of it, unrealistic. Let me explain. Were the model to represent more subdivisions of the population, that would violate my first precept, that the model be as simple as possible. Given this, of what use is a model that is admittedly unrealistic? First of all, in one sense all models are unrealistic in that they are incomplete. If models were not incomplete, they would not be models, they would be the real thing, the reality that is being modeled. It is then not that any given model is incomplete, but rather the concern is in what way is a given model incomplete. Using the simple dichotomy, models are either too good to be true or too true to be good, the model presented in this paper falls into the latter category; it is too good to be true. Another way of stating the limits on the model is to use Levin's tripartite condition for functional models. Models have imposed on them the conditions of generality, reality, and precision, only two of which can be met by any given model. So, if a model is general and precise, as the model presented in this paper is, then it cannot be real.
The previous discussion may explain why an unrealistic model can still have worth, but it does not explain in any depth what that worth is. Being able to produce general, precise results without having those results necessarily being realistic seems tantamount to the physicist's wont to analyze imaginary elephants sliding down frictionless planes. What can be learned from such an exercise? The answer, of course, is that the model has heuristic value, especially if the model can be shown to have universal value within, and this is not an oxymoronic statement, defined limits. In other words, if the triage of N, K, and T can be shown to have predictable behavior when interrelated in similar ways, this might or would imply that punctuation and stasis are expected properties of such systems.
Thus, the model presented here is a model of punctuation and stasis, not the model of punctuation and stasis. Yes, it is meant to represent the general behavior of populations, and more specifically urban populations, in relation to both their collective carrying capacity and also to the level of technology that these populations can both produce and also be constrained by, but this model also clearly has limits as previously stated. The model of Flyvbjerg et al. (1993) is an agent based model that also exhibits punctuation and stasis and does so in a quest for a system-limiting level known as self-organized criticality. The model investigated here is equation based and exhibits some of the same behavior, however, it has not been extensively enough investigated to show that it does have some upper limit. For the moment then, let us assume that it does not. Does this imply that this system predicts that repeated phases of punctuation and stasis will go on ad nauseam into the future? Possibly, but please remember that the model is not realistic but it does have the qualities of generality with respect to behavior. Consequently, the most important result to keep in mind is that the model does exhibit punctuation and stasis and does so as emergent properties of the model system and it is hoped also of the world system as it is represented by changes in urbanization over time.
Results
In this section the model will be put through its paces, first to show that it does exhibit punctuation and stasis, and then to show that it does so over a range of variable magnitudes. When running this system of equations on STELLA, the time step used was, dt = 1. This is in keeping with the nature of the actual data used to analyze the macropattern of urbanization over time. This implies that the computer model jumps from time step 1 to time step 2 and so forth, while it is clearly recognized that no such time saltation occurs in reality; this is to say that changes in the magnitude of urban area size with respect to population may result is saltatory changes in magnitude, but that is not a consequence of
a temporal saltation but rather the occurrence of a tipping point being exceed which in turn leads to a phase change in urban area magnitude, and in fact this is exactly what would be expected in reality and does in fact occur in the program itself, but at a low temporal resolution.
In Fig. 1 to follow population growth is the only variable represented and exhibits four abrupt changes in slope and four periods of stasis. When the plot of carrying capacity is added (see Fig. 2), this curve exhibits no abrupt changes in slope and no periods of stasis but does show changes in slope. However, when the plot of relative level of technology is included (see Fig. 3), it clearly exhibits both periods of stasis and also of punctuation of stasis. With regard to this system of equations then punctuated equilibrium is unquestionably an emergent phenomenon of the system. It will also be shown that the system is [relatively] sensitive to initial conditions, however, it appears not to be bounded and consequently will not exhibit chaotic behavior.
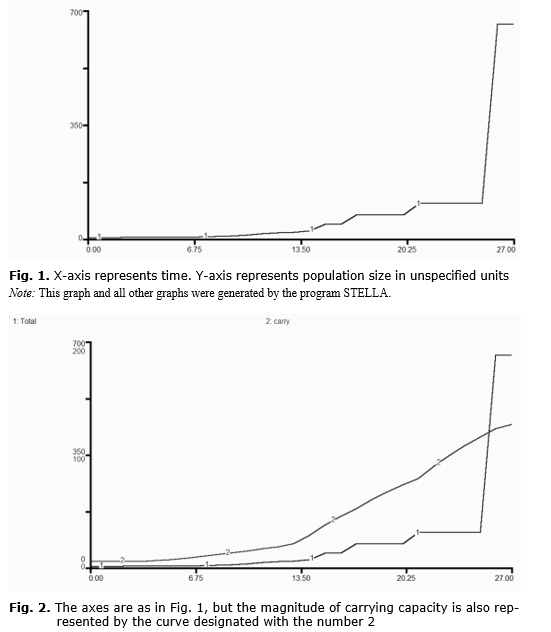
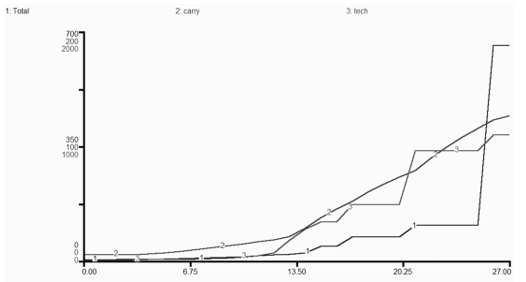
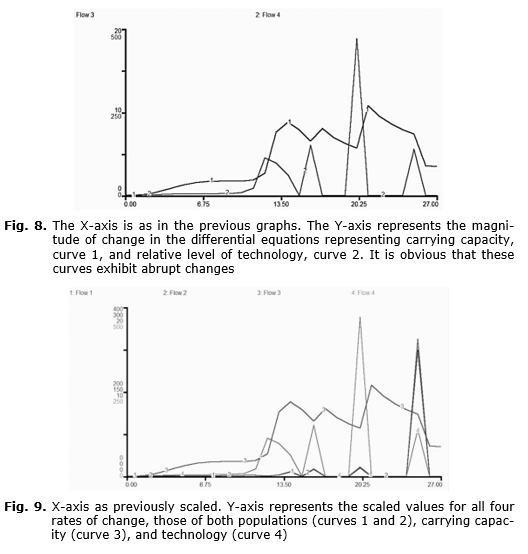
Fig. 3. Axes are as in the previous two graphs, but the third curve has been added, one representing changes in technology over the same period of time represented by the curve 3
If attention is now turned to the plots for the differential equations of the model, i.e. dN1/dt = r1N1[K – (N1 + N2)], dN2/dt = r2N2[K – (N1 + N2)], dK/dt = (T – N)/K, and
dT/dt = T/[K – (N1 + N2)], it can be seen that all four equations behave episodically.
In Fig. 4 the rates of change of both populations 1 and 2 change simultaneously, and their magnitude reflects the pattern of total population size in all the phases of stasis represented in Figs 1, 2, and 3. It is also of note that these changes in population growth are not continuous, i.e. that growth rate above zero occurs briefly and is synchronous with periods or phases of punctuation, as can be seen in Fig. 5.
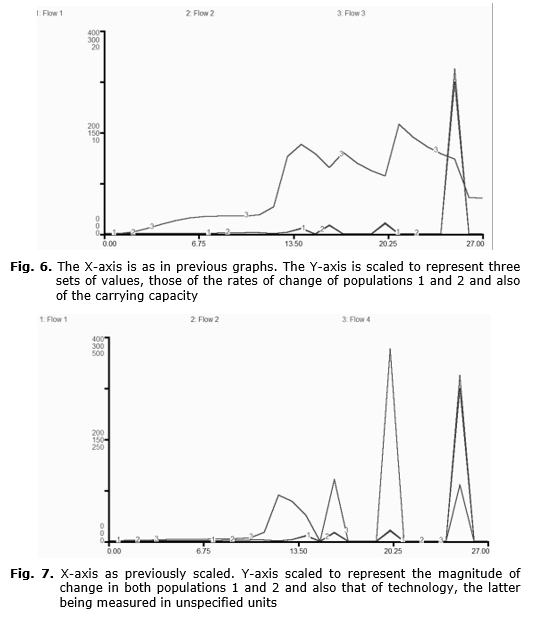
If we now consider the relationship between population change and carrying capacity change in Fig. 6, it can be seen that each peak in population growth rate coincides with an abrupt change in slope of the graph of carrying capacity change. And in two out of four instances the population growth rate change, the first and last, the peaks coincide with points of abrupt change in carrying capacity change from positive to negative slope, and with regard to the middle two rate change peaks for population change the relationship is reversed so that the change in slope associated with carrying capacity is from negative to positive. One further observation, as the rate of change of both populations becomes negative, the rate of change of carrying capacity becomes positive (see Fig. 6). However, following the right-most peak of the population curves all curves exhibit steep negative slopes.
When considering the relationship between the pattern of change for the populations of this model with respect to that of technology, it can be seen that each peak of population growth rate change coincides with either a peak in technology change or an abrupt change in slope from negative to more negative as in the case of the first synchronous population rate peak. In both cases the negative slopes of all peaks exactly coincide.
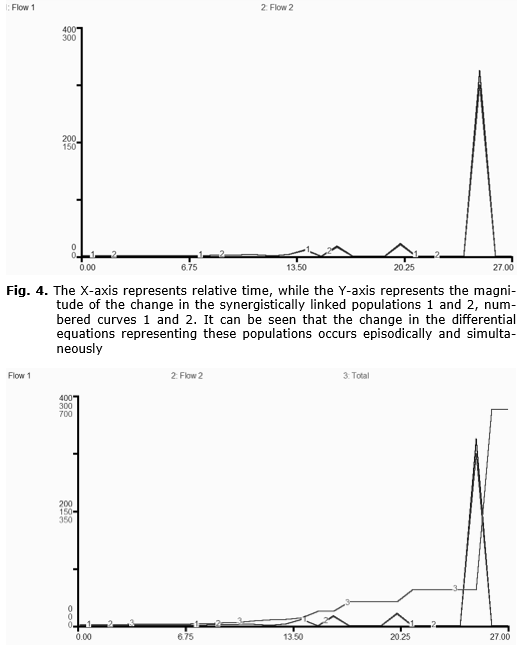
Fig. 5. The X-axis represents unscaled time. The Y-axis represents the magnitude of change in both populations 1 and 2 (curves 1 and 2), and the magnitude of their combined populations (curve 3). It can be seen that the peaks of each episode of rapid change in the differential equations for populations 1 and 2 correspond to the beginning of each phase of punctuation
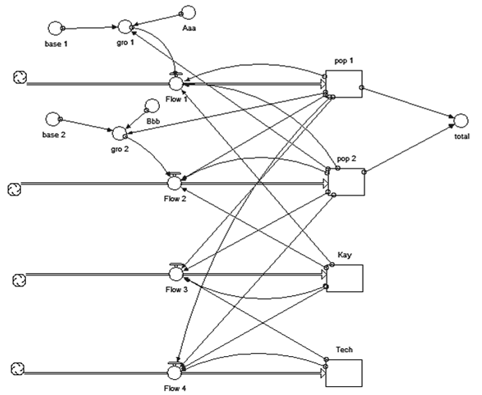
Finally, if all four rates of change are considered together (see Fig. 9), a clear pattern emerges in which the peaks of both combined population change and change in technology are offset from those of carrying capacity. In each case in which the coincident peaks of population change and change in technology occur, the peak in carrying capacity follows one time-step later. This description, however, is in no way meant to infer mechanism per se, and this will be dealt with in the following section.
What are the implications of this mathematical model of punctuated growth with respect to the macropattern of urbanization? In common parlance, what is it good for? At the outset of this paper I suggested that there are three precepts or conditions that the model should be designed to meet. Those conditions are: 1) The model must be as simple as possible, yet yield significant results, i.e. in the initial wording, be functional; 2) The model has to exhibit both punctuated growth and stasis; 3) The growth phase of model behavior has to exhibit hyperbolic growth. Have those conditions been met? What does the model suggest about the interplay between the three major parameters of the model, population size, carrying capacity, and technology? To what extent is this model a model of the growth behavior of complex systems in general? Finally, what adjustments and adaptations can be (and, perhaps, should be) made to improve the model for future application?
Regarding the initial condition, that the level of simplicity the model has and its ability to be functional, while not all the evidence is in, in that the model has not been tested exhaustively, the model is certainly simple enough to construct, to embed within the software used, simple enough at surface level to understand, and yet produces useful results. So, this first condition of simplicity with functionality seems to be met. The second condition, that of exhibiting the specific type of behavior, punctuation and stasis, that empirical evidence yields regarding macropattern changes in urbanization over time, this condition too has been met. However, the final condition of the model producing hyperbolic growth can only be inferred. Since the time step, dt, was set at dt = 1 and since the actual punctuated changes occur within that time step, it can only be inferred that the rate of change is greater than exponential even though the change is quite rapid. So, until further research is done on model behavior, formally at least there is no confirmation that the third condition has been met.
The diversity of graphical evidence presented in the Results section suggests a potentially rich repertoire of model behavior. On initially running the model, the punctuated behavior of the model was completely unexpected and, at least with respect to what could be predicted by inspection of the model only, represents an emergent phenomenon. The major question to ask then is: What is the cause of this punctuated behavior? Does it occur over a wide range of values of the variables of the model?
Addressing the first question, in Fig. 1 the evidence of punctuated population growth is clear, and when Figs 2 and 3 are inspected, it is seen that while carrying capacity does not exhibit punctuated growth in sync with changes in population, the carrying capacity does exhibit synchronous changes in slope. Technology, on the other hand, does exhibit synchronous punctuated changes with population size. At the level of resolution of the three primary variables there is then synchroneity of change, but there appears to be no immediate evidence for the mechanism of this change. However, if the rates at which these changes occur is considered a potential solution becomes apparent.
If Figs 4 and 5 are inspected, it will be seen that the rates of change of the interacting populations are in sync with the punctuated behavior of the total population, an unsurprising result. However, if these rates of change, i.e. the rates of change of populations 1 and 2, are compared with the rate of change of the carrying capacity, a different picture emerges. It can be seen in Fig. 6 that three of the four maxima for the population rates of change coincide with minima for the rate of change of carrying capacity, while in Fig. 7 the rate of change of technology exhibits peaks which are synchronous with the last three population rate of change peaks and in which both technology and population rate of change exhibit reduction, i.e. a negative slope, after each population peak. In Fig. 8, however, which compares rates of change in technology and carrying capacity it can be seen that the peaks in carrying capacity precede those of the rate of change in technology, as to be predicted from the data of Figs 6 and 7. If attention is paid to the left hand side of the graph in Fig. 8, it is quite clear that carrying capacity rate of change exceeds that of technology for a significant period of time. In other words, the rate of change of carrying capacity exceeds that of both the total population and also technology prior to their own periodic local maxima.
I have a simple mechanism to propose to explain the interactions between population, carrying capacity, and technology. Initially, carrying capacity must always exceed (in relative terms) both the rates of change of population and technology. In turn, this positive difference in carrying capacity rate of change provides (numerical) space for the subsequent increase in the rates of change of both total population and technology. Increasing the rates of change of total population and technology then reduces carrying capacity to a local minimum at the same time as total population and technology reach a local maximum. Stasis is established when the rates of change for both total population and technology are maintained at zero. This is an admittedly Malthusian explanation, and one that makes general sense in that both population growth and the rate of the exploitation of technology and therefore resources require an appropriate gap between those rates of change and that of the carrying capacity.
The third question is much more difficult to address, and I will only allude to a possible outcome, which at this point in the development of the model is little more than a suggestion of the possibility of a general model of complex system growth. First, recall that Bak (1996) and Flyvbjerg et al. (1993) have already provided a model of such growth based on the concept of self-organized criticality. What is being suggested here, however, is that in (relatively) complex systems, and perhaps the term, complex adaptive systems, should be used, and even though it may appear that such systems are more amenable to agent based modeling, that the interplay between the subparts of such a complex system produce thresholds above which the system can only arise when a key subcomponent exceeds some threshold value. In the case of the current system of equations, the rate of change of the carrying capacity has to reach some maximum prior to the system as a whole, i.e. the other two parameters, total population and carrying capacity, moving to the next threshold level. Thus, while punctuated growth is, I believe part-and-parcel of complex system behavior, it is very far from being demonstrated firmly, let alone proven, that this mode of growth in fact is a general characteristic of complex systems.
With regard to the implications of the model, this leaves only model improvements for consideration. Five areas needing improvement will be considered. If one considers Harper (2017), it will be clear that there are two obvious differences between the punctuated patterns actually exhibited by urbanization over time, first, that the phases of punctuation occur over several centuries, two at least in the case of the current phase of punctuation, and that the stasis of the actual world-system is relative in that there is oscillation about a mean. In order for the model to develop more explanatory power, it will have to account for these two characteristics of the system. This perhaps can be brought about by including appropriate coefficients and exponents, especially for the equations for both carrying capacity and technology. Also, it has not been firmly established what the range of initial values is that will permit this particular system of equations to behave in a punctuated fashion. Finally, the system of equations analysed here does not directly represent urbanized populations, only population magnitude in general. This needs to be changed.
What has been presented here in this section then are a series of evaluations of the worth or significance of the model of the punctuated growth of a complex system, one reflecting the behavior recognized in the macropattern of urbanization over time (Harper 2017). The model is also as referred to previously as what is hopefully only a shadow of its future self. However, this model does relate population, carrying capacity, and technology in such a way as to represent what can only be described as an emergent phenomenon, the punctuated growth of a complex system.
References
Bak, P. 1996. How Nature Works: The Science of Self-Organized Criticality. New York: Copernicus.
Eldridge, N., and Gould, S. J. 1972. Punctuated Equilibrium: An Alternative to Phyletic Gradualism. In T. J. M. Schopf (ed.), Models in Paleobiology. (pp. 82–115). San Francisco: Freeman Cooper.
Flyvbjerg, H., Sneppen, K., and Bak, P. 1993. Mean Field Theory for a Simple Model of Evolution. Physical Review Letters 71(24).
Forester, von H., Mora, P. M., and Amiot, L. W. 1960. Doomsday: Friday, November 13, A.D. 2026. Science 132: 1291–1295.
Harper, T. 2017. The Punctuated Equilibrium Macropattern of World-System Urbani-zation and the Factors that Give Rise to that Macropattern. Social Evolution and History 16(1): 86–127.
Korotayev, A., Malkov, A., and Khaltourina, D. 2006. Introduction to Social Macrodynamics: Compact Macromodels of the World System Growth. Moscow: Editorial URSS.
Levins, R. 1968. Evolution in Changing Environments. Princeton: Princeton University Press.
Appendix
The figure below represents the visual construction of the model presented in this paper in the language of a STELLA diagram. Note that the names of the various symbols do not explicitly match the variables of the differential equation form of the model.
The equations below represent the format of the mathematical operations done associated with each of the symbols in the flow chart representation in the mode of the STELLA software of the model presented in this paper.
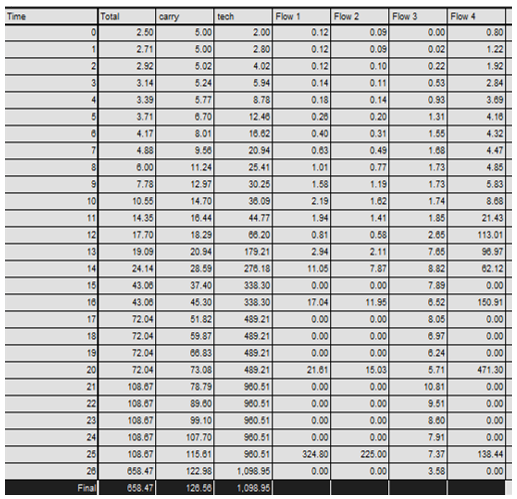
The table below represents all the data points generated through twenty-seven generations in which the time step, dt, is one unit.
* This article was first published in History & Mathematics: Economy, Demography, Culture, and Cosmic Civi-lizations. Yearbook / Edited by Leonid E. Grinin, and Andrey V. Korotayev. – Volgograd: ‘Uchitel’ Publishing House, 2017. Pp. 200–217.
[1] URL: http://peterturchin.com/cliodynamics/.