Students and Sociopolitical Destabilization: A Quantitative Analysis

Almanac: History & Mathematics:Entropy and Destabilization
DOI: https://doi.org/10.30884/978-5-7057-6233-0_07
There are reasonable grounds to expect that the increasing proportion of students in the total population may be accompanied by socio-political destabilization. However, as far as we know up to the present there has been no empirical testing of this theoretical assumption. The empirical verification is provided in this article. And this theoretical expectation supported by empirical tests. Our research suggests that students as a social group can be seen in some respects as an important factor of destabilization. It demonstrates statistically significant positive correlations between the proportion of students in the total population and important indicators of socio-political destabilization, such as the intensity of political strikes, riots and especially anti-government demonstrations. A particularly strong positive correlation between the proportion of students in the population and the intensity of anti-government demonstrations is observed in the per decile analysis. The significant difference in the correlation between the proportion of students and the intensity of riots, on the one hand, and the proportion of students in the population and the intensity of anti-government demonstrations, on the other (with the advantage in the strength of the correlation towards anti-government demonstrations), is to a certain extent explained by gender factor. The fact is that the growing number of female students at a certain stage of the development of the country and its education system does not contribute to the intensity of riots, but it does contribute to the intensity of anti-government demonstrations. However, equally important is the absence of statistically significant correlation between the proportion of students in the total population and such indicators of socio-political destabilization as the intensity of political assassinations and major terrorist and ‘guerrilla’ attacks. Thus, the high proportion of students in the population correlates with an increasing level of mass destabilization (and especially with an increasing level of mass non-violent destabilization). At the same time, it turned out that the increasing number of students can be not only destabilizing but also in some respects a stabilizing factor. It was revealed that there is a negative rather than positive correlation between the proportion of students in the population and the intensity of coups and attempted coups, since the large number of students in a country will not facilitate but complicate coups. Thus, while a high proportion of students in the population contributes to mass socio-political destabilization, it rather makes it difficult to implement such a classic elitist form of regime change as a coup d'état.
Keywords: students, destabilization, mass non-violent destabilization, anti-government demonstrations, factor of destabilization, gender factor.
Many researchers have already drawn attention to the fact that students can act as a powerful socio-political destabilizing force.
A number of scholars point out that students are a unique social group whose worldview is shaped by two main sets of factors: first, by the psychophysiological qualities of the young individual in transition (Altbach 1970), and second, by the qualities that the individual acquires at university, for example critical thinking, broad outlook, etc. (Fields 1969). It is important to note that there are some tendencies in the student population that determine the propensity to participate in protests. First and foremost, students studying humanities are most prone to participate in protest activities (Pustoshinskaya 2010). In addition, undergraduate students as well as non-resident students are the most susceptible to radical ideas (Altbach 1970).[1]
In terms of the social position of students as a specific social group, it is important to note that student community combines in a special way the quali-ties inherent in different social classes and groups which actively participate in social protests. First, students can be considered as a special type of the intellectuals which, as we know, are a social group that tends to take a more critical view of governmental actions and social ills and evils of society. This is particularly true of the humanitarian intellectuals (see above). The intellectuals have a broad outlook, basic knowledge and analytical skills, they identify themselves as a strata with an intellectual function in society, and often consider themselves as the 'conscience of the nation'. Intellectuals, especially in developing countries and in societies where a considerable part of population is illiterate, also often consider themselves serving as fulfilling messianic functions. The peculiar feature of students is that they act as a kind of ‘strike force’ of the intellectuals, as neophytes, sometimes directly encouraged by their teachers. Second, students have a similar feature to the proletariat, namely concentration. Universities and higher education institutions bring together thousands and tens of thousands of students, who also often live on campuses. Consequently, organizing protests of all kinds is greatly facilitated. It may happen easier if students are organized along ethno-linguistic, religious or racial lines.
Finally, one should note that students, as a young and educated part of the population, are inclined to use new forms of agitation, propaganda, communication and organization, which often further strengthens the protests and their impact. To some extent, students also have another feature inherent in the proletariat and even Lumpenproletariat (in revolutionary theory and practice the latter is sometimes described as the most radical element). This is not just about young (age) rebellion (see above), but also about a willingness to sacrifice oneself for an idea and the fact that, like proletarians and Lumpenproletarians, students often have nothing to lose as they are not (usually) burdened by family, property, positions, etc. In short, it is easier for them to take risks. Finally, a large, if not the majority, number of students are migrants who have quite large destabilizing potentials (Pustoshinskaya 2010).
To sum up, students, by their age and social characteristics, are objectively ‘flammable material’, capable of becoming a detonator for all kinds of protest and destabilization actions as well as one of the active forces of the revolution (about the role of students in revolutions and revolutionary movements, in particular in 1968, see Grinin and Grinin 2022, 2023 in this volume).
It has been pointed out that a small but cohesive core of radicals among students is capable of attracting large numbers of demonstrators to protest actions. This is often done by infiltrating various student organizations (Ibid.). For example, in 1967 during the protests at the London School of Economics (LSE), 50 left-wing student activists succeeded to attract around 35,000 participants (Levin 1970).
Of particular importance for the development of protest potential among students are the results of major social shifts that occurred in society (Rozhkov 1999). For example, for the student movement in Russia in 1887–1891 such a social shift was caused by the reforms of Alexander II (Rotmistrov 2009), for European students in 1960–1970 it was caused by the Second World War (Thomas 2002), and for the students in the Sub-Saharan region in the 1970s and 1980s – by the national liberation movement of African countries (Nkinyangi 1991). These events contributed to a rethinking of the established mores, a change in the concept of childhood education to a more 'permissive' one (Parkin 1968), as well as an influx into university community of wider segments of the population, particularly the members of working-class families (Rooke 1971).
It has been noted that student protests can also occur in a favourable national environment under the influence of particular events: student protests in other countries set off a chain reaction, prompting the local studentship to seek a cause for protest (see Thomas 2002).[2]
Thus, there are reasonable grounds to expect that the increasing share of students in the total population may be accompanied by socio-political destabilization. However, as far as we know up to the present there has been no empirical testing of this theoretical assumption. In what follows we will provide such empirical verification.
Tests
The results of our correlation analysis are as follows (see Table 1).
Table 1. Correlations between the proportion of students in the population (source data) and CNTS socio-political destabilization indicators for 1970–2015
|
Socio-Political Destabilization Indicators |
Pearson's |
Statistical |
|
1 |
2 |
3 |
|
1. Assassinations |
−0.008 |
0.583 |
|
2. General Strikes |
0.064*** |
<< 0.001 |
|
3. Guerrilla Warfare |
0.004 |
0.764 |
|
4. Government Crises |
0.035* |
0.015 |
|
5. Purges |
−0.049*** |
0.001 |
Continuation of the Table
|
1 |
2 |
3 |
|
6. Riots |
0.056*** |
<< 0.001 |
|
7. Revolutions |
−0.101*** |
<< 0.001 |
|
8. Anti-Government Demonstrations |
0.142*** |
<< 0.001 |
|
9. Integral Socio-Political Destabilization Index |
0.004 |
0.785 |
* Correlation is significant at the 0.01 < p < 0.05 level.
** Correlation is significant at the < 0.01 level.
*** Correlation is significant at the < 0.001 level.
As one can see, in six of nine tests we find statistically significant correlations: in two cases – in the negative direction, in four cases – in the predicted direction (the higher the proportion of students in the population, the higher the level of socio-political destabilization). Five of the six significant correlations have exceptionally high statistical significance (p < 0.001). There is no statistically significant correlation for assasinations, guerrilla warfare and Integral Socio-Political Destabilization Index.
Note that the positive correlations with very high significance (p < 0.001) are observed for general strikes, riots and anti-government demonstrations. It is noteworthy that these are all cases of mass socio-political destabilization, that is, types of destabilization that are characterized by the participation of large segments of the population. Such results are quite logical, as the increased proportion of students in the population tends to affect mass discontent, affecting social elites to an incomparably lesser extent than the broad masses of people. Such a form of socio-political destabilization as government crises demonstrates a markedly lower correlation, but the non-obvious nature of this indicator should be taken into account (see Appendix).
Thus, the proportion of students in the population is a statistically significant predictor of all indicators of mass socio-political destabilization – riots, general strikes and anti-government protest demonstrations.
It is no coincidence that there is a negative rather than positive correlation between the proportion of students in the population and the intensity of coups and attempted coups, as the large number of students in a country does not facilitate coups but complicates them. Thus, while a high proportion of students in the population contributes to mass socio-political destabilization, it rather makes it difficult to implement such a classic elitist form of regime change as a coup d'état.
The correlation is particularly strong if the unit of observation is not a particular country but rather groups of countries distinguished by the share of students in the population. Below, all countries in the world are analyzed after dividing them into ten subgroups (deciles), with the lowest subgroup (lower decile) comprising 10 % of country-years with the lowest share of students in the population and the high subgroup (high decile) comprising 10 % of countries with the highest share of students in the population, the eight intermediate deciles are country-years with intermediate values. The per decile correlation between the share of students in the population and the intensity of riots shows the following results (see Fig. 1).
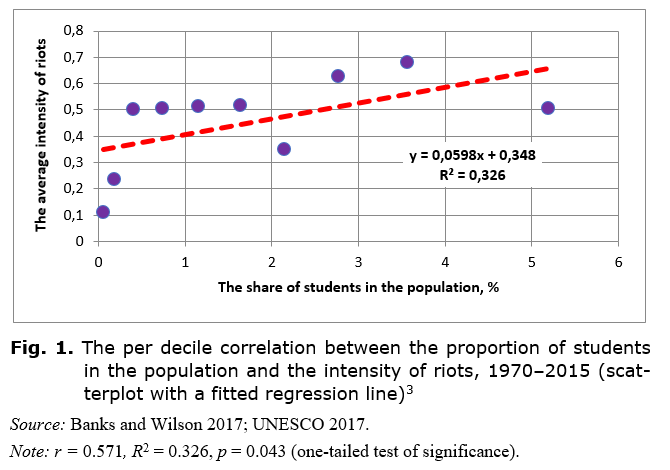
Note that the decile analysis demonstrates rather strong correlation between the proportion of students in the population and the intensity of riots. While in 10 % of country-years with the lowest proportion of students there are riots on average once every 10 years, in 10 % of country-years with the highest proportion of students there are riots every two years on average. Overall, the pro-portion of students in the population explains nearly a third of the dispersion in riot intensity by decile.
The decile analysis shows a particularly strong positive correlation between the proportion of students in the population and the intensity of anti-government demonstrations (see Fig. 2).
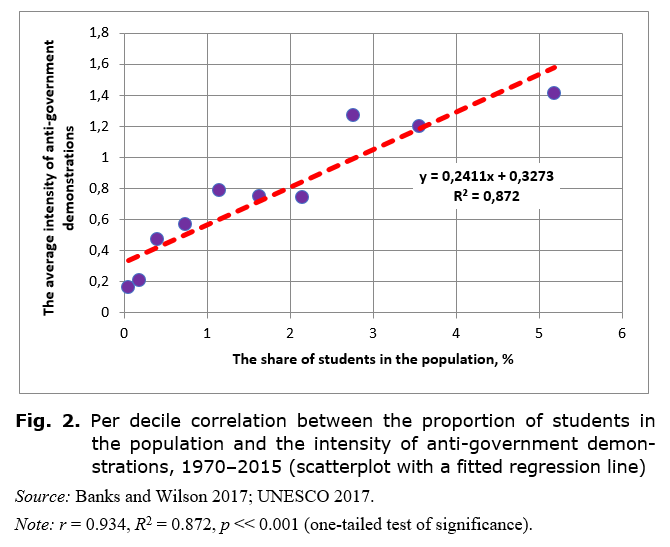
As we can see, on the basis of decile analysis the correlation between the proportion of students in the population and the intensity of anti-government demonstrations is rather strong (r = 0.934). While in 10 % of country-years with the lowest proportion of students riots occur on average less than once every five years, in 10 % of country-years with the highest proportion of students there is, on average, more than one demonstration each year. Overall, the proportion of students in the population explains almost 90 % of the variance in the intensity of anti-government demonstrations per decile.
The negative correlation between the proportion of students in the population and the intensity of coups d'états and attempted coups significantly increases in the decile analysis (see Fig. 3).
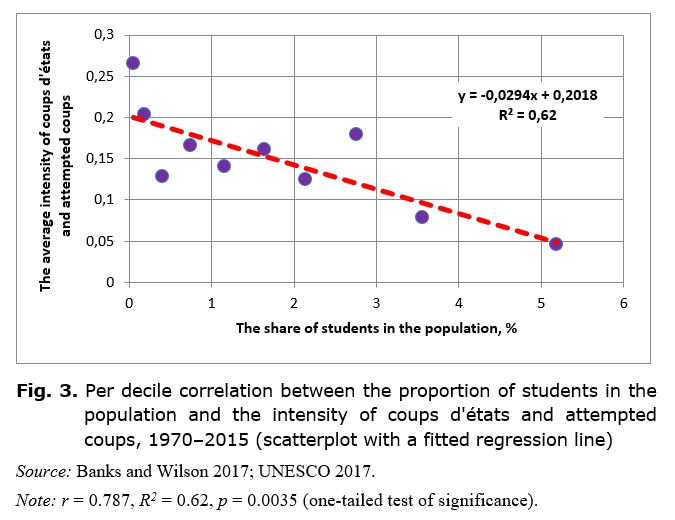
Thus, the decile analysis shows rather strong correlation between the proportion of students in the population and the intensity of coups d'états and attempted coups (r = 0.787). While in 10 % of country-years with the lowest proportion of students in the population the coups d'états and attempted coups take place on average every four years, in 10 % of country-years with the highest proportion of students in the population no more than one coup d'état (or attempted coup) takes place every 20 years. Overall, the pro-portion of students in the population explains more than 60 % of the dispersion of the intensity of coups d'états and attempted coups by decile.
It is noteworthy that quite different correlations are observed when dividing students by gender: the proportion of male students in the population correlates with various indices of socio-political destabilization quite differently from the proportion of female students.
Thus, the proportion of male students in the total population correlates[4] with the intensity of riots almost twice as strong as the proportion of students as a whole (see Fig. 4).
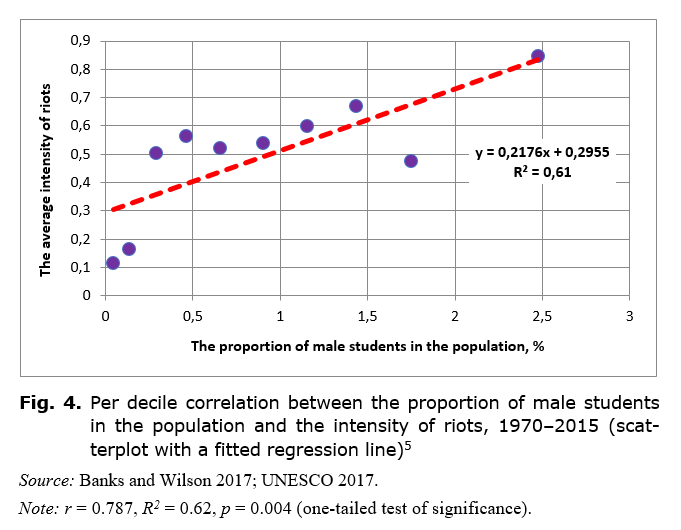
It is obvious that the per decile analysis shows a rather strong correlation (r = 0.781) between the proportion of male students in the population and intensity of riots, in contrast to the correlation between the proportion of both sexes which was average in strength (see Fig. 1). While in 10 % of country-years with the lowest proportion of male students in the population riots take place on average once every 10 years, in 10 % of country-years with the highest proportion of male students in the population riots take place on average nearly every year. Overall, the proportion of male students in the population explains more than 60 % of the dispersion of riot intensity by decile (while the proportion of students of both sexes explained only about 30 %).
The correlation between the proportion of female students and intensity of riots is predictably much weaker and at the same time statistically insignificant (see Fig. 5).
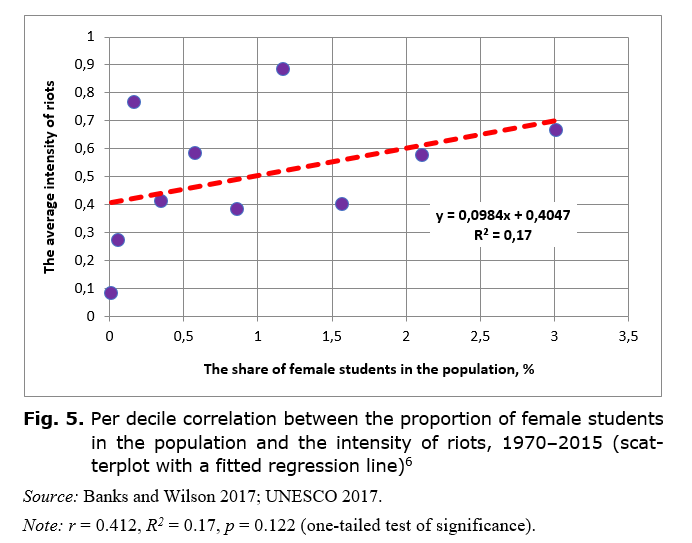
As we can see, the decile analysis demonstrates the weak (r = 0.412) and statistically insignificant (p > 0.12) correlation between the proportion of female students in the population and the intensity of riots.
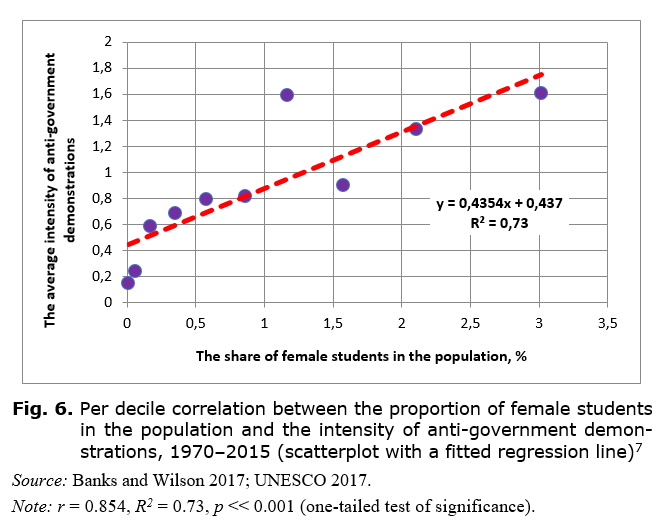
At the same time, the proportion of female students shows a statistically significant and strong correlation with the intensity of anti-government demonstrations (see Fig. 6).
Conclusions
Many researchers have pointed out that there are reasonable grounds to expect that an increase in the proportion of students in the total population may be accompanied by some socio-political destabilization. However, as far as we know, up to the present there has been no empirical testing of this theoretical assumption. Empirical verification is provided in this article. And this theoretical expectation has proved to be correct. Our research has confirmed that students as a socio-age group can be seen in some respects as an important factor of destabilization. It demonstrated statistically significant positive correlations between the proportion of students in the total population and important indicators of socio-political destabilization, such as the intensity of political strikes, riots and especially anti-government demonstrations. The per decile analysis shows the strongest correlations. Thus, the intensity of riots increases fivefold from the first to the last decile (while in 10 % of countries with the lowest proportion of students riots take place on average once every ten years, in 10 % of countries with the highest proportion of students they take place on average once every two years), with a coefficient of determination exceeding 30 %. However, a particularly strong positive correlation is observed in the per decile analysis between the proportion of students in the population and the intensity of anti-government demonstrations. The per decile analysis reveals a particularly strong positive correlation between the proportion of students in the population and the intensity of anti-government demonstrations.
The significant difference in the correlation between the proportion of students and the intensity of riots, on the one hand, and the proportion of students in the population and the intensity of anti-government demonstrations, on the other (with the advantage in the strength of the correlation towards anti-government demonstrations), is to a certain extent explained by gender factor. The fact is that the growing number of female students at a certain stage in the development of the country and its education system does not contribute to the intensity of riots, but it does contribute to the intensity of anti-government demonstrations.
However, equally important is the absence of statistically significant correlation between the proportion of students in the total population and such indicators of socio-political destabilization as the intensity of political assassinations and major terrorist and ‘guerrilla’ attacks. Thus, the high proportion of students in the population correlates with an increased level of mass destabilization (and especially with an increased level of mass non-violent destabilization).
At the same time, it turned out that an increasing number of students can be not only destabilizing, but also in some respects a stabilizing factor. It was revealed that there is a negative rather than positive correlation between the proportion of students in the population and intensity of coups and attempted coups, since the large number of students in a country will not facilitate coups but will complicate them. Thus, while a high proportion of students in the population contributes to mass socio-political destabilization, it rather makes it difficult to implement such a classic elitist form of regime change as a coup d'état. The correlation is particularly strong if we take not individual countries as the unit of observation, but groups of countries distinguished by the proportion of students in the population.
References
Altbach P. G. 1970. Students and Politics. Protest, Reform, and Revolt: A Reader in Social Movements / Ed. by J. Gusfield, pp. 225–244. New York: John Wiley & Sons Australia Ltd.
Banks A. S., and Wilson K. A. 2017. Cross-National Time-Series Data Archive. Databanks International. Jerusalem, Israel. URL: https://www.cntsdata.com.
Fields A. B. 1969. The Revolution Betrayed: The French Student Revolt of May – June 1968, Students in Revolt. Boston: Houghton Mifflin.
Gellar S. 1982. Senegal: An African Nation between Islam and the West. Boulder: Westview Press.
Grinin L., and Grinin A. 2022. Revolutionary Waves and Lines of the 20th Century. Handbook of Revolutions in the 21st Century: The New Waves of Revolutions, and the Causes and Effects of Disruptive Political Change / Ed. by J. A. Goldstone, L. E. Grinin, and A. V. Korotayev, pp. 315–388. Springer. Doi.org/10.1007/978-3-030-86468-2_12.
Grinin L. E., and Grinin A. L. 2023. Revolutionary Process of the 20th Century: A Quantitative Analysis. History & Mathematics: Entropy and Destabilization / Ed. by L. E. Grinin, and A. V. Korotayev, pp. 88–173. Volgograd: Uchitel.
Levin B. 1970. The Pendulum Years: Britain and the 60s. London: Jonathan Cape.
Nkinyangi J. A. 1991. Student Protests in Sub-Saharan Africa. Higher Education 22(2): 157–173.
Parkin F. 1968. Middle Class Radicalism: The Social Bases of the British Campaign for Nuclear Disarmament. Manchester: Manchester University Press.
Pustoshinskaya O. S. 2010. Sociodemographic Foundations of Student Political Protest. Almanac of Modern Science and Education 5: 124–127. In Russian (Пустошинская О. С. Социально-демографические основы студенческого политического протеста. Альманах современной науки и образования 5: 124–127).
Rooke M. A. 1971. Anarchy and Apathy: Student Unrest: 1968–70. London: Hamish Hamilton.
Rotmistrov A. N. 2009. Comparative Analysis of Student Protest Movement Factors in Russia at the Turn of the 19th – 20th Centuries and at the Beginning of the 21st Century. Vyssheye obrazovaniye segodnya 1: 36–41. In Russian (Ротмистров А. Н. Сравнительный анализ факторов студенческого протестного движения в России на рубеже XIX–XX веков и в начале XXI века. Высшее образование сегодня 1: 36–41).
Rozhkov A. Y. 1999. The Young Man of the 20s: Protest and Deviant Behaviour. Sotsiologicheskiye issledovaniya 7: 107–114. In Russian (Рожков А. Ю. Молодой человек 20-х годов: протест и девиантное поведение. Социологические исследования 7: 107–114).
Slinko A. A., Salnikov V. I., and Dmitriyeva S. I. 2009. Studentship in Europe: Between Reform and Protest. Bulletin of Voronezh State University. Series: Problems of Higher Education 2: 127–132. In Russian (Слинько А. А., Сальников В. И., Дмитриева С. И. Студенчество в Европе: между реформой и протестом. Вестник Воронежского государственного университета. Серия «Проблемы высшего образования» 2: 127–132).
Khokhlova A. A., Korotayev A. V., and Tsirel S. V. 2017. Unemployment and Socio-Political Destabilization in Western and Eastern Europe: Experience of Quantitative Analysis. Systemic Monitoring of Global and Regional Risks / Ed. by L. E. Grinin, A. V. Korotayev, L. M. Issaev, and K. V. Meshcherina, pp. 37–82. Volgograd: ‘Uchitel’. In Russian (Хохлова А. А., Коротаев А. В., Цирель С. В. Безработица и социально-политическая дестабилизация в странах Западной и Восточной Европы: опыт количественного анализа. Системный мониторинг глобальных и региональных рисков / Отв. ред. Л. Е. Гринин, А. В. Коротаев, Л. М. Исаев, Л. М. Мещерина, c. 37–82. Волгоград: Учитель).
The 2015 Revision of World Population Prospects. 2016. United Nations Population Division. URL: http://www.un.org/en/development/desa/population/.
Thomas N. 2002. Challenging Myths of the 1960s: The Case of Student Protest in Britain. Twentieth Century British History 13(3): 277–297.
UNESCO. 2017. UNESCO Institute for Statistics. Enrollment in Tertiary Education, All Programmes, Both Sexes (Numbers). URL: http://www.data.uis.unesco.org/.
Appendix
Materials used
To test the hypothesis of the proportion of students in the population as a statistically significant factor of socio-political destabilization, as an independent variable we have chosen the UNESCO indicator ‘number of students’ (UNESCO 2017) divided by the population in a given country from 1970 to 2014 (The 2015 Revision... 2016). The CNTS database system of indicators of socio-political destabilization was taken as the dependent variable (for a description and methodology of the Cross National Time Series [CNTS] see Khokhlova, Korotayev, and Tsirel 2017: 37–82).
* This research has been supported by the Russian Science Foundation (Project № 23-18-00535).
[1] When classifying the demands made by student organizations, one can distinguish ‘educational’– the demands to improve qualitative conditions for learning, ‘national’ – the demands to solve various domestic problems (such as corruption, unemployment, racial discrimination, etc.), and ‘international’ demands (pacifism, cold war issues, etc.). Sometimes there are also material demands associated with the tuition fees reduction or an increase in scholarships. One should note that a number of researchers recognized some ‘illogicality’ in the demands. E.g., British students opposed the Vietnam War even though the UK itself was not involved in it (Thomas 2002), and African students more frequently put forward ‘international’ demands, the worse the socio-economic situation within countries became (Nkinyangi 1991).
[2] Despite some destructive element present in student protests, there is also a creative side of this process: for a number of African countries of postcolonial period, student movements became one of key factors in shaping national politics (Gellar 1982). Moreover, many state leaders (in Kenya, Mali, Malawi, South Africa, and Ghana) and party leaders (European Greens) were integrated into the legal political space from student protest movements (Nkinyangi 1991; Slinko et al. 2009).
[3] Decile boundaries for this Figure (and Figs 2–3) are as follows: the 1st decile: < 0.107 %; the 2nd decile: 0.107–0.273 %; the 3rd decile: 0.273–0.54 %; the 4th decile: 0.54–0.945 %; the 5th decile: 0.945–1.4 %; the 6th decile: 1.4–1.89 %; the 7th decile: 1.89–2.42 %; the 8th decile: 2.42–3.13 %; the 9th decile: 3.13–4.14 %; the 10th decile: > 4.14 %. It is also important to recall that the unit of observation in our calculations is not a country, but, formally, a country-year, i.e. country X at year Y.
[4] When measuring the correlation strength through the coefficient of determination.
[5] Decile boundaries for this Figure are as follows: the 1st decile: < 0.0816 %; the 2nd decile: 0.0816–0.204 %; the 3rd decile: 0.204–0.376 %; the 4th decile: 0.376–0.555 %; the 5th decile: 0.555–0.778 %; the 6th decile: 0.778–1.03 %; the 7th decile: 1.03–1.31 %; the 8th decile: 1.31–1.58 %; the 9th decile: 1.58–1.98 %; the 10th decile: > 1.98 %. It is also important to recall that the unit of observation in our calculations is not a country, but, formally, a country-year, i.e. country X at year Y.
[6] Decile boundaries for this Figure are as follows: the 1st decile: < 0.0265 %; the 2nd decile: 0.0265–0.102 %; the 3rd decile: 0.102–0.252 %; the 4th decile: 0.252–0.45 %; the 5th decile: 0.45–0.719 %; the 6th decile: 0.719–1.01 %; the 7th decile: 1.01–1.35 %; the 8th decile: 1.35–1.81 %; the 9th decile: 1.81–2.47 %; the 10th decile: > 2.47 %. It is also important to recall that the unit of observation in our calculations is not a country, but, formally, a country-year, i.e. country X at year Y.
[7] Decile boundaries for this Figure are as follows: the 1st decile: < 0.0265 %; the 2nd decile: 0.0265–0.102 %; the 3rd decile: 0.102–0.252 %; the 4th decile: 0.252–0.45 %; the 5th decile: 0.45–0.719 %; the 6th decile: 0.719–1.01 %; the 7th decile: 1.01–1.35 %; the 8th decile: 1.35–1.81 %; the 9th decile: 1.81–2.47 %; the 10th decile: > 2.47 %. It is also important to recall that the unit of observation in our calculations is not a country, but, formally, a country-year, i.e. country X at year Y.